1Department of Chemistry, Govt Nagarjuna P G College of Science, Raipur India
2Priyadarshini Institute of Technology Nagpur India
3Hrvatske Vode [Croatian Waters], Central Water Management Laboratory (CWML), Zagreb, Croatia
4Hrvatske Vode [Croatian Waters], Department of Development Zagreb, Croatia
Corresponding author Email: jenavinod@gmail.com
Article Publishing History
Received: 12/06/2019
Accepted After Revision: 15/09/2019
Sediment can accumulate trace elements in the environment. An investigative study was carried out to determine the heavy metal in the pond water sediment (n=10) samples of Raipur city Chhattisgarh. The samples were digested and analyzed for extractable metal i.e. Cd, Cr, Cu, and Pb. The extent of elemental pollution was evaluated using with the enrichment factor (EF) and geoaccumulation index (Igeo). The assessment of heavy metal was derived using the geo-accumulation index (Igeo). This study revealed that the sediment is predominantly by Cr < Pb » Cd < Cu 0.5). The highest EFs of Cu, Cd, Pb and Zn are 0.6, 0.7, 0.86 and 0.86, respectively. The Igeo and EF revealed that location 9 and location 10 were extremely enriched with all heavy metals. All location posed high ecological risk (0.5), except location1, which had moderate ecological risk. The outputs from this study are expected to provide the background levels of pollutants and help develop regional sediment quality guideline values in the present studied area.
Heavy metals, geo-accumulation index, pond sediment
Jena V, Ghosh S, Pande A, Maldini K, Matic N. Geo-Accumulation Index of Heavy Metals in Pond Water Sediment of Raipur. Biosc.Biotech.Res.Comm. 2019;12(3).
Jena V, Ghosh S, Pande A, Maldini K, Matic N. Geo-Accumulation Index of Heavy Metals in Pond Water Sediment of Raipur. Biosc.Biotech.Res.Comm. 2019;12(3). Available from: https://bit.ly/306c7PQ
Copyright © Jena et al., This is an open access article distributed under the terms of the Creative Commons Attribution License (CC-BY) https://creativecommns.org/licenses/by/4.0/, which permits unrestricted use distribution and reproduction in any medium, provide the original author and source are credited.
Introduction
Metals are important contaminants in marine environments that can be derived from natural and anthropogenic activities. Assessing metal contamination in marine sediments using ecological risk assessment approaches is important for aquatic site managers because of their abundance, toxicity, bioavailability, persistence and potential ecological risk. Sediment is often perceived as a scavenger of trace elements due to its ability to transport and accumulate trace elements. Determining the spatial distribution of trace elements in sediment is essential to provide basic information for the identification of hotspot areas and to prioritize site mitigation strategies (Li et al. 2012, Shafie et al 2013, Hossaina et al 2019, Zhang et al 2019).
Heavy metals may enter into aquatic ecosystems from anthropogenic sources, such as industrial waste water discharges, sewage waste water, fossil fuel combustion and atmospheric deposition (Linnik et al., 2000; Campbell et al., 2001; Lwanga et al., 2003). Distinguishing between anthropogenic and natural sources of elements in sediment is imperative because it is capable of determining the degree of pollution, safeguarding the health status of the aquatic system, and facilitating effective management of the coastal environment (Shafie et al. 2013). Thus, indexes such as the enrichment factor (EF) and geo-accumulation index (Igeo) are used as indicators to identify and quantity the degree of elemental pollution and to assess the intensity of anthropogenic contaminants accumulated in sediment (Barbieri 2016). Geo-accumulation indexing approach, Igeo is used to quantify the degree of anthropogenic contamination and compare different metals that appear in different ranges of concentration in the sludge (Muller 1969).
Igeo = ln (Cn/1.5×Bn) …………….. (1)
Where Cn= measured concentration, mg kg-1and Bn = geochemical background value, mg kg-1.
In eqn. 1, average values were used and 1.5 is the factor used for lithologic variations of trace elements. The geo-accumulation index compares the measured concentration of the element in the fine-grained sludge fraction Cn with the geochemical background value Bn. Average values of soil samples of the study region (which is taken as reference point) are considered as Bn values. The index of geo-accumulation consists of seven grades, whereby the highest grade reflects 100-fold enrichment above background values (Praveena et al., 2008). Förstner et al. 1993 listed geo-accumulation classes and the corresponding contamination intensity for different indices Table 1.
| Table 1: Geo-accumulation index classification | ||
| Sediment Igeo Contamination | Geoaccumulation class intensity | Index, Igeo |
| > 5 | 6 | Very strong |
| > 4 – 5 | 5 | Strong to very strong |
| > 3 – 4 | 4 | Strong |
| > 2 – 3 | 3 | Moderate to strong |
| > 1 – 2 | 2 | Moderate |
| > 0 – 1 | 1 | Uncontaminated to moderate |
| > 0 | 0 | Practically uncontaminated |
In present study, the total concentration of heavy metal (i.e. As, Cd, Cr, Cu, and Pb), loads in soils samples collected is investigated. This study will helps in finding the contamination level of Heavy metals in various pond sediment in Raipur city. This study focused specifcally on risk assessment of sediment metal contaminants. Details about sediment metal analysis have been described in greater detail by Zhang et al. (2019).
Experimental
Collection of sample
The samples were collected from different pond sediment of Raipur city. The samples were dried, grinded to a fine powder with mortar and passed through a sieve of 0.1 mm size.
Chemical and reagents
The AR grade (E. Merck) chemicals were used for digestion of the soil and plant samples. The ICP multi-element standard (E. Merck) and the European standard 13346:2000 EN 13346:46 were used for the quality control of the data.
Preparation of sample
The sludge samples air dried weighed and placed in a dehydrator at approximately 80°C for 48-72 hours depending on sample size. The samples were ground to a fine powder with mortar and passed through a sieve of < 0.1 mm mesh size. The weighed amount (0.5 g) of the sample was digested with 5 ml HNO3 + 2 ml HClO4 + 1 ml HF in the closed microwave oven as prescribed in the literature.
Analysis of sample
The Varian Liberty AX Sequential ICP-AES, were used for analysis of the trace metals in the sediment samples.
Results and Discussion
Contents of heavy metals
The content of elements i.e. Cr, Cu, Pb, Cd, and Zn they ranged from Cr (6.4 – 15.3 mg kg-1), Cu( 8.5-14.2 mg kg-1) Pb (0.8 -3.9 mg kg-1), Cd (6.5-17.2 mg kg-1) and Zn ( 6.4- 21.2 mg kg-1). with mean value 8.1, 8.8, 1.5, 8.9, and 7.4 mg kg-1, respectively. Chromium concentration ranges from 6.4 – 15.3 mg kg-1with a mean value of 8.1 mg kg-1. A moderately high positive correlation with Zn, Pb and Cu was established and its concentration falls also in moderately contaminated. Cr is a low-mobility element. Wastes and sewage waters unrestrainedly disposed from steel and textile industry facilities are the source of Cr in the study area. High doses of Cr cause liver and kidney damages and chromate dusts are known to be carcinogenic (Jumbe & Nandini, 2012) Cadmium concentration ranges from 6.5-17.2 mgkg-1 with mean value 8.9 metal mgkg-1. It is used as an anticorrosive, electroplated on steel; cadmium sulfide and selenide are commonly used as pigments in plastics, batteries and in various electronic components. It is also used with inorganic fertilizers produced from phosphate ores and when these products are no more servisable, they are thrown into the dump as waste. During decomposition, the Cd component is leached into the surrounding soil and over time gets accumulated in the soil. Cadmium is extremely toxic and the primary use of soil high in Cd in form of manure for the cultivation of vegetables and other food crops could cause adverse health effect to consumers such as renal disease and cancer (Gorenc et al., 2004). Moreover, when ingested by humans, cadmium accumulates in the intestine, liver and kidney and chronic exposure of Cd causes proximal tubular disease and osteomalacia (Pascual et al., 2004). Therefore, the soils from this dumpsite are not suitable for agricultural purposes. Concentration in Copper varied from Cu( 8.5-14.2 mg kg-1) with an average value of 48.8 mg/kg. A moderately high positive correlation with Cd was established. Copper is widely used in electrical wiring, roofing, various alloys, pigments, cooking utensils, piping and in the chemical industries. Copper compounds are used in fungicides, algicides, insecticides, wood preservation, electroplating, dye manufacture, engraving, lithography, petroleum refining and pyrotechnics. It is also added to fertilizers and animal feeds as a nutrient to support plant and animal growth. Lead contamination ranges from 0.8 -3.9 mg kg-1 with mean value 1.5 mg kg-1. Lead enters to human or animal metabolism either via food chain or by intake of soil dust. Gasoline vehicles are the main source of lead pollution. Lead is non essential for plants and animals and is toxic by ingestion-being a cumulative poison (MacFarlane & Burchett, 2002). Lead toxicity leads to anaemia both by impairment of haemo-biosynthesis and acceleration of red blood cell destruction. In addition, Pb reduces sperm count, damages kidney, liver, blood vessels, nervous system and other tissues in human (Anglin-Brown et al., 1995). Other uses of lead is in the production of lead acid batteries, solder, alloys, cable sheathing, pigments, ammunition, glass and plastic stabilizers. Tetraethyl and tetramethyl lead are important due to their extensive use as antiknock compounds in petrol (Mielke et al., 1991; McAllister et al., 2005). Zn concentrations ranges from 6.4- 21.2 mg kg-1 with mean value 7.4 mg kg-1. Zinc exists as a variety of water-soluble salts. These are highly persistent in water with half-life greater than 200 days. Zinc and its salts have acute toxicity to aquatic life. Zinc acts as a catalytic or structural component in numerous enzymes, involved in energy metabolism and in transcription and translation. Zinc finds its industrial application as a coating on other base materials and acting as anti-corrosive substances (galvanising). It is also used in the manufacturing of brass, lightweight structures of aircrafts, batteries, paints and in textile industries (Gupta et al 2014)
Geoaccumulation Index
The index of geoaccumulation(Igeo) was assessed based on the values proposed by Müller 1969 and their Igeo values estimated is found in the following increasing order: Cr » Cu < Pb
| Table 1 : Geoaccumulation index (Igeo) of heavy metals in SOIL | |||||
| Location | Igeo Cr | IgeoCu | IgeoPb | IgeoCd | Igeo Zn |
| 1 | 0.87 | 0.37 | 0.02 | 1.07 | 0.67 |
| 2 | 0.62 | 0.64 | 0.8 | 0.93 | 0.68 |
| 3 | 0.28 | 0.85 | 0.86 | 0.74 | 0.87 |
| 4 | 0.16 | 0.45 | 0.87 | 0.74 | 0.98 |
| 5 | 0.18 | 0.54 | 0..8 | 0.65 | 0.96 |
| 6 | 0.27 | 0.74 | 0.78 | 0.78 | 0.98 |
| 7 | 0.87 | 0.75 | 0.68 | 0.91 | 0.787 |
| 8 | 0.74 | 0.52 | 0.92 | 0.87 | 0.92 |
| 9 | 0.87 | 0.7 | 0.86 | 1.08 | 0.94 |
| Mean | 0.540 | 0.618 | 0.724 | 0.863 | 0.865 |
| Max | 0.87 | 0.85 | 0.92 | 1.08 | 0.98 |
| Min | 0.16 | 0.37 | 0.02 | 0.65 | 0.67 |
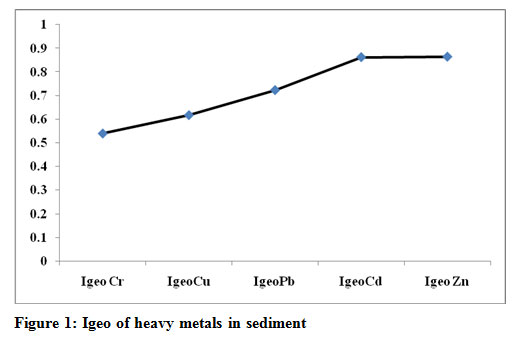 |
Figure 1: Igeo of heavy metals in sediment |
According to the Muller scale (Muller, 1981), the calculated results of Igeo values (Table 1, Figure 1) indicate that Zn (24%) and Cd (24%) can be considered as a strong pollutant at all study locations ( Igeo >0.85. Pb contributes (20 %) with Igeo value 0.72. Cr and Cu both shows very less degree of pollution and the contamination level. The order of contribution of various heavy metals on the basis of Igeo follows: Zn = Cd > Pb > Cu>Cr. Data reveal except location 1 at all locations are from moderately to strong polluted through Zn and Cd. Although the nature of the Igeo calculation, which involves the logarithmic function and a background multiplication factor of 1.5, is somewhat different from other pollution calculation methods discussed in this study (Looi 2019). It is found that ore extraction and processing and metallurgical industries stand atop the most polluting sources (Hossain et al, 2019, Zhang et al, 2019)
Conclusion
This study showed that most sediments samples exhibited low variation of metal distribution indicating similar and limited pollution sources. Heavy metal pollution is a nefarious issue with implications for life. In this study, geo-accumulation index were used for determining the environmental quality of sediment in terms of heavy metal accumulation. The sediment samples were suffering from moderately contaminate with the studied heavy metals according to Igeo values. The result revealed the following trend in their order of geo-accumulation in the sludge: Cr » Cu < < Pb < Cd < Zn. In near future, the whole aquatic and terrestrial environment may contaminate with the toxic elements. High concentrations of these trace metals may present potential health risk for the human populations residing in the vicinity of the studied area.
References
Anglin-Brown B Armour A and Lalor GC (1995) Heavy metal pollution in Jamaica 1: Survey of cadmium,lead and zinc concentrations in the Kintyre and Hope flat district Environmental Geochemistry and Health Vol 17 Pages 51-56
Barbieri M (2016) The importance of enrichment factor (EF) and geoaccumulation index (I geo) to evaluate the soil contamination Geology & Geophysics Vol 5(1) Pages 1-4
Campbell LM (2001). Mercury in Lake Victoria (East Africa): Another emerging issue for a Beleaguered Lake? Ph.D. dissertation, Waterloo, Ontario, Canada
Gorenc S Kostaschuk R and Chen Z (2004) Spatial variation in heavy metals on tidal flats in the Yangtze Estuary China Environment Geology Vol 45 Pages 1101- 1108
Gupta S Jena V Matic N Kapralova V and Solanki JS (2014) Assessment of geo-accumulation index of heavy metal and source of contamination by multivariate factor analysis, International Journal of Hazardous Materials Vol 2 Pages 18-22.
Hossaina MB Shantaa TB Ahmeda ASS
Hossainb MK Semme SA (2019) Baseline study of heavy metal contamination in the Sangu River estuary, Chattogram, Bangladesh, Marine Pollution Bulletin Vol 140 Pages 255-261
Jumbe AS and Nandini, N (2012), heavy metals accumulation in macrophytes in the lakes of bangalore urban, The Ecosystem, Vol 6 Pages 41-45.
Li X Liu L Wang Y Luo G Chen Xand Yang X et al (2012) Integrated assessment of heavy metal contamination in sediments from a coastal industrial basin, NE China PLOS ONE Vol 7(6) Pages 1-10.
Lin C He M Zhou Y Guo W and Yang Z (2002). Distribution and contamination assessment of heavy metals in sediment of the Second Songhua River, China Soil Sediment Contamination Vol 28 Pages 155-168
Linnik PM and Zubenko IB (2000) Role of bottom sediments in the secondary pollution of aquatic environments by heavy metal compounds, lakes and reservoirs Research and Management Vol 5 (1) Pages 11-21
Looi LJ Aris AZ Yusoff FM Isa NM and Haris H (2019) Application of enrichment factor, geoaccumulation index, and ecological risk index in assessing the elemental pollution status of surface sediments Environmental Geochemistry and Health vol 41 Pages 27-31
Lwanga MS Kansiime F Denny P and Scullion J (2003) Heavy metals in Lake George, Uganda with relation to metal concentrations in tissues of common fish species Hydrobiologia Vol 499 (1-3) Pages 83-93
MacFarlane GR and Burchett MD (2002) Toxicity, growth and accumulation relationships of copper, leadand zinc in the Gray Mangrove Avicennia marina (Forsk) Veirh. Marine Environment Research Vol 54 Pages 65-85
Mielke HW(1994). Lead in New Orleans soils: new images of an urban environment Environmental Geochemistry and Health Vol 16 Pages 123-128
Muller G (1969) Index of geo-accumulation in sediments of the Rhine River GeoJournal Vol 2 (3) Pages, 108-118
McAllister JJ Smith BJ Baptista NJA and Simpson JK (2005) Geochemical distribution and bioavailability of heavy metals and oxalate in street sediments from Rio de Janeiro, Brazil: A preliminaryinvestigation. Environmental Geochemistry and Health Vol 27 Pages 429-441.
Praveena SM Ahmed A Radojevic, M. Abdullah, MH and Aris, AZ (2008) Heavy metals in mangrove surface sediment of Mengkabong lagoon, Sabah: Multivariate and geoaccumulation index approaches International Journal of Environmental Research Vol 2 (2) Pages 139-148
Shafie N A, Aris A Z Zakaria M P Haris H Lim W Y and Isa N M (2013) Application of geoaccumulation index and enrichment factors on the assessment of heavy metal pollution in the sediments Journal of Environmental Science and Health Vol 48 Pages 182-190.
Zhang H Walker Davis E Ma G (2019) Ecological risk assessment of metals in small craft harbour sediments in Nova Scotia, Canada Marine Pollution Bulletin Vol 146 Pages 466-475

