1Department of Ophthalmology, King Abdulaziz University Hospital, Jeddah, Saudi Arabia
Corresponding author email: nawaf.almarzouki@gmail.com
Article Publishing History
Received: 05/10/2020
Accepted After Revision: 10/12/2020
The present study was carried out to determine the normative value of the optic disc size, interocular and gender differences and correlate disc size to glaucoma patients measured with Cirrus HD-OCT (Carl Zeiss Meditec, Inc., Dublin, California) device in Saudi population. Retrospective cross-sectional study which included 416 subjects was done. Optic nerve head imaging was obtained by Cirrus HD-OCT (Carl Zeiss Meditec, Inc., Dublin, California) using optic disc scans. Cirrus HD-OCT with the optic disc cube 200×200 protocol was implemented for all subjects, which was divided into 3 groups: normal, glaucoma suspects and glaucoma patients and comparison between groups was carried out using ANOVA test. The mean age of subjects included in the study was 54.9 years ± 15.38 with 47.8% males and 52.2 % females. Comparison of the interocular difference in disc area in the same subject was found to be slightly larger in the right eye than the left eye (1.98 mm and 1.97 respectively) (ns). Disc area in females was significantly larger than males (p-value= 0.042). Glaucoma suspect patients had larger disc area with an average of 2.19 mm2 in comparison to normal and glaucoma patients (p-value= 0.004). Cirrus HD-OCT is essential for optic disc analysis and quantitative assessment of the ONH. The observed differences in ONH measurements between females and males, glaucoma suspect, and other groups needs further longitudinal studies to evaluate its clinical importance and glaucoma associated risk. In addition, further studies comparing disc size in different regions of Saudi Arabia are recommended.
Glaucoma, Measurement Techniques, Optic Disk Area, Optical Coherence Tomography
Almarzouki N. Evaluation of Optic Disc Area Using Cirrus HD- Optical Coherence Tomography in Saudi Population. Biosc.Biotech.Res.Comm. 2020;13(4).
Almarzouki N. Evaluation of Optic Disc Area Using Cirrus HD- Optical Coherence Tomography in Saudi Population. Biosc.Biotech.Res.Comm. 2020;13(4). Available from: https://bit.ly/382dgyP
Copyright © Almarzouki This is an Open Access Article distributed under the Terms of the Creative Commons Attribution License (CC-BY) https://creativecommons.org/licenses/by/4.0/, which permits unrestricted use distribution and reproduction in any medium, provide the original author and source are credited.
INTRODUCTION
The optic disc represents the start of the optic nerve and it is the point where the axons of retinal ganglion cells come together and exit the eye globe. The optic disc is located 3 to 4 mm from the nasal side of the fovea. It is a vertical oval, with average dimensions of 1.76mm horizontally by 1.92mm vertically (Duane TD, 2006).Direct measurement of the optic disc size is only possible during vitreoretinal surgery or histologically(Garway-Heath et al., 1998). Therefore, several correction factors have been developed to compensate for the camera and eye magnification error (Ansari-Shahrezaei and Stur, 2002). The optical coherence tomography (OCT) has been used to assess optic disc topography in clinical practice. This device provides in vivo cross-sectional scans of retinal structures by the use of low-coherence interferometry (Huang et al., 1991) (Wang et al., 2019).
Ophthalmological assessment of the optic disc is essential for the ocular and neurological health (Hoffmann et al., 2007) (Jonas and Budde, 2000). In particular, the assessment of glaucoma diagnosis and evaluation of progression (Jonas et al., 1999) (Michelessi et al., 2015). yet, it is debatable whether disc size is an independent risk factor for glaucoma or not (Hoffmann et al., 2007). Physiologically, disc size is known to vary largely between populations, among individuals and between eyes (Mansour, 1991) (Bass and Sherman, 2004) (Mays El-Dairi, 2020). The Baltimore Eye Survey report showed significantly larger discs in males compared to females (Varma et al., 1994). Moreover, African Americans found to have a larger discs compared to white individuals (Varma et al., 1994) (Ocansey et al., 2020). In regard to age, it does not appear to be associated with disc size in humans. In (Jonas et al., 1991) study , optic disc size in patients with glaucoma was slightly larger than in healthy individuals ( Bayer et al.2020).
These differences must be considered when evaluating the optic disc. Every clinician has at one time or another examined a patient who was misdiagnosed as glaucoma or whose diagnosis of glaucoma was missed. Although glaucoma can exist with normal intraocular pressure, clinicians often rely on the presence of visual-field defects, the degree of optic disc cupping and retinal nerve fiber layer thickness measurement by OCT (Girkin et al., 2003) (Tao et al., 2017) (Lee et al., 2018) (Fox 2020).
Up to the present knowledge, there are no studies conducted in Saudi Arabia to evaluate the optic disc size and correlate the disc size to glaucoma susceptibility. The aim of the current study was to determine the optic disc size, interocular and gender differences and correlate disc size to glaucoma patients measured with Cirrus HD-OCT (Carl Zeiss Meditec, Inc., Dublin, California) device.
MATERIAL AND METHODS
The study is a retrospective cross-sectional study carried at King Abdulaziz University Hospital, Jeddah, Saudi Arabia. The study adhered to the tenets of the Declaration of Helsinki. Medical records from glaucoma clinic was reviewed from January 2019 to December 2019. The data included were the patient age, gender, glaucoma status, intra-ocular pressure. Optic disc size measured using Cirrus HD-OCT (Carl Zeiss Meditec, Inc., Dublin, California) optic disc scans. Cirrus HD-OCT with the optic disc cube 200×200 protocol was implemented for all patients. Subjects were divided into 3 groups as shown in table 1. Inclusion criteria were age >18 years, good OCT scan quality defined as scans with signal strength ≥ 6. Exclusion criteria were poor OCT scan quality with signal strength <6, optic nerve disc pathology such as papilledema and congenital optic nerve anomaly.
Table 1. Subjects groups characteristics
| Group | IOP | Optic Disc | Visual field |
|
Normal |
≤ 21mmHg |
a. C/D* ratio ≤ 0.5
b. no asymmetric C/D ratio ≥0.2 c. absent of notching or narrowing of the neuroretinal rim |
Normal vf |
|
Glaucoma suspect1 |
>21mmHg |
a. C/D > 0.5
b. asymmetric C/D ratio ≥0.2 c. notching or narrowing of the neuroretinal rim |
Visual field abnormality consistent with glaucoma |
|
Glaucoma2 |
>21mmHg |
a. C/D > 0.5
b. asymmetric C/D ratio ≥0.2 c. notching or narrowing of the neuroretinal rim |
Glaucomatous visual field defect |
*C/D: cup to disc ratio
1Prescence of at least 1 of the finding
2Presence of at least 2 findings
Statistical Analysis: Data were analyzed using IBM SPSS software (version 23). Descriptive analysis of variables (frequency, mean and standard deviation) was performed. Independent t-test was used for gender comparison in regard optic disc area. When comparing right eye disc area and left eye disc area, dependent t-test was used. Univariate analysis, which compared differences between the glaucoma, glaucoma suspects and normal groups, was done using ANOVA. A P-value of < 0.05 was considered to be statistically significant.
RESULTS AND DISCUSSION
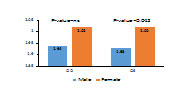
Total of 416 subjects were included in the study (47.8% male and 52.2 % female) with average age of 54.9 years ± 15.38. When comparing disc area for both eyes in the same subject, Right eye (OD) found to be slightly larger disc area compared to the left eye (OS) (1.98 mm and 1.97 respectively), ns. Differences between male and female disc area are shown in Figure 1. In regards of glaucoma classification group, disc area measurement is shown in table 2.
Table 2. average disc area in group subjects
| Glaucoma classification | Frequency | Avg. Disc area | P value |
| Normal | 152 (36.6 %) | 1.92 mm | 0.004 |
| Glaucoma suspect | 109 (26.2 %) | 2.19 mm | |
| Glaucoma | 155 (37.2%) | 1.95 mm |
Figure 1:Comparison of disc area between males and females
Several techniques such as planimetric, biomicroscopic, confocal scanning laser ophthalmoscopy (CSLO) and optical coherence tomograph (OCT) have been used to measure disc area in which all are generally strongly correlated (Hoffmann et al., 2007) (Wang et al., 2019). (Ruben, 1994) found resemblance in disc size between planimetry and biomicroscopic disc size measurements. Moreover, (Garway-Heath et al., 1997) comparison between planimetric and CSLO measurements of disc size showed no difference in normal subjects. Several reports showed correlation between OCT topographic optic disc measurements and CSLO measurements (Hoffmann et al., 2005) (Medeiros et al., 2005) (Schuman et al., 2003) . However, several reports showed that CSLO measurements of disc area is likely to be smaller than that of the OCT (Schuman et al., 2003) (Fox 2020).
The size of the optic disc can varies according to race and African American found to have larger disc area in comparison to other races (Mansour, 1991) (Varma et al., 1994) (Zangwill et al., 2004) (Ocansey et al., 2020) . Up to knowledge, no previous reports have estimated disc area in Saudi population. The mean disc in the studied subjects was 1.9mm2 ±0.45mm2 which is smaller than African American and correlated to other ethnic groups (Zangwill et al., 2004) (Ocansey et al., 2020).
It was hypothesized that Africans and African American are more susceptible to develop glaucomatous disc damage due to a larger disc size (Burk et al., 1992). However, several reports explained that different factors could explain the higher frequencies of glaucoma in African-Americans such as genetic predisposition to primary open angle glaucoma (POAG), higher chronic diseases (cardiovascular disease, diabetes and systemic hypertension), and thin corneal thickness (Fingert et al., 1999) (Herndon et al., 2004) (Grzybowski et al., 2020).
In the literature, studies have assessed the optic disc area differences based on gender (Varma et al., 1994) (Zangwill et al., 2004) . (Bowd et al., 2002) revealed no difference in disc area between males and females using CSLO. However, a large population based survey showed significantly lager disc area in males compared to females (Varma et al., 1994) (Quigley et al., 1999) (Bayer and Akman, 2020). In contrary, this study demonstrated larger disc area in females compared to males.
Correlation between disc size and glaucoma susceptibility have been evaluated in several studies (Jonas et al., 2004) (Iester et al., 1997) (Healey and Mitchell, 1999) (Mittal et al., 2018). Comparison of optic disc area between healthy people, ocular hypertension, POAG and secondary glaucoma patients using planimetric and CSLO found no difference in disc area among them (Iester et al., 1997) (Jonas et al., 2004) . However, the Blue Mountains Eye Study revealed a minimal difference in disc size in which ocular hypertensive eyes had smaller discs than patients with primary open angle glaucoma (Healey and Mitchell, 1999). Previous longitudinal studies were conducted to assess whether optic disc area is an associated risk factor for glaucoma development or progression or conversion from ocular hypertension to glaucoma (Jonas et al., 2004) (Zangwill et al., 2005) (Wang et al., 2019) . These reports showed that optic disc area was not significantly neither associated with risk of conversion nor progression (Jonas et al., 2004) (Zangwill et al., 2005) (Wang et al., 2019) (Grzybowski et al., 2020).
This study showed difference in disc area between normal subjects, glaucoma suspects and glaucoma patients in which glaucoma suspect showed larger disc area compared to other groups. However, large disc area is associated with increase the optic disc cup which can be misdiagnosed as glaucomatous cupping. The main limitation of the study is that it was a retrospective single‑center study. A multicenter study should be conducted to evaluate the disc area measurement over different regions of the country and estimate normative reference value in our population. Up to knowledge, this is the first study conducted to evaluate disc area measurement in healthy and glaucoma patients using cirrus optical coherence tomography in Saudi population.
CONCLUSION
Evaluation of optic disc size is an important part of ophthalmic examination specially in glaucoma diagnosis and management. Additionally, Cirrus HD-OCT is a valuable tool for disc analysis in clinical practice and for long-term follow up. This is in conjugation with other methods for disc assessment will enhance patients care in ophthalmology practice. Longitudinal studies are required to evaluate the correlation between disc area and other risk factors for glaucoma development such as intraocular pressure, central corneal thickness and high refractive errors using OCT and analyze its correlation with other diagnostic methods.
REFERENCES
Ansari-Shahrezaei, S. & Stur, M. (2002). Magnification characteristic of a +90-diopter double-aspheric fundus examination lens. Invest Ophthalmol Vis Sci, 43, 1817-9.
Bass, S. J. & Sherman, J. (2004). Optic disk evaluation and utility of high-tech devices in the assessment of glaucoma. Optometry, 75, 277-96.
Bayer, A. & Akman, A. (2020). Artifacts and Anatomic Variations in Optical Coherence Tomography. Turk J Ophthalmol, 50, 99-106.
Bowd, C., Zangwill, L. M., Blumenthal, E. Z., Vasile, C., Boehm, A. G., Gokhale, P. A., Mohammadi, K., Amini, P., Sankary, T. M. & Weinreb, R. N. (2002). Imaging of the optic disc and retinal nerve fiber layer: the effects of age, optic disc area, refractive error, and gender. J Opt Soc Am A Opt Image Sci Vis, 19, 197-207.
Burk, R. O., Rohrschneider, K., Noack, H. & Völcker, H. E. (1992). Are large optic nerve heads susceptible to glaucomatous damage at normal intraocular pressure? A three-dimensional study by laser scanning tomography. Graefes Arch Clin Exp Ophthalmol, 230, 552-60.
Duane Td, T., W., & Jaeger, E. A. (2006). Duane’s clinical ophthalmology: Lippincott Williams & Wilkins.
Fingert, J. H., Héon, E., Liebmann, J. M., Yamamoto, T., Craig, J. E., Rait, J., Kawase, K., Hoh, S. T., Buys, Y. M., Dickinson, J., Hockey, R. R., Williams-Lyn, D., Trope, G., Kitazawa, Y., Ritch, R., Mackey, D. A., Alward, W. L., Sheffield, V. C. & Stone, E. M. (1999). Analysis of myocilin mutations in 1703 glaucoma patients from five different populations. Hum Mol Genet, 8, 899-905.
Fox T.P., R. A., Medeiros F (2020). Utilizing Optical Coherence Tomography in Glaucoma Management, Springer.
Garway-Heath, D. F., Rudnicka, A. R., Lowe, T., Foster, P. J., Fitzke, F. W. & Hitchings, R. A. (1998). Measurement of optic disc size: equivalence of methods to correct for ocular magnification. Br J Ophthalmol, 82, 643-9.
Garway-Heath, D. F., Wollstein, G. & Hitchings, R. A. (1997). Aging changes of the optic nerve head in relation to open angle glaucoma. Br J Ophthalmol, 81, 840-5.
Girkin, C. A., Mcgwin, G., Jr., Mcneal, S. F. & Deleon-Ortega, J. (2003). Racial differences in the association between optic disc topography and early glaucoma. Invest Ophthalmol Vis Sci, 44, 3382-7.
Gordon, M. O. (2005). Baseline topographic optic disc measurements are associated with the development of primary open-angle glaucoma: the Confocal Scanning Laser Ophthalmoscopy Ancillary Study to the Ocular Hypertension Treatment Study. Arch Ophthalmol, 123, 1188-97.
Grzybowski, A., Och, M., Kanclerz, P., Leffler, C. & Moraes, C. G. (2020). Primary Open Angle Glaucoma and Vascular Risk Factors: A Review of Population Based Studies from 1990 to 2019. J Clin Med, 9.
Healey, P. R. & Mitchell, P. (1999). Optic disk size in open-angle glaucoma: the Blue Mountains Eye Study. Am J Ophthalmol, 128, 515-7.
Herndon, L. W., Weizer, J. S. & Stinnett, S. S. (2004). Central corneal thickness as a risk factor for advanced glaucoma damage. Arch Ophthalmol, 122, 17-21.
Hoffmann, E. M., Bowd, C., Medeiros, F. A., Boden, C., Grus, F. H., Bourne, R. R., Zangwill, L. M. & Weinreb, R. N. (2005). Agreement among 3 optical imaging methods for the assessment of optic disc topography. Ophthalmology, 112, 2149-56.
Hoffmann, E. M., Zangwill, L. M., Crowston, J. G. & Weinreb, R. N. (2007). Optic disk size and glaucoma. Surv Ophthalmol, 52, 32-49.
Huang, D., Swanson, E. A., Lin, C. P., Schuman, J. S., Stinson, W. G., Chang, W., Hee, M. R., Flotte, T., Gregory, K., Puliafito, C. A. & Et Al. (1991). Optical coherence tomography. Science, 254, 1178-81.
Iester, M., Broadway, D. C., Mikelberg, F. S. & Drance, S. M. (1997). A comparison of healthy, ocular hypertensive, and glaucomatous optic disc topographic parameters. J Glaucoma, 6, 363-70.
Jonas, J. B. & Budde, W. M. (2000). Diagnosis and pathogenesis of glaucomatous optic neuropathy: morphological aspects. Prog Retin Eye Res, 19, 1-40.
Jonas, J. B., Budde, W. M. & Panda-Jonas, S. (1999). Ophthalmoscopic evaluation of the optic nerve head. Surv Ophthalmol, 43, 293-320.
Jonas, J. B., Fernández, M. C. & Naumann, G. O. (1991). Correlation of the optic disc size to glaucoma susceptibility. Ophthalmology, 98, 675-80.
Jonas, J. B., Martus, P., Horn, F. K., Jünemann, A., Korth, M. & Budde, W. M. (2004). Predictive factors of the optic nerve head for development or progression of glaucomatous visual field loss. Invest Ophthalmol Vis Sci, 45, 2613-8.
Lee, S. Y., Bae, H. W., Seong, G. J. & Kim, C. Y. (2018). Diagnostic Ability of Swept-Source and Spectral-Domain Optical Coherence Tomography for Glaucoma. Yonsei Med J, 59, 887-896.
Mansour, A. M. (1991). Racial variation of optic disc size. Ophthalmic Res, 23, 67-72.
Mays El-Dairi, R. J. (2020). Chapter 13 – Normal Optic Nerve Head: Anatomy and Development.
Medeiros, F. A., Zangwill, L. M., Bowd, C., Vessani, R. M., Susanna, R., Jr. & Weinreb, R. N. (2005). Evaluation of retinal nerve fiber layer, optic nerve head, and macular thickness measurements for glaucoma detection using optical coherence tomography. Am J Ophthalmol, 139, 44-55.
Michelessi, M., Lucenteforte, E., Oddone, F., Brazzelli, M., Parravano, M., Franchi, S., Ng, S. M. & Virgili, G. (2015). Optic nerve head and fibre layer imaging for diagnosing glaucoma. Cochrane Database Syst Rev, 2015, Cd008803.
Mittal, D., Dubey, S., Gandhi, M., Pegu, J., Bhoot, M. & Gupta, Y. P. (2018). Discriminating ability of Cirrus and RTVue optical coherence tomography in different stages of glaucoma. Indian J Ophthalmol, 66, 675-680.
Ocansey, S., Abu, E. K., Owusu-Ansah, A., Mensah, S., Oduro-Boateng, J., Kojo, R. A., Kyei, S., Boadi-Kusi, S. B., Amoah-Smith, O., Morny, E. K. A., Darko-Takyi, C., Abraham, C. H., Appiah Nyamekye, B. & Ilechie, A. A. (2020). Normative Values of Retinal Nerve Fibre Layer Thickness and Optic Nerve Head Parameters and Their Association with Visual Function in an African Population. J Ophthalmol, 2020, 7150673.
Quigley, H. A., Varma, R., Tielsch, J. M., Katz, J., Sommer, A. & Gilbert, D. L. (1999). The relationship between optic disc area and open-angle glaucoma: the Baltimore Eye Survey. J Glaucoma, 8, 347-52.
Ruben, S. (1994). Estimation of optic disc size using indirect biomicroscopy. Br J Ophthalmol, 78, 363-4.
Schuman, J. S., Wollstein, G., Farra, T., Hertzmark, E., Aydin, A., Fujimoto, J. G. & Paunescu, L. A. (2003). Comparison of optic nerve head measurements obtained by optical coherence tomography and confocal scanning laser ophthalmoscopy. Am J Ophthalmol, 135, 504-12.
Tao, Y. L., Tao, L. M., Jiang, Z. X., Liu, H. T., Liang, K., Li, M. H., Zhu, X. S., Ren, Y. L. & Cui, B. J. (2017). Parameters of ocular fundus on spectral-domain optical coherence tomography for glaucoma diagnosis. Int J Ophthalmol, 10, 982-991.
Varma, R., Tielsch, J. M., Quigley, H. A., Hilton, S. C., Katz, J., Spaeth, G. L. & Sommer, A. (1994). Race-, age-, gender-, and refractive error-related differences in the normal optic disc. Arch Ophthalmol, 112, 1068-76.
Wang, Y., Liu, S., Lou, S., Zhang, W., Cai, H. & Chen, X. (2019). Application of optical coherence tomography in clinical diagnosis. J Xray Sci Technol, 27, 995-1006.
Zangwill, L. M., Weinreb, R. N., Beiser, J. A., Berry, C. C., Cioffi, G. A., Coleman, A. L., Trick, G., Liebmann, J. M., Brandt, J. D., Piltz-Seymour, J. R., Dirkes, K. A., Vega, S., Kass, M. A. &
Zangwill, L. M., Weinreb, R. N., Berry, C. C., Smith, A. R., Dirkes, K. A., Coleman, A. L., Piltz-Seymour, J. R., Liebmann, J. M., Cioffi, G. A., Trick, G., Brandt, J. D., Gordon, M. O. & Kass, M. A. (2004). Racial differences in optic disc topography: baseline results from the confocal scanning laser ophthalmoscopy ancillary study to the ocular hypertension treatment study. Arch Ophthalmol, 122, 22-8.

