1Department of Petroleum Engineering, Firoozabad Branch, Islamic Azad University, Firoozabad, Iran
2Department of Petroleum Engineering, Marvdasht Branch, Islamic Azad University, Marvdasht, Iran
Corresponding author Email: zrezaiek@yahoo.com
Article Publishing History
Received: 27/11/2017
Accepted After Revision: 17/03/2017
Oil recovery from the reserevoirs is devided into three stage of primary, secondary and tertiary stage. Primary recovery is done using the antural energy of the reservoir, while the secondary recovery occures after the primary recovery. It ususlly consists of water and gas injection into the reservoirs for improving the oil recovery. Finally, tertiary ecovery takes in place, which is consists of different methods that are after the secondary recovery. The purpose of this paper is to investigate and compare different gas injection scenarios in an Iranian oil reservoir using Eclipse 300 software. It models recovery factor, cumulative recovery, and the effective parameters of gas injection during different procedures of CO2 gas injection and Water Alternating gas (WAG) injection. Recovery factor, cumulative recovery, remaining oil saturation, and reservoir pressure are studied and compared during different CO2 gas injection and WAG injection scenarios to specify an optimized pattern of injection process for EOR purpose. Laboratory data of reservoir rock and fluid are matched by using PVTi software and the results imported into Eclipse for modeling miscible CO2 injection and WAG injection. The results showed that oil recovery and remaining oil saturation during WAG injection in reservoir are 31.8 and 56.6% and during miscible CO2 injection are 25.8 and 60.4% respectively. In case if WAG injection is highly suggested instead of miscible CO2 injection.
Miscible Co2 Injection, Water Alternating Gas (Wag) Injection, Enhanced Oil Recovery
Kavanrudi Z. R, Karaei M. A, Azdarpour A. Evaluation of Different Effective Parameters During Continual Gas and Water Alternating Gas (WAG) Injections in Oil Reservoirs. Biosc.Biotech.Res.Comm. 2017;10(1).
Kavanrudi Z. R, Karaei M. A, Azdarpour A. Evaluation of Different Effective Parameters During Continual Gas and Water Alternating Gas (WAG) Injections in Oil Reservoirs. Biosc.Biotech.Res.Comm. 2017;10(1). Available from: https://bit.ly/2yHXmGX
Introduction
Gas injection is done as miscible and immiscible methods. Natural gas is enriched with middle hydrocarbons like C2-C6 at miscible injection method. Recovery increase rate is the maximum at this method and nit can cause a recovery of about 65-75% of residual oil, if reservoir rock has homogeneous characteristics and good permeability.At CO2injection lots of this gas is injected into reservoir along with some fraction of light hydrocarbons for miscible sweeping. This method usually is used for the reservoirs that reservoir initial pressure is decreased during initial production or waterflooding. In this method, water is injected into reservoir until pressure reaches to an acceptable amount. Then, CO2 is injected through injection wells. During this injection an miscible area of CO2 and light hydrocarbons is created which is soluble in oil and speeds its movement toward production wells (Kulkarni and Rao, 2005; Qin et al., 2015; Hao et al., 2016; Feng et al., 2016).
Another injection method is Water Alternating Gas (WAG) injection which is done in large scales in oil fields for controlling oil mobility.WAG injection was first attempted at 1957 in Alberta and the results were reported as successful.After this and because of its numerous privileges comparing to water or gas injection separately it has been applied around the worldwide like USA, Canada, North sea, Russia, Turkey, and Venezuela. The mentioned privileges include high capability for controlling mobility ratio of displaced and displacing phases, preventing immature fingering in production wells, capability of recovery of un-swept oil during water or gas injection, creating a controllable and stable front, and capability to use operational tools of water and gas injection for different oil fields. During these years researchers investigated different aspects of WAG injection for better understanding of the facts and the changes of reservoir properties during injection period (Quijada, 2005; Ahmadi et al., 2015; Teklu et al., 2016; Chen and Reynolds, 2017).
Cobanoglu (2001) investigated immiscible gas and WAG injection in BatyKozulca in Turkey with designing and comparing different scenarios of injection rates, cycles, and number of producing and injecting wells using Eclipse 100. The results of their showed that immiscible WAG injection led to more oil recovery comparing to immiscible gas injection. Kulkarni and Rao (2004) investigated WAG injection and compared its results to injection of gas and water separately in high permeability layers of North Sea field. They claimed that fingering of gas and water at high permeability layers and immobility at low permeability layers causes a low recovery during these methods. Their studies showed that WAG injection prevents the movement of gas in high permeability layers and creating a 3 phase area and stability of mobility front. Therefore, this method shows a higher recovery comparing to injection of water or gas.
Jaturakhanawanit and Wannakomol (2012) studied gas and WAG injection in Phitanulok field at north of Thailand. They claimed that with an optimum injection rate of 700 bbl/day of water and 700 Mf3/day of gas, with a 12 month cycle of water and 1 month gas, the achieved recovery would be 65% and 28% for WAG and gas injection respectively. Christensen et al. (2001) investigated a 30 years period of seelington field at Texas. They introduced an immiscible simultaneous injection of water and gas as an optimum method for the mentioned reservoir. Maracaibo (2002) field was studied by Manrique. The results showed that WAG injection will increase oil recovery about 17% at that field.
Shi et al. (2008) investigated kuparuk field at North of Alaska by using data from a 20 years period of WAG injection. They claimed that although gas injection is used as EOR method in this field, but because of immature fingering and GOR increase, WAG injection was suggested and replaced with that method to prevent those problems. That also increased oil recovery. Instefjord and Todnem (2002) studied a 10 years period of WAG injection in Gullfaks field. Their studies showed that during injection in this field, oil production was almost 2 MMSTB more than natural production. They claimed that WAG injection in this filed led to increase of recovery, sweep efficiency, and water cut. Other than these mentioned reports, there are so many successful reports published about WAG injection and its privileges comparing to EOR other methods (Rogers and Griggs, 2000; Rehman, 2008; Salehi et al., 2014; Batruny and Babadagli, 2015; Yu and Sheng, 2017).
Materials and Methods
Reservoir Introduction And Modeling
This field has been discovered at 1978 and developed by drilling 9 wells until 1990. Initial oil in place for this field was estimated to be about 440 MMbbl. Initial waster saturation (Sw) of the reservoir, initial reservoir pressure (Pi), reservoir temeprature, bubble point pressure (Pb), water oil contact (WOC), and gas oil contact (GOC) of the reservoir were, 15%, 4335 psi, 302 F, 2673 psi, 6849 psi, and 2000 psi, respectively. For the simulation, the studied field should be converted to a model for importing to Eclipse 300 simulator. A cubical model was created for this purpose. After analyzing the effect of grid numbers on simulation result, 21, 24, and 4 grid numbers were chosen at direction x, y, and z, respectively.
The relative file for field grids is GRID.GRDECL that was created by FloGrid software. The PERMX.GRDECL was the file for permeability information at x direction, and as the same, PERMY.GRDECL was for permeability at y direction.
Hypothesis Of The Model
For prediction of reservoir operation for simulator it is necessary to define some limitations and conditions. These limitations for economical production andof probable limitations of wellhead facilities and preventing their damages are considered during simulation and applied for all scenarios. The minimum economic production from each well was assumed to be 100000 bbl, the maximum GOR of each well was 3000 SCF/STB, the maximum water cut was 50%, and the abondanment pressure was 1500 psi.
The production was from 9 producing wells at the start. EOR process and field development will not take place until 10 years and during this time the only production mechanism is natural production. For continuing field development 1 well will be drilled each 2 years until 20 years; one well as producing well and one as injection well.
The second 10 years period is divides to 4 scenarios that 3 of them are investigated in this paper. The second step will be studied in future works. These for scenarios include:
- Continuing natural production
- Continuing production with drilling new wells
- Continuing production with drilling new wells and CO2gas injection
- Continuing production with drilling new wells and WAG injection
Results and Discussions
Table 1 shows petrophysical characteristics and the information obtained from PVT test in simulator. The layer has a low thickness of 100 ft that shows the reservoir has several layer. The permeability in x and y direction is 10 times of the permeability of z direction (Kx=Ky=10Kz).
|
Table 1: Information of the studied reservoir |
||
|
Parameter |
Unit |
Amount |
|
Reservoir Depth |
ft |
6167.1 |
|
Reservoir Length |
ft |
13500 |
|
Reservoir Width |
ft |
15000 |
|
Reservoir Thickness |
ft |
100 |
|
Permeability of x and y direction |
mD |
179.23 |
|
Permeability of z direction |
mD |
17.943 |
|
Porosity |
Percent |
25.56 |
|
Lightness |
API |
46 |
|
GOR |
SCDF/STB |
2400 |
|
Bo |
Rb/STB |
2.9 |
Production as natural depletion mechanism, without drilling new wells and EOR operation was investigated. As mention earlier economical production from each well is 100000 bbl per day. According to data all the wells produce more than this amount. Bottomhole pressure is set to 1500 psi for ensuring that oil reaches to wellhead facilities and average production rate of each well is set as controlling rate. The results for 50 years of production with this mechanism (no new well and EOR operation) are summarized in Table 2. The primary dirve mechanism of the reservoir is by natural pressure of the reservoir. The reservoir pressure transmits the fluid from the reservoir to the wellbore and from wellbore to the surface. In cases where reservoir pressure is high enough through the prodcution life of the reservoir, natural flow of the reservoir continues without any restrictions. Otherwise, infill drilling and EOR methods should be applied to maintain the natural pressure of the reservoir and thus, increasing the amount of recoverable oil from the reservoir (da Silva et al., 2013; Hu et al., 2014; Longxin et al., 2015).
|
Table 2: Summary of 50 years of production from reservoir by natural depletion |
||
|
Parameter |
Unit |
Amount |
|
IOIP |
MMbbl |
438.16 |
|
Oil Recovered |
MMbbl |
47.61 |
|
Oil Recovery Factor |
Percent |
10.86 |
|
Remaining Oil saturation |
Percent |
76.31 |
|
Reservoir Pressure |
psi |
2513.7 |
Production as natural depletion mechanism, with drilling new wells and EOR operation was investigated. During this simulation process it is assumed that after 10 years of production, each 2 years 1 new producing well is drilled. Parameters such as layer thickness, layer permeability, and reservoir oil saturation are affecting parameters for determining where the well should be drilled.Positions of the wells show that no well is drilled at the left-down side of the reservoir. All wells that are drilled in this area are shut because they didn’t reach to economical production limit.The results of running the simulation for 50 years are summarized in Table 3. These results show that drilling new producing wells won’t affect the production too much. The position of wells and incapability of reservoir for production under natural depletion mechanism can be the reason for it. Infill drilling is one of the improved oil recovery techniques in petroleum industry. Some fraction of the oil in place is bypassed through the movement from reservoir to the wellbore and can not be recovered to the surface. In fill drilling in areas where sifnificant amount of oil is trapped can be successful method of recovering these amounts of oil from the reservoir (Aslanyan et al., 2014; Awaad et al., 2015; Urban et al., 2016; Parihar et al., 2016).
|
Table 3: Summary of 50 years of production from reservoir with drilling new wells |
||
|
Parameter |
Unit |
Amount |
|
IOIP |
MMbbl |
438.16 |
|
Oil Recovered |
MMbbl |
47.61 |
|
Oil Recovery Factor |
Percent |
10.86 |
|
Remaining Oil saturation |
Percent |
72.94 |
|
Reservoir Pressure |
psi |
2434.8 |
Recovery with CO2 gas injection was investigated. Gas injection is a common method of EOR operations. Displacement factor highly depends on minimum miscible pressure; a pressure that less than this pressure, the injected fluid is not miscible with oil. In this paper, miscibility or immiscibility of operation is determined using PVTi software and reservoir data. Minimum miscibility pressure is determined via slim tube method of Eclipse software and this pressure is compared with maximum injection pressure that is determined by formation break pressure and it is 2420 psi for this case. Also, according to empirical equations from well loggings of layers show that formation break pressure gradient is about 0.75 psi/ft for this formation. So, it would be about 4625 psi. Therefore, injection operation should be done in pressures lower than this amount.
Another effecting parameter is gas injection rate and in Figure 1 it is shown that with increasing injection rate from 1000 to 4000 MMcuft/day the recovery will increase from 26 to 33%. Figures 2 and 3 show the changes of GOR and reservoir pressure according to injection rate changes respectively. It can be seen that during high injection rates, GOR crosses the maximum operational limit. Also pressure increase trend during high injection rates shows that continuing injection will increase the reservoir pressure even more that reservoir initial pressure. According to these explanations the injection rate of 1000 cuft/day is considered as an optimum operational rate. Table 4 shows the summarized results of CO2 gas injection scenario in reservoir.
|
Table 4: Summary of results of CO2 gas injection scenario |
||
|
Parameter |
Unit |
Amount |
|
IOIP |
MMbbl |
438.16 |
|
Oil Recovered |
MMbbl |
109.37 |
|
Oil Recovery Factor |
Percent |
25.84 |
|
Remaining Oil Saturation |
Percent |
60.38 |
|
Reservoir Pressure |
psi |
2551.5 |
|
Table 5: Results of WAG injection scenario |
||
|
Parameter |
Unit |
Amount |
|
IOIP |
MM bbl |
438.16 |
|
Recovered Oil |
MM bbl |
136.72 |
|
Oil Recovery factor |
Percent |
31.8 |
|
Remaining oil Saturation |
percent |
56.61 |
|
Reservoir Pressure |
Psi |
2578.1 |
 |
Figure 1: Effect of different CO2 injection rates on oil recovery |
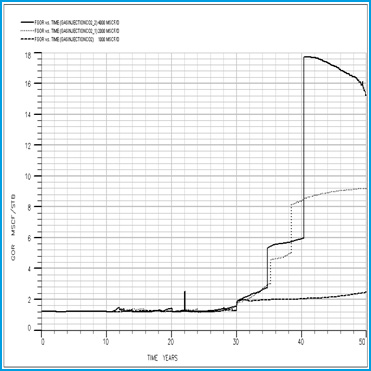 |
Figure 2: Effect of different CO2 injection rates on GOR |
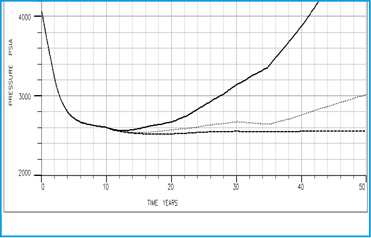 |
Figure 3: Effect of different CO2 injection rates on reservoir pressure |
One of the major problems associated in water flooding is that capillary forces will trap the oil during water flooding. Injection of miscible fluids was proposed to overcome the capillary forces because in the case of miscible flooding there is no interfacial tension and capillary force doesn’t exist to trap the oil. Carbon dioxide was proposed as a miscible fluid; however it is not miscible with oil at the first contact. CO2 flooding can improve oil recovery by generating miscibility, swelling crude oil, lowering oil viscosity and lowering interfacial tension between oil and CO2. However this method has some advantages, the most disadvantages of this method refer to the low viscosity of this gas. Not all the oil is contacted with the gas due to the low viscosity of the CO2 and the efficiency in oil recovery is not as high as expected. High mobility of the CO2 compare with reservoir fluids can cause poor sweep efficiency; therefore gravity override would be the result in which due to low density of the injected gas, they move through the top of the reservoir and try to find highly permeable layers to move in. Early breakthrough of the injected gas due to unfavourable mobility ratio is the major problem in any CO2 gas flooding. Thus, controling the mobility of the injected gas by water alternating gas could be a more successful remedy form recovering additional oil (Wang et al., 2015; Zhou et al., 2015; Zhang et al., 2015; Hao et al., 2016; Li et al., 2016).
Production during WAG injection Scenario was investigated in details. The effect of each parameter isn’t known very well in WAG injection operation. In this section several parameters such as water/gas ratio, injection rate, and types of injection are investigated.
Water/Gas ratio means the ratio of total injected volume of water and gas and its optimum amount depends on rock wettability. However, 1:1 ratio is the most common ratio that is used. High amounts of this parameter have a great effect on recovery from water wet reservoirs. Its optimum amount during WAG injection depends to injected gas slug volume. With injection of slugs with a volume of 60% of pore space (0.6 PV) the recovery would be great. However, injection slug with a volume of 0.2PV will be more economical. For oil wetting rocks the suggested ratio is 0:1 (continual gas injection) and for water wet rocks is 1:1 WAG injection.
For investigating the effect of water/gas ratio injection rate of 4000 MSCF/day is selected and the diagram of oil recovery changes for water/gas ratios of 0.5, 1, and 1.5 (water injection rates are 2000, 4000, and 6000 bbl/day respectively) are calculated. Figure 4 shows the effect of water/gas ratio on oil recovery.This can be seen that by increasing this ratio from 0.5 to 1.5 the production increases from 28 to 37%. Figure 5 and 6 show remaining oil saturation and water cut for different water/gas ratios respectively.It can be seen for ratio of 1.5 the wells produce too much water that can damage wellhead facilities. Therefore, 1:1 ratio is selected as optimum amount.
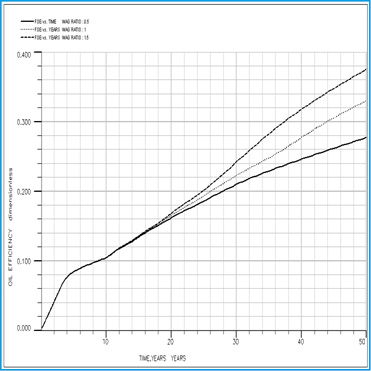 |
Figure 4: Effect of water/gas ratio on oil recovery |
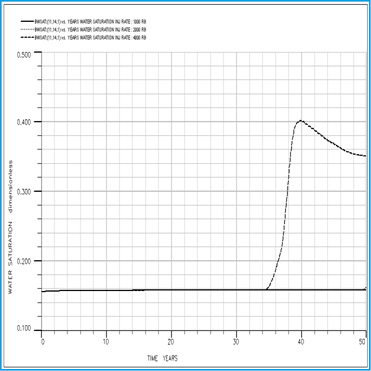 |
Figure 5: Effect of water/gas ratio oil saturation |
Effect of Types of Injection on overall recovery was investigated. According to reservoir rock properties, two type’s injection can be applied. For the first method, gas injected into reservoir earlier than water and for the second method it is water earlier than gas. When water injected firstly (second method) oil would be trapped in pores if the reservoir is water wet and it will decrease recovered oil. Figure 7 shows oil recovery in case that gas is injected earlier that water (first method). The reason for this can be because of water wetting behavior of reservoir rock.
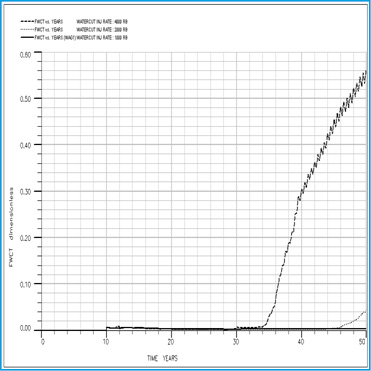 |
Figure 6: Effect of water/gas ratio on water cut |
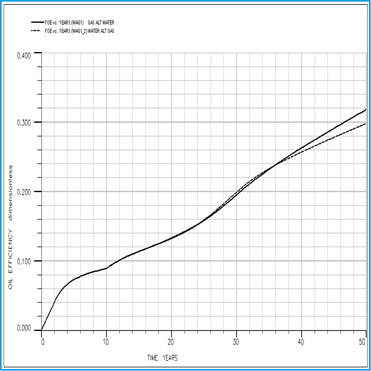 |
Figure 7: Effect of injection type on oil recovery |
Low viscosity of the injected gas can cause breakthrough and consequently poor sweep efficiency. In order to reduce the mobility of the injected gas, WAG can be proposed as a way to improve sweep efficiency of the gas by controlling the mobility of the injected gas and stabilizing the front. Reducing mobility of the injected gas causes that the larger portion of oil contacts with gas and then the amount of oil that will be recovered is much more in compare to the conventional gas injection. Although mobility control is the major advantage of using WAG, compositional exchange is the other mechanism that affects fluid densities and viscosities and results on improving oil recovery. WAG injection can be done either in miscible or immiscible depending on the reservoir characteristics and fluid properties and for the majority of all WAG injection projects results show in a significant incremental oil recovery, generally about 5 to 10 percent (Laochamroonvorapongse et al., 2014; Ahmadi et al., 2015; Majidaie et al., 2015; Memon et al., 2016; Bataee et al., 2016).
Conclusions
In this study, oil recovery scenarios in one of the Iranian oil fields was studied. The simualtion results showed that natural depletion of the reservoir provides only 12% recovery factor, which is very low. In addition, infill drilling also did not improve oil recovery signicantly. On the other hand, oil recovery was improved signincatly with CO2 flooding and water alternating gas flooding. However, water alternating gas flooding showed better results compared to CO2 flooding.
Acknowledgment
The authors would like to appreciate the Department of Petroleum Engineering, Firoozabad Branch, Islamic Azad University, Firoozabad, Iran for the provision of the laboratory facilities necessary for completing this work.
References
- Ahmadi, Y., Eshraghi, S.E., Bahrami, P., Hasanbeygi, M., Kazemzadeh, Y., Vahedian, A. (2015). Comprehensive Water–Alternating-Gas (WAG) injection study to evaluate the most effective method based on heavy oil recovery and asphaltene precipitation tests. Journal of Petroleum Science and Engineering, 133: 123-129.
- Aslanyan, A., Aslanyan, A., Karantharath, R., Matveev, S., Skutin, V., Garnyshev, M., Bevillon, D., Mehrotra, N., Suarez, N. (2014). Planning infill drilling and workover programmes based on reservoir-oriented production logging surveys. International Petroleum Technology Conference, 10-12 December, Kuala Lumpur, Malaysia.
- Awaad, A.H., Al-Maraghi, A.M., Elgawad, A.A., El-Banbi, A.E. (2015). Role of Infill Drilling in Increasing Reserves of the Western Desert of Egypt – Case Studies. SPE Kuwait Oil and Gas Show and Conference, 11-14 October, Mishref, Kuwait.
- Bataee, M., Irawan, S., Ridha, S. (2016). Wellbore stability model based on iterative coupling method in water alternating gas injection. Journal of Petroleum Exploration and Production Technology, 6(4): 755–775.
- Chen, B., Reynolds, A.C. (2017). Optimal control of ICV’s and well operating conditions for the water-alternating-gas injection process. Journal of Petroleum Science and Engineering, 149: 623-640.
- Christensen, J.R., Stenby, E.H., Skauge, A. (2001). Review of WAG Field Experience. SPE International Petroleum Conference and Exhibition of Mexico, Villahermosa, Mexico.
- Cobanoglu, M. (2001). A Numerical study to evaluate the use of WAG as an EOR method for oil production improvement at B. Kozluca field, Turkey. Asia Pacific Improved Oil Recovery Conference, Kuala Lumpur, Malaysia.
- da Silva, N.A.E., da Rocha Oliveira, V.R., Costa, G.M.N. (2013). Modeling and simulation of asphaltene precipitation by normal pressure depletion. Journal of Petroleum Science and Engineering, 109: 123-132.
- Feng, H., Haidong, H., Yanqing, W., Jianfeng, R., Liang, Z., Bo, R., Butt, H., Shaoran, R., Guoli, C. (2016). Assessment of miscibility effect for CO2 flooding EOR in a low permeability reservoir. Journal of Petroleum Science and Engineering, 145: 328-335.
- Hao, H., Hou, J., Zhao, F., Song, Z., Hou, L., Wang, Z. (2016). Gas channeling control during CO2 immiscible flooding in 3D radial flow model with complex fractures and heterogeneity. Journal of Petroleum Science and Engineering, 146: 890-901.
- Hu, Y., Li, X., Lu, X., Lu, X., Xu, X., Jiao, C., Guo, C. (2014). Varying law of water saturation in the depletion-drive development of sandstone gas reservoirs. Petroleum Exploration and Development, 41 (6): 790-793.
- Instefjord, R., Todnem, C.A. (2002). 10 Years of WAG injection in Lower Brent at the Gullfaks field. The 13th European Petroleum Conference, Aberdeen, Scotland, U.K.
- Jaturakhanawanit, S., and Wannakomol, A. (2012). Water alternating gas injection for enhanced oil recovery in the Phitsanulok basin. Society of Petroleum Engineers Annual Technical Conference and Exhibition, Oslo Norway.
- Kulkarni, M., Rao (2004). Experimental investigation of various methods of tertiary gas injection. Society of Petroleum Engineers Annual Technical Conference and Exhibition, Houston USA, pp.
- Kulkarni, M., Rao, D.N. (2005). Experimental Investigation of Miscible and Immiscible Water-Alternative-Gas (WAG) process performance. Journal of petroleum Science & Engineering, 48(1-2): 1-20.
- Laochamroonvorapongse, R., Kabir, C.S.; Lake, L.W. (2014). Performance assessment of miscible and immiscible water-alternating gas floods with simple tools. Journal of Petroleum Science and Engineering, 122: 18-30.
- Li, F., Luo, Y., Luo, X., Wang, L., Nagre, R.D. (2016). Experimental study on a new plugging agent during CO2 flooding for heterogeneous oil reservoirs: A case study of Block G89-1 of Shengli oilfield. Journal of Petroleum Science and Engineering, 146: 103-110.
- Longxin, M., Ruifeng, W., Xianghong, W. (2015). Development features and affecting factors of natural depletion of sandstone reservoirs in Sudan. Petroleum Exploration and Development, 42 (3): 379-383.
- Majidaie, S., Onur, M., Tan, I.M. (2015). An experimental and numerical study of chemically enhanced water alternating gas injection. Petroleum Science, 12 (3): 470-482.
- Manrique, E. (2000). VLE WAG Injection Laboratory Field in Maracaibo Lake. SPE European Petroleum Conference of Paris, France.
- Memon, M.K., Elraies, K.A., Al-Mossawy, M.I. (2016). Impact of new foam surfactant blend with water alternating gas injection on residual oil recovery. Journal of Petroleum Exploration and Production Technology, 16(3): 1-9.
- Parihar, P., Warner, R., Micikas, J., Armpriester, L., Anderson, J., Zuluaga, E. (2016). Infill Drilling Opportunity in Fruitland Coal, San Juan Basin, Colorado. SPE Low Perm Symposium, 5-6 May, Denver, Colorado, USA.
- Qin, J., Han, H., Liu, X. (2015). Application and enlightenment of carbon dioxide flooding in the United States of America. Petroleum Exploration and Development, 42 (2): 232-240.
- Quijada M.G. (2005). Optimization of a CO2 flood design wasson field – west texas, Master Of Science Thesis, Texas A&M University.
- Rehman, T. (2008). A Techno economical evaluation of miscible flooding, Dalhousie University.
- Rogers, J.D. Grigg, R.B. (2000). A literature analysis of the WAG injectivity abnormalities in the CO2 process. SPE/DOE Improved Oil Recovery symposium, Tulsa, USA.
- Salehi, M.M., Safarzadeh, M.A., Sahraei, E., Tabatabaei Nejad, S.E. (2014). Comparison of oil removal in surfactant alternating gas with water alternating gas, water flooding and gas flooding in secondary oil recovery process. Journal of Petroleum Science and Engineering, 120: 86-93.
- Shi, W., and Corwith, J. (2008). Kuparuk MWAG project after 20 years. SPE/DOE Improved Oil Recovery Symposium, Oklahoma, USA.
- Teklu, T.W., Alameri, W., Graves, R.M., Kazemi, H., AlSumaiti, A.M. (2016). Low-salinity water-alternating-CO2 EOR. Journal of Petroleum Science and Engineering, 142: 101-118.
- Urban, E., Orozco, D., Fragaso, A., Selvan, K., Aguilera, R. (2016). Refracturing Vs. Infill Drilling – A Cost Effective Approach to Enhancing Recovery in Shale Reservoirs. Unconventional Resources Technology Conference, 1-3 August, San Antonio, Texas, USA.
- Wang, G., Zheng, X., Zhang, Y., Lu, W., Wang, F., Yin, L. (2015). A new screening method of low permeability reservoirs suitable for CO2 flooding. Petroleum Exploration and Development, 42 (3): 390-396.
- Yu, Y., Sheng, J.J. (2017). A comparative experimental study of IOR potential in fractured shale reservoirs by cyclic water and nitrogen gas injection. Journal of Petroleum Science and Engineering, 149: 844-850.
- Zhang, Y., Wang, Y., Xue, F., Wang, Y., Ren, B., Zhang, L., Ren, S. (2015). CO2 foam flooding for improved oil recovery: Reservoir simulation models and influencing factors. Journal of Petroleum Science and Engineering, 133: 838-850.
- Zhou, T., Liu, X., Yang, Z., Li, Z., Wang, S. (2015). Experimental analysis on reservoir blockage mechanism for CO2 flooding. Petroleum Exploration and Development, 42(4):548-553.

