1Zist Fanavari Novin Biotechnology Institute, Hezarjarib, Isfahan, Iran.
2Department of Biophysics, Faculty of Biological Sciences, Tarbiat Modares University, Tehran, Iran.
Corresponding author email: mazadeh@phd.iaurasht.ac.ir
Article Publishing History
Received: 15/10/2023
Accepted After Revision: 25/03/2024
It is predicted that dysregulation of BHMT2 expression level could have a remarkable effect on Breast cancer status. The absence of methionine and Hyperhomocysteinemia have been linked to a decline in BHMT2 expression. This mRNA expression and its correlated long non- coding RNA (lncRNA) (LINC00922) have been investigated in our experiment based on the bioinformatics approach. Also, the genotype frequency analysis of BHMT2 in SNP rs10499 has been demonstrated. The mentioned SNP is correlated with the differences in the binding affinity of miR542-3p. We performed a microarray analysis to find the differentially expressed genes (DEGs). GeneMANIA and miRWalk online databases were used for mRNA-mRNA and mRNA-miRNA interaction analyses.
Clusterprofiler package was used for functional and pathway enrichment analyses. dbSNP database was applied for finding the relevant Single nucleotide polymorphism (SNP). The Co-lncRNA database was used for finding the correlated lncRNA.A real-time PCR experiment was performed to count the relative expression level of BHMT2 and LINC00922. The high resolution melt (HRM) method was performed to identify the SNP genotype frequency.BHMT2 had a significant down-regulation, and LINC00922 had a significant up-regulation in Breast cancer tissues compared to normal. No significant difference in genotype frequency of rs10944 was observed. The current study revealed that BHMT2 and LINC00922 can be the two novel correlated biomarker of breast cancer. More similar investigations are needed for evaluating more accurate and reliable result, specially about rs10499.
Breast Cancer, Rna Interaction, Single Nucleotide Polymorphism
Zavareh S.A.D, Akhlaghi Z, Esfahani S.S, Mohammadi N, Hadisadegh N, Rahimirad S, Azadeh M . Evaluation of BHMT2 Gene Expression and its Expression Factor Regulating LNC00922 LNCRNA with Rs10944 Genotype Determination in Patients with Breast Cancer. Biosc.Biotech.Res.Comm. 2024;17(1).
Zavareh S.A.D, Akhlaghi Z, Esfahani S.S, Mohammadi N, Hadisadegh N, Rahimirad S, Azadeh M . Evaluation of BHMT2 Gene Expression and its Expression Factor Regulating LNC00922 LNCRNA with Rs10944 Genotype Determination in Patients with Breast Cancer. Biosc.Biotech.Res.Comm. 2023;17(1). Available from: <a href=”https://shorturl.at/fAU17“>https://shorturl.at/fAU17</a>
INTRODUCTION
Breast cancer (BC) is the second cause of death in developed countries. The prevalence of BC in developing countries throughout the Asia-Pacific region is prognosis to increase in the next few years continuously. Breast cancer differed based on biomolecular features into luminal A and luminal B (expressing the estrogen receptor (ER)), basal-like and human epidermal growth factor receptor 2 (HER2)- enriched (without ER expression). Mainly the ESR1 gene caused the expression of estrogen receptor-α (ER).
Triple-negative breast cancer (TNBC) is a heterogeneous disease, and its biomarkers can be used for diagnostic approaches (Sporikova et al., 2018). Though lots of effort has been paid for knowing the BC mechanism, still there is a lack in detecting new visions of biomarkers in transcriptional mechanism and gene regulation for drug discovery and early diagnosis. Overall, several reports about tumorigenesis activities of biomarkers like noncoding RNAs, especially deregulation in mammary cells (D, 2011; Gupta et al., 2019).
Long noncoding RNA (lncRNA) is a single-stranded class of noncoding RNA with more than 200 nucleotides. This molecule is known as one of the critical characteristic biomarkers in BC prognosis (Liu et al., 2016). Reports have indicated that lncRNA has a potential function in intercellular processes (Klinge, 2018). There is not much information about all lncRNAs; nonetheless, Scientists clustered these biomolecules into three types that encoded from different regions in the genome (Yousefi et al., 2020).
Besides, LncRNAs can influence the function of microRNA. As an illustration, LINC00460 overexpressed levels have been identified in BC tissue. This lncRNA has interacted with miRNA-489-5p (Zhu et al., 2019). Another example of lncRNA, LINC00324, and LINC00472, have been detected in breast cancer tissue (Soudyab, Iranpour, and Ghafouri-Fard, 2016). Our present study has demonstrated a unique and novel lncRNA, Long Intergenic Non-Protein Coding RNA 922 (LINC00922) placed in16q21 chromosome.
The endogenous subtype of noncoding RNA is microRNA with 18-22 nucleotides length, has different roles; involved translation, post-transcription regulation in genetic and epigenetic areas. It has a crucial role in cancer pathways (Hata and Lieberman, 2015) and controlling protein levels via binding from seed sequence (5′ ends) to the untranslated region of target mRNA. Besides, the complementarity of miRNA-mRNA interaction can be affected by single nucleotide polymorphism (SNP). Researchers reported that an SNP, rs1071738 influenced miR-96 and miR-182 by inhibiting the translation product of the PALLD gene, which reduced breast cancer cell migration (Gilam et al., 2016; Moszyńska et al., 2017). our study focused on mir-542-3p placed on the Xq26.3 chromosome area.
Scientists observed that BHMT2 (Betaine-Homocysteine2) encodes a zinc metalloenzyme, which has a Methyl-donor role in methionine biosynthesis via homocysteine (Giusti et al., 2008; Mostowska et al., 2010; Ganu et al., 2015). Based on proven studies, Hyperhomocysteinemia (disorder due to increased homocysteine level) happened by preventing remethylation of homocysteine to methionine, which caused methionine dependency disturbance in the methionine pathway (Mohammad et al., 2013). Apart from that, reducing the expression of BHMT2 has been considered a result of an absence of methionine and Hyperhomocysteinemia. This phenomenon correlates to cancer development and metastasis (Pirouzpanah et al., 2014).
The main purpose of this study was to evaluate the differential expression of the BHMT2 gene and its expression regulators in breast cancer tissue compared to the standard control. Our results belong to other potential genetic factors could develop more precise diagnostic routes or new therapeutic method for breast cancer.
MATERIAL AND METHODS
Data collection: Gene Expression Omnibus (GEO) datasets analysis was conducted to collect differential expressed (DE) genes in BC tissue samples (https://www.ncbi.nlm.nih.gov/geo/).GSE29431, GSE10810, and GSE42568 datasets were retrieved and downloaded in order to achieve the profile of differential expressed genes in breast cancer tumor tissue compared to adjacent healthy cells. The limma R package was used to obtain altered gene expression profiles between patients and healthy individuals.
P-value was calculated for each gene. The False Discovery Rate (FDR) method was applied to measure the Adj.p.Value (P<0.01 was considered a significant threshold). Genes were filtered based on -2≤ FC ≥2 (Foldchange) and Adj.p.Value <0.01, then top 200 DE genes were collected from each dataset. Using a Venn diagram, common genes were isolated from the collected sets and based on a common gene’s possible role among three datasets in breast cancer development. Finally, among common genes, a gene that has not been evaluated by qRT-PCR before was selected as a novel gene to analyze its expression level in breast tumors. The GSE40525 study was also analyzed to evaluate the differences in miRNA expression in breast tumor tissue using the limma package in the R environment.
Network interaction construction: The genes obtained from microarray studies were mapped using the GeneMANIA database and visualized using Cytoscape software (version 3.7.2). the grid was drawn only to show proteins that coexpression with each other (Franz et al., 2018). miRWalk online software was used for miRNA-mRNA interaction analysis. Then the miRNA-mRNA regulatory network was visualized by Cytoscape.
Functional/pathway Enrichment analysis: Enrichment analysis of genes was performed by the Clusterprofiler package in R. the statistical method of Adj.p.Value was used to confirm the function of genes in the molecular pathways and cellular processes (p<0.05 was considered as significant) (Yu et al., 2012).
Noncoding regulatory elements of BHMT2 : Using the dbSNP webtool and examining the existing SNPs located in the 3’UTR region of the BHMT2 gene, the SNPs with the MFE>0.1 were isolated. Seed region sequences of miRNAs were then downloaded from the TargetScanHuman database, and the SNP region was searched among seed sequences for human miRNAs. The RNAhybrid database was used to calculate the free binding energy (MFE) to evaluate the effect of SNP on the hybridization of miRNA to the mutant sequence (Krüger and Rehmsmeier, 2006).
Using the co_LncRNA database, the correlation between genes and lncRNAs was examined. This tool is developed based on The Cancer Genome Atlas Program (TCGA) data of various cancer types. Spearman’s correlation test was used to estimate coexpression relationships between lncRNAs and the BHMT2 gene in BC samples. Moreover, the p-value of the correlation coefficient was estimated, and a p-value less than 0.01 was considered significant. Finally, a coefficient threshold of 2 was applied. the articles were reviewed to select the most effective lncRNA in the pathogenesis of breast cancer (Zhao et al., 2015).
Sample Collection : Cancerous and surrounding normal breast tissue samples from 24 female patients were used in a case-control study. Also, the samples were kept in liquid nitrogen after being deposited in RNAlater solution (Thermofisher Scientific). The Ethics Committee of Al-Zahra Hospital, Isfahan University of Medical Sciences, certified all of the samples, and all patients signed written consent documents.
Real-Time PCR :Total DNA was extracted from each sample using the YTA kit according to the manufacture’s protocols. Total RNA was extracted from each sample using TRizol (YTZ) following the manufacturer’s instructions. Total RNA quality and quantity verified by NanoDrop 1000 spectrophotometer (Thermo Fischer). The cDNA synthesis was done using the RevertAid First Strand cDNA synthesis (ThermoScientific) kit. First, 0.1 ng of extracted RNA was mixed with 1µL Random Hexamer primer; then, the mixture reaches 12 µL volume by adding ddH2O and incubate at 65˚c for 5 min. In the next step, master mix that includes 4µL 5x Reaction Buffer with 1µL Ribolock RNase Inhibitor (20 U/µL), 2µL 10mM dNTP Mix and 1µL RevertAid M-MuLV RT (200 U/µL) was incubated for 5 min at 25˚c following by 60 min at 42˚c.
Using OligoCalc (http://www.basic.northwestern.edu/biotools/OligoCalc.html ) and Gene Runner software, gene-specific primers were designed. The mRNA level of target genes was quantified by real-time PCR analysis on Magnetic Induction Cycler (Mic) PCR Machine using the Quantifast SYBR Green qPCR Master Mix (YTA). PCR reactions contained one μl of gene-specific primers (10pmol), five μl Quantifast SYBR Green PCR master mix, one μl of template cDNA, two μl water in a ten μl reaction volume. The reaction mixtures were subjected to initial denaturation of 95 °C for 10 min followed by 40 cycles of 95°C for 15 sec and 60°C for 15 sec and 72°C for 20 sec. The final melt curve analysis was performed by increasing the temperature from 60 °C to 95 °C with an increase of 0.1 °C per sec followed by the last hold at four °C.
The specificity of the amplification was validated by electrophoresis of the PCR product on an agarose gel and examination of the melt curve. All reactions were carried out in duplicate, and the cycle threshold (Ct) values for the target genes were normalized using GAPDH as a reference gene. Table2 lists the primer sequences used according to cDNA synthesis. The fold change in the expression of the target genes was determined using the formula:2−ΔΔCt, where ΔCt= average Ct of target gene−average Ct of GAPDH, and ΔΔCt=ΔCt of the objective sample (cancer tissue) −ΔCt of evaluator sample (normal tissue). The SNP reference sequence was downloaded from the National Center for Biotechnology Information’s (NCBI) dbSNP (http://www.ncbi.nlm.nih.gov/projects/SNP). Primer3 (http://frodo.wi.mit.edu/ ) was used to design the primers, which were then tested for specificity using BLAST (http://blast.ncbi.nlm.nih.gov). The primer sequences are described in Table 1.
Table 1. Forward and reverse primer sequences (5′→3′) of BHMT2, LINC00922, GAPDH and SNP rs10944.
| Figure | legends | |
| Forward | Reverse | |
| BHMT2 | CAGGTAAAGGAGGTGGGTG GCATTTACATCTTCCCACTTGC | |
| LINC00922 | CAGCCTGGGAGACATAATTC CAAAGACTGCGACATAGTGAG | |
| GAPDH | GCTCTCTGCTCCTCCTGTTC ACGACCAAATCCGTTGACTC | |
| rs10944 | CAGCCTGGGAGACATAATTC CAAAGACTGCGACATAGTGAG | |
7- High-Resolution Melt: High-Resolution Melt (HRM) method (by Mic PCR Machine) was used for genotyping the target SNP.HRM entails PCR cycling followed by a gradual rise in temperature to melt DNA. Fluorescence intensity shows that the individual nucleotide changes had different melting-curve forms. The total reaction volume was 10μl (Eva green 2μl, Forward primer 1μl, Reverse primer 1μl, water 4μl, DNA 2μl).
The initial denaturation was at 95°C for 10 min followed by 40 cycles including 95° C for 15 sec and 60 °C for 15 sec and 72° C for 20 sec. The final melt curve analysis was performed by increasing the temperature from 60° C to 95°C with the increase of 0/1° C per 1 sec followed by the last hold at four °C. Furthermore, 5 out of 24 samples were chosen randomly for Sanger sequencing to validate the result of HRM compared with sequencing.
8. Statistical analysis: GraphPad prism (8) was used for real-time PCR data analysis, including expression, correlation, and ROC analyses. SPSS software was used for genotype frequency analysis. The paired t-test and chi-square test were performed to evaluate the RNAs expression level and frequency of rs10944 genotypes in tumor samples compared to standard samples. P-Value less than 0.05 was considered as the significance level. Pearson correlation test was performed on the RNAs expression level to obtain the correlation of gene and lncRNAs
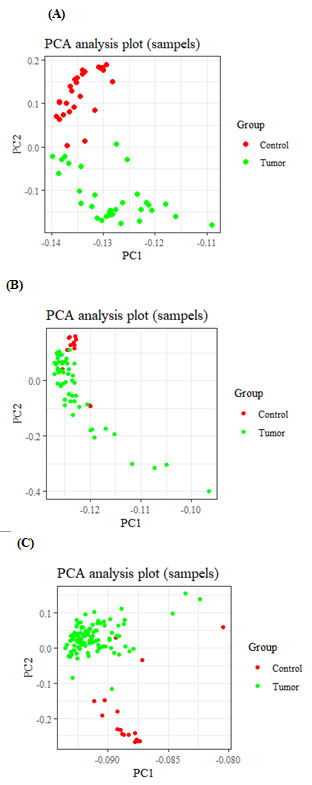
Figure 1: Principal component analysis of GSE18018(A), GSE29431(B) and GSE42568
(C) samples, based on the Normalized expression data.
RESULTS
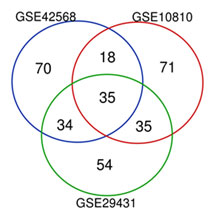
Bioinformatics analyses: Based on our criteria of the microarray study described in the method section, GSE29431, GSE 10810, and GSE42568 studies were identified, and differential expression analysis revealed a total of 200 genes that had significant changes greater than two and Adj.p.Value less than 0.01 were selected from per dataset (Figure 1). Using a Venn diagram, 35 common genes were extracted from the mentioned datasets (Figure 2).
Figure 2: The investigation of common genes among the selected datasets by Venn diagram showed that 35 common differential expression genes (DEGs) were identified as significant DE genes whose altered expression can be considered essential factors for early detection of breast cancer.
These genes had significant expression changes in all three studies, therefore very likely that changes in their expression will be helpful in the pathogenesis of breast cancer for the detection of some genes whose expression levels have not been studied yet in detail. In the process of breast cancer, literature mining has been done, and 6 out of 35 genes, including MYZAP, BHMT2, PPP1R1A, PLAC9, LOC284825, and SPX, was obtained which their role in breast cancer has not been studied yet.
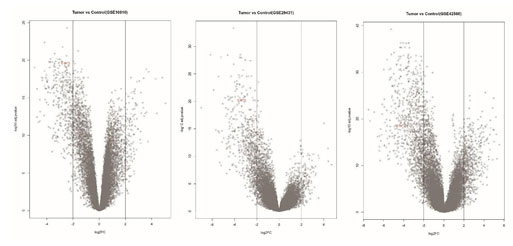
Figure 3: The volcano plots of differentially expressed genes collected from three different datasets of breast tumors as compared with normal samples, BHMT2 gene is highlighted in red.
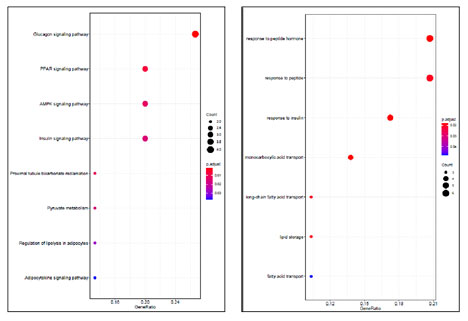
Following to evaluation of assays that they support a potential role of the gene in breast cancer, according to the function of the protein expression of BMHT2 gene in the process of Homocysteine to Methyonin conversation and it is a potential role in the process of the Hyperhomocysteinemia that its importance in the breast cancer progression was confirmed before, investigation of the expression of this gene was selected to continue the study process (Figure 3, 4).Functional enrichment analysis related to the 35 common genes were obtained, revealed the involvement of these genes mainly in response to peptide hormones and pathway enrichment analysis, introduced Glucagon signaling pathway as the top pathway (Figure 6).
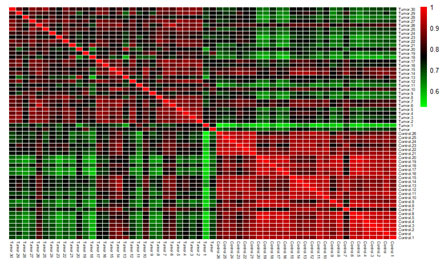
Figure 4: Heatmap of the correlation between the samples of GSE18018(A), GSE29431(B) and GSE42568 (C) dataset.
Through the dpSNP web tool based on MAF between 0.1-0.5, the SNPs which had an effect on 3’UTR of the BHMT2 gene were obtained. RS10944 demonstrated the highest MAF score. Following the investigation of seed region and nucleotides around the SNP, hsa-miR-542-3p in the case of occurrence of SNP, it seems the nucleotide alteration affects the pattern of the miR function. Also, using the RNAhybrid database, the minimum free energy of miRNA and target hybridization was measured, and the results showed that in the case of occurrence of mutation led to the free energy of the miRNA became more negative, and the probability of binding increased (Figure 7). Investigation of the expression of miRNAs in GSE40525 was performed using the limma package in the R environment, and the expression level of hsa-miR-542-3p was reported to be significantly increased.
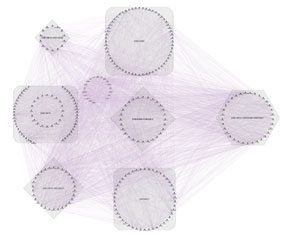
Figure 5: Network interaction of shared genes among three microarray datasets. This network contains 303 nodes and 9690 edges. Edge in this network represents the co-expression relationship between two interconnected proteins. The square represents the unique genes for each study, the rhombus contains the shared genes between two-by-two datasets, and the hexagon contains 35 common genes between the three evaluated datasets in this investigation.
Using the Co-lncRNA database, based on TCGA information, analysis has been done to identify the relationship among genes and lncRNAs in breast tumor tissue compared to normal; the complete list of lncRNAs that had an effect on the BHMT2 gene was collected. Totally 130 lncRNAs were obtained, which among them, lncRNA called LINC00922 was selected based on the confirmation of its role in the process of breast cancer pathogenesis due to previous articles (according to the results of this study, the p-Value of this lncRNA in tumor samples is very acceptable and it was 0.0004).
Figure 6: Functional Enrichment (Right image) and pathway enrichment (Left image) analyses.
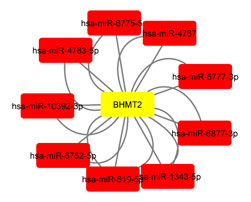
It is noticeable that this lncRNA was measured only by the RNAseq method in breast cancer tissue samples, and it was reported as increase expression. For the first time in the Isfahan BC population, the expression level in breast tumor tissue samples was examined by the real-time method in this study. miRNA-mRNA interaction analysis by miRWalk online software revealed that BHMT2 could have a remarkable interaction with 9 hub miRNAs shown in (Figure 8).
Figure 7: The amount of minimum free energy of hsa-miR-542-3p binding in 3’UTR region of BHMT2 gene in both wild condition and SNP rs10944 was measured by RNAhybrid software, which in the case of occurrence of mutation, the binding rate of this miRNA will be stronger.
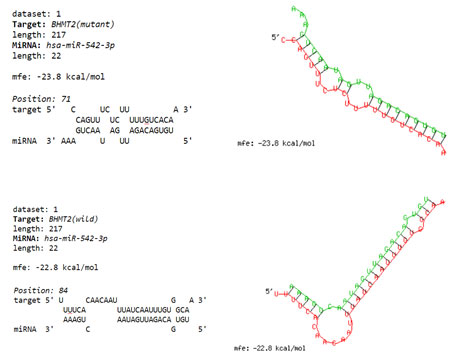
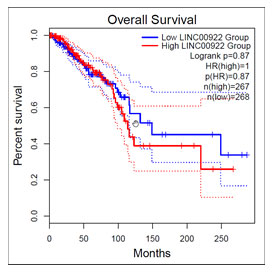
Obtained results from in silico database predicted the association of rs10944 in BHMT2 3’UTR within has-mir542-3p and T allele is minor allele. Therefore, G to T replacement single nucleotide in the BHMT2 transcript could alter binding reaction (affinity), which might change BHMT2 regulation in transcription level. To prove this, based on the HRM method, we concerned allelic frequencies for rs10944. However, no significant differences were found between case and control. Survival analysis of the TCGA RNA-seq data was performed by GEPIA2 online software. This analysis revealed that higher expression of LINC00922 is correlated with the lower survival rate of this lncRNA (Figure 9). This analysis can confirm the hypothesis that the gene is oncogenic in breast cancer.
Figure 8: Cytoscape network of mRNA-miRNA interaction analysis.
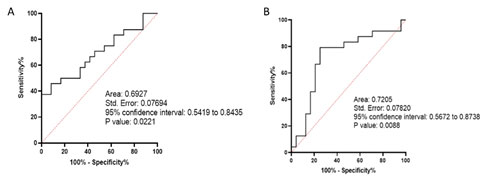
Real time PCR expression data analysis: According to real-time PCR data analysis, BHMT2 had a significant down-regulation in the tumor samples compared to normal samples (P-Value: 0.0060). Also, this analysis revealed that lncRNA LINC00922 had a significantly high expression in Breast cancer samples (P-Value: 0.0264, Figure 10). Correlation analysis of the tumor expression data of BHMT2 and LINC00922 revealed that these two RNAs have no significant correlation in the Isfahan Breast cancer population (r: -0.1581, P. Value: 0.4605).ROC analysis revealed that LINC00922 could be a prognosis biomarker for distinguishing Breast cancer samples from normal samples (AUC: 0.7205, P-Value: 0.0088, Figure 11).
Figure 9: Survival analysis of LINC00922 RNA-seq data.
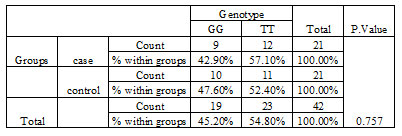
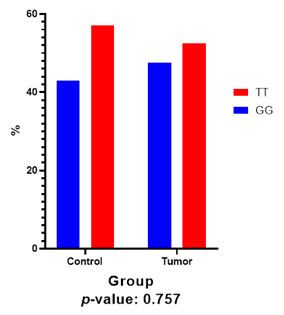
3. Genotype frequency analysis for rs10944: Analysis of three different CC, CT, and TT genotypes of rs10944 SNP revealed that there is no significant difference between the frequency of these three genotypes in control and tumor samples (Table 3, Figure 12). P-Value was calculated by the Pearson chi-square test. The clinicopathological characteristics of the patients is provided in the Table 2.
Table 2. Patient’s clinical features.
| Characteristic | Status | Number of patients |
| Stage | I | 2 (8.3%) |
| II | 6 (25%) | |
| III | 6 (25%) | |
| IV | 0 | |
| Unknown | 10 (41.7%) | |
| Tumor size (TS) | < 5 cm | 13 (54.2%) |
| > 5 cm | 5 (20.8%) | |
| Unknown | 6 (25%) | |
| Menopausal status | Yes | 11 (45.8%) |
| No | 12 (50%) | |
| Unknown | 1 (4.2%) | |
| Lymph node | Yes | 14 (58.3%) |
| No | 3 (12.5%) | |
| Unknown | 7 (29.2%) | |
| ER receptor | Positive | 9 (37.5%) |
| Negative | 7 (29.2%) | |
| Unknown | 8 (33.3%) | |
| PR receptor | Positive | 7 (29.2%) |
| Negative | 9 (37.5%) | |
| Unknown | 8 (33.3%) | |
| HER2/neu receptor | Positive | 8 (33.3%) |
| Negative | 8 (33.3%) | |
| Unknown | 8 (33.3%) |
DISCUSSION
All in all, in this research, we investigated the effect of the BHMT2 gene and its relevant lncRNA and SNP in the Breast cancer status of the Isfahan population. Our bioinformatics analyses predict that the BHMT2 could have a significantly low expression in Breast cancer tissues as compared to normal tissue. Also, it was predicted that the lncRNA LINC00922 could have a significant relation with the BHMT2 mRNA. Correlation of hsa-miR-6775-5p, hsa-miR-4767, hsa-miR-6777-3p, hsa-miR-6877-3p, hsa-miR-1343-5p, hsa-miR-619-5p, hsa-miR-6752-5p, hsa-miR-10392-3p, and hsa-miR-4783-5p miRNAs with the BHMT2 mRNA have been revealed.
Figure 10: Relative expression analysis of BHMT2 and LINC00922.
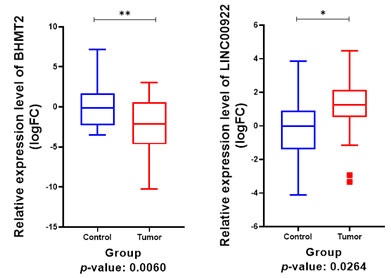
According to our experiment, BHMT2 has a significant down regulation in tumor tissues. Also, this mRNA could not be a prognosis biomarker in our samples. About lncRNA, we demonstrated that LINC00922 has a significantly high expression in Isfahan Breast cancer samples. Unlike the previous result about BHMT2, LINC00922 could be a suitable biomarker for Breast cancer. Furthermore, we find that BHMT2 and LINC00922 had no significant correlation. Our investigation about the allele frequency of rs10944 genotypes revealed no significant relationship between the difference in frequency of rs10944 genotypes in the BHMT2 gene with Breast cancer status. This result represents that BHMT2 could have a tumor suppressor effect in Breast cancer. Also, LINC00922 could be a significant oncogenic in the Isfahan Breast cancer population.
Figure 11: ROC curve of the BHMT2 (A) and LINC00922 (B).
Previously, several studies have been conducted on the association of genes with various cancers. For example, Jiang et al. reported that BHMT2 could have an essential role in Osteosarcoma by involving in the Osteosarcoma metabolic pathway. Another experiment confirmed that the amount of BHMT2 protein has a remarkable change in Breast and Ovarian cancers (Dufresne et al., 2019). Other researchers discussed a correlation between BHMT2 and colon cancer and proposed that routine exercise can help to avoid aberrant methylation of the BHMT2 gene and thereby lead to a lower risk of colon cancer (Buehlmeyer et al., 2008).
Table 3. Genotype frequency of BHMT2 gene in relation to rs 10944 in control and breast cancer patients.
Our investigation about this gene represents the same result about Breast cancer tissues. By the way, the exact effect of changing the expression of this gene on the status of breast cancer requires more detailed and comprehensive research. About lncRNA LINC00922, previous studies have demonstrated that LINC00922 has a significant overexpression in Osteosarcoma and lung cancer. Especially for lung cancer, this lncRNA could control the expression rate of CXCR4 and directly targeted miRNA-204/CXCR4 (Liang et al., 2019).
Figure 12: Frequency of different genotypes of
BHMT2 in rs10944 region.
Furthermore, the role of LINC00922 in BC was investigated in another research. This study represents that this lncRNA could prevent Breast cancer development by linking to miR-424-5p/BDNF through the prohibition role of this miRNA (Yue and Wang, 2020). The results of Our experiment could be an approve on these studies about LINC00992. Also, the bioinformatical survival analysis on RNA-seq data revealed that the low expression is directly correlated with the higher survival rate. This survival analysis could validate our experiment and results.
Based on GWAS, SNP rs10944 has been investigated as a common SNP along BHMT2, which is related to BC’s risk. Other studies indicated rs10944 was among variant alleles related to higher plasma betaine concentrations (Ilozumba et al., 2020). However, our investigation about this SNP on the Isfahan population did not show a significant genotype frequency and relationship with Breast cancer.Furthermore, our explored data estimated the upregulation of mir-542-3p by utilizing miRNA expression data. However, other studies’ results differ from the findings presented here.
An example is mir-542-3p downregulated in endometriotic tissue adenocarcinoma compared to normal endometrial tissues (Hiroki et al., 2010). Similarly, Li, Shao and Feng, 2019 proposed has-mir-542-3p low expressed in ovarian cancer, thus inhibited targeting CDK. Moreover, it has been believed has-mir-542-3p regulated several mRNAs such as BIRC5, MTDH, and MID1(Unterbruner et al., 2018).
Our experiment had some remarkable limitations, including the sample size. We suggest that similar experiments be performed on this SNP with a more significant number of samples to obtain more valid and reliable results of this SNP’s association with Breast cancer status in the Isfahan population. Analysis of different genotype models like dominant, co-dominant, and recessive models could be performed. Additionally, evaluating the expression level of listed miRNAs that was our bioinformatical result of mRNA-miRNA interaction in Isfahan Breast cancer samples could be performed. Also, the RIP method is suggesting for more RNA interaction analyses.
CONCLUSION
It is predicted that dysregulation of BHMT2 expression level could have a remarkable effect on Breast cancer status. The absence of methionine and Hyperhomocysteinemia have been linked to a decline in BHMT2 expression. The current study revealed that BHMT2 and LINC00922 can be the two novel correlated biomarker of breast cancer. More similar investigations are needed for evaluating more accurate and reliable result, specially about rs10499. We suggest that similar experiments be performed on this SNP with a more significant number of samples to obtain more valid and reliable results of this SNP’s association with Breast cancer status in the Isfahan population
ACKNOWLEDGEMENT
We wish to extend our special thanks to Mohammad Rezaei for helping data analysis process, bioinformatics interpretations and reviewing the manuscript.
Conflict of Interest: The authors have no financial conflicts of interest to declare.
Data Availability: The data will be made available on request.
Authors contribution: Seyed Ali Dibaj Zavareha : Writing- Original draft- Formal analysis- Investigation. Zahra Akhlaghia : Writing – Original draft – Formal analysis- Investigation.Sarina Samiei Esfahania: Writing – Review & Editing- Investigation.Nilofar Mohammadia: Writing – Review & Editing- Investigation.Negin Hadisadeghb: Writing – Review & Editing- Investigation.Samira Rahimiradb: Supervision- Methodology- Writing – Review & Editing.Mansoureh Azadehc: Conceptualization, Validation.
REFERENCES
Buehlmeyer, K. et al. (2008) ‘Alteration of gene expression in rat colon mucosa after exercise’, 190. doi: 10.1016/j.aanat.2007.04.002.
Dufresne, J. et al. (2019) ‘The plasma peptides of breast versus ovarian cancer’, Clinical Proteomics. BioMed Central, 16(1), pp. 1–23. doi: 10.1186/s12014-019-9262-0.
Franz, M. et al. (2018) ‘GeneMANIA update 2018’, Nucleic Acids Research. Oxford University Press, 46(W1), pp. W60–W64. doi: 10.1093/nar/gky311.
Ganu, R. S. et al. (2015) ‘Evolutionary Analyses and Natural Selection of Betaine-Homocysteine S- Methyltransferase ( BHMT ) and BHMT2 Genes’, pp. 1–19. doi: 10.1371/journal.pone.0134084.
Gilam, A. et al. (2016) ‘Local microRNA delivery targets Palladin and prevents metastatic breast cancer’, Nature Communications, 7. doi: 10.1038/ncomms12868.
Giusti, B. et al. (2008) ‘High-Throughput Multiplex Single-Nucleotide Polymorphism ( SNP ) Analysis in Genes Involved in Methionine Metabolism High-Throughput Multiplex Single-Nucleotide Polymorphism ( SNP ) Analysis in Genes Involved in Methionine Metabolism’, (September). doi: 10.1007/s10528-008-9159-5.
Gupta, I. et al. (2019) ‘Triple negative breast cancer profile, from gene to microRNA, in relation to ethnicity’, Cancers, 11(3), pp. 1–25. doi: 10.3390/cancers11030363.
Handy DE, Castro R, Loscalzo J. Epigenetic modifications: basic mechanisms and role in cardiovascular disease. Circulation. 2011 May 17;123(19):2145-56. doi: 10.1161/CIRCULATIONAHA.110.956839. PMID: 21576679; PMCID: PMC3107542.
Hata, A. and Lieberman, J. (2015) ‘Dysregulation of microRNA biogenesis and gene silencing in cancer’, Science Signaling, 8(368), p. re3. doi: 10.1126/scisignal.2005825.
Hiroki, E. et al. (2010) ‘clinicopathological features and prognoses in endometrial serous adenocarcinomas’, 101(1), pp. 241–249. doi: 10.1111/j.1349-7006.2009.01385.x.
Ilozumba, M. N. et al. (2020) ‘Associations between Plasma Choline Metabolites and Genetic Polymorphisms in One-Carbon Metabolism in Postmenopausal Women: The Women’s Health Initiative Observational Study’, The Journal of Nutrition. Oxford University Press, pp. 1–8. doi: 10.1093/jn/nxaa266.
Klinge, C. M. (2018) ‘Non-coding RNAs in breast cancer: Intracellular and intercellular communication’, Non-coding RNA, 4(4), pp. 30–40. doi: 10.3390/ncrna4040040.
Krüger, J. and Rehmsmeier, M. (2006) ‘RNAhybrid: MicroRNA target prediction easy, fast and flexible’, Nucleic Acids Research, 34(WEB. SERV. ISS.), pp. 451–454. doi: 10.1093/nar/gkl243.
Li, J., Shao, W. and Feng, H. (2019) ‘MiR-542-3p, a microRNA targeting CDK14, suppresses cell proliferation, invasiveness, and tumorigenesis of epithelial ovarian cancer’, Biomedicine and Pharmacotherapy. Elsevier, 110(1508), pp. 850–856. doi: 10.1016/j.biopha.2018.11.104.
Liang, T. et al. (2019) ‘LINC00922 accelerates the proliferation, migration and invasion of lung cancer via the miRNA-204/CXCR4 axis’, Medical Science Monitor, 25, pp. 5075–5086. doi: 10.12659/MSM.916327.
Liu, H. et al. (2016) ‘Long non-coding RNAs as prognostic markers in human breast cancer’, Oncotarget, 7(15), pp. 20584–20596. doi: 10.18632/oncotarget.7828.
Mohammad, S. et al. (2013) ‘Impact of Hyperhomocysteinemia on Breast Cancer Initiation and Progression : Epigenetic Perspective’. doi: 10.1007/s12013-013-9720-7.
Mostowska, A. et al. (2010) ‘Polymorphisms located in the region containing BHMT and BHMT2 genes as maternal protective factors for orofacial clefts’, pp. 325–332.
Moszyńska, A. et al. (2017) ‘SNPs in microRNA target sites and their potential role in human disease’, Open Biology, 7(4). doi: 10.1098/rsob.170019.
Pirouzpanah, S. et al. (2014) ‘Plasma total homocysteine level in association with folate, pyridoxine, and cobalamin status among iranian primary breast cancer patients’, Nutrition and Cancer, 66(7), pp. 1097–1108. doi: 10.1080/01635581.2014.948213.
Soudyab, M., Iranpour, M. and Ghafouri-Fard, S. (2016) ‘The role of long non-coding RNAs in breast cancer’, Archives of Iranian Medicine, 19(7), pp. 508–517. doi: 0161907/AIM.0011.
Sporikova, Z. et al. (2018) ‘Genetic Markers in Triple-Negative Breast Cancer’, Clinical Breast Cancer. Elsevier, 18(5), pp. e841–e850. doi: 10.1016/j.clbc.2018.07.023.
Unterbruner K, Matthes F, Schilling J, Nalavade R, Weber S, Winter J, et al. (2018) MicroRNAs miR-19, miR-340, miR-374 and miR-542 regulate MID1 protein expression. PLoS ONE 13(1): e0190437. https://doi.org/10.1371/journal.pone.0190437
Yousefi, H. et al. (2020) ‘Long noncoding RNAs and exosomal lncRNAs: classification, and mechanisms in breast cancer metastasis and drug resistance’, Oncogene. Springer US, 39(5), pp. 953–974. doi: 10.1038/s41388-019-1040-y.
Yu, G. et al. (2012) ‘ClusterProfiler: An R package for comparing biological themes among gene clusters’, OMICS A Journal of Integrative Biology, 16(5), pp. 284–287. doi: 10.1089/omi.2011.0118.
Yue, X. and Wang, Z. (2020) ‘Long intergenic non-coding rna linc00922 aggravates the malignant phenotype of breast cancer by regulating the microrna-424-5p/ bdnf axis’, Cancer Management and Research, 12, pp. 7539–7552. doi: 10.2147/CMAR.S267665.
Zhao, Z. et al. (2015) ‘Co-LncRNA: Investigating the lncRNA combinatorial effects in GO annotations and KEGG pathways based on human RNA-Seq data’, Database, 2015, pp. 1–7. doi: 10.1093/database/bav082.
Zhu, Y. et al. (2019) ‘Long noncoding RNA Linc00460 promotes breast cancer progression by regulating the miR-489-5p/FGF7/AKT axis’, Cancer Management and Research, Volume 11, pp. 5983–6001. doi: 10.2147/cmar.s207084.

