Ho Chi Minh City University of Food Industry 140 Le Trong Tan Street,
Tan Phu district, Ho Chi Minh City 700000, Vietnam
Corresponding author email: thehv@hufi.edu.vn
Article Publishing History
Received: 10/04/2021
Accepted After Revision: 30/05/2021
Three DNA barcode loci consisting of ITS, matK and rbcL have been used intensively to discriminate jewel orchid species. Nevertheless, the discrimination ability of each locus is inconsistent among researches. Therefore, it is necessary to simultaneously check a large number of published DNA sequences to get an overview of the ability to recognize orchid varieties. In this study, total of 124 DNA sequences of these three loci from Genbank were evaluated for the discrimination ability on 11 species belonging to five genus of jewel orchids. The obtained data show the significant variability of barcode sequences at both taxonomy levels. Distinguishing ability descend from matK, ITS and rbcL. The obtained results suggest that the discrimination capacity of ITS, matK and rbcL DNA barcode loci are variable among different species of jewel orchid plants, in which matK and ITS loci reveal more potential for genetic classification at genus and species level of this herbal plants. In future, higher sequence number should be included in the analysis to give more reliable result. The information from this study could be useful in conservation and development programs of jewel orchid plants.
DNA Barcode, ITS, Jewel Orchid, Matk, Rbcl.
Ho V. T. Evaluating the Effectiveness of Three DNA Barcode Loci to Classify Jewel Orchids Using In silico Approach. Biosc.Biotech.Res.Comm. 2021;14(2).
Ho V. T. Evaluating the Effectiveness of Three DNA Barcode Loci to Classify Jewel Orchids Using In silico Approach. Biosc.Biotech.Res.Comm. 2021;14(2). Available from: <a href=”https://bit.ly/3aQqbEO”>https://bit.ly/3aQqbEO</a>
Copyright © Ho This is an open access article distributed under the terms of the Creative Commons Attribution License (CC-BY) https://creativecommns.org/licenses/by/4.0/, which permits unrestricted use distribution and reproduction in any medium, provide the original author and source are credited.
INTRODUCTION
Jewel orchid is a general term of different species belonging to Orchidaceae family. This plant can be found in large area from Southern China, Northeast India, Thailand, Vietnam, the Philippines, Malaysia, Indonesia and Myanmar. Beside ornamental use, jewel orchid is got more attention due to its high medical value. Different parts of plant are applied for treating numerous diseases such as abdominal pain, diabetes, nephritis, fever, hypertension, liver, and pleurisy (Du et al., 2008) since several medicinal compounds with strong biological activity have been identified in these plants (Liang et al, 1990; Lin et al., 1993; Panda et al., 2014).
The term “jewel orchid” is used to refer to various species in Orchidaceae family having velvety brocade-like leaves with beautiful veins. Nevertheless, the medicinal and economical value is species dependent, thus, an accurate classification would be crucial importance as a basis for conservation and development. Traditionally, jewel orchids are discerned based on plant morphological characteristics such as leaves, stem structure, or flowers (Trinh et al., 2020).
While this method has been confirmed economically due to its ease and low cost, it is error-prone method due to identical external morphology features, large variable polymorphisms between adult and juvenile stages, and environmental factors as well as the plant growth development phases, all are leading to inaccuracy (Ahmedand and Mohamed, 2014).
Furthermore, the inability to precisely identify specimens under damaged or processed conditions raises serious concerns about the medicinal value of the jewel orchid-derived products. Consequently, incorrect utilization will reduce effectiveness or harm the health of the patient due to the variation in medicinal compounds and application among different jewel orchid members (Du et al., 2008; Poobathy et al., 2018; Trinh et al., 2020).
Based on the rapid development of DNA sequencing technology, the application of a short standard DNA sequence, so-called DNA barcode, to identify target plant species has been used intensively. This method possesses several advantages in the comparison to traditional methods such as high repeatability and stability, applicability to any developmental stages of organism and ability to identify target organism being destroyed or processed (Barcaccia et al., 2016). Several barcode loci have been tried to investigate DNA barcode candidates for plant identification (Hollingsworth et al. 2011; Kress, 2017).
However, two chloroplast gene namely maturase K (matK) andribulose-1, 5-biphosphate carboxylase (rbcL) have been proposed as preferred plant barcoding loci by consortium for the barcodes of life (CBOL, 2009). Beside matK and rbcL as standard DNA barcode, internal transcribed spacer (ITS) has also been used intensively for classification several plants recently such as Talinum paniculatum (Nguyen et al., 2017); Astragalus spp. (Zhang and Jiang, 2020); Oryza (Zhang et al., 2021).
In a short time, studies using these three DNA barcode loci for jewel orchid identification have been published (Chen and Shiau, 2015; Lv et al., 2015; Hu et al., 2019; Huynh et al., 2019; Sherif et al., 2020) suggesting the usefulness and potential of these three loci in plant classification. Despite the confirmed effectiveness of DNA barcode in plant identification, discrimination power and trending utilization of each barcode loci are variable. After careful survey 16 popular DNA barcode loci from 2005 to 2010, Hollingsworth and colleagues found the large difference in enthusiasm of using different locus (Hollingsworth et al., 2011).
The species identification capacity of rbcL locus was higher than that of matK and ITS on mangrove plants (Wu et al., 2019). Nevertheless, another study in China at same time showed the inferior of rbcL to ITS and matK on Astragalus spp. (Zhang and Jiang, 2019). Therefore, the present study focused on evaluate the identification ability of ITS, matK and rbcL loci in jewel orchid plants by using DNA sequences available on the National Center for Biotechnology Information (NCBI). The obtained results could provide information to escalate the effectiveness in classifying and identifying different jewel orchid population at species and genus level.
MATERIAL AND METHODS
The sequences of ITS, matK and rbcL loci belonging to different jewel orchid species were download from nucleotide database of NCBI (URL: http: //www.ncbi.nlm.nih.gov) by using corresponding Latin name and barcode locus as keywords. The sequences were selected for analysis based on criteria proposed by Suesatpanit and colleagues (1) sequences are not ‘unverified’ without a species name (2) contain <3% ambiguous base ‘N’ (Suesatpanit et al. 2017) and presented in Table 1.
Sequences were converted into FASTA format and subjected to Multiple Sequence Alignment using Clustal W by using MEGA 6 software (Tamura et al. 2013). This software was also applied to calculate the evolutionary divergence for each data set and pattern of nucleotide substitution. For phylogenetic analysis we used Neighbor-Joining tree method with 1000 bootstrap and presented as circular cladograms (Ho and Nguyen, 2020). In order to estimate species resolution for a given barcode locus, the species/genus were resolved if conspecific individuals are grouped into one monophyletic branch in the phylogenetic tree with bootstrap support greater than 50% (Zhang et al., 2019). Contrarily, if separated in paraphyletic branches such species and genus are considered as identification failure (Sikdar et al. 2018).
RESULTS AND DISCUSSION
Sequence retrieve: By using keyword “species names +ITS/matK/rbcL” to find the sequences deposited in NCBI GenBank, after removal of unrealizable sequences as described by Suesatpanit and colleagues (2017), total of 124 sequences were obtained, there are 63, 35 and 26 DNA sequences of ITS, matK and matK regions, respectively (Table 1).
Table 1. List of jewel orchids and number of retrieved sequences used in this study
| Sample code | Latin name | Genus | Sequence number | |||
| ITS | matK | rbcL | ||||
| 1 | ARot | Aenhenrya rotundifolia | Aenhenrya | 0 | 1 | 1 |
| 2 | AA | Anoectochilus albolineatus | Anoectochilus | 1 | 1 | 1 |
| 3 | AE | Anoectochilus elatus | 0 | 6 | 6 | |
| 4 | AF | Anoectochilus formosanus | 5 | 1 | 0 | |
| 5 | AL | Anoectochilus lylei | 2 | 2 | 1 | |
| 6 | ARox | Anoectochilus roxburghii | 16 | 5 | 1 | |
| 7 | AS | Anoectochilus setaceus | 6 | 0 | 0 | |
| 8 | DM | Dossinia marmorata | Dossinia | 6 | 4 | 2 |
| 9 | GH | Goodyera hispida | Goodyera | 4 | 0 | 0 |
| 10 | GP | Goodyera pubescens | 2 | 6 | 6 | |
| 11 | GVir | Goodyera viridiflora | 10 | 6 | 1 | |
| 12 | GVit | Goodyera vittata | 2 | 1 | 0 | |
| 13 | LD | Ludisia discolor | Ludisia | 8 | 2 | 6 |
| 14 | MP | Macodes petola | Macodes | 1 | 0 | 1 |
In general, ITS locus was more intensively studied with up to 63 sequences aquired, whereas matK and rbcL are likely unattended with lower sequence number. Considering each species, the sequence availability also is varying, in which, Anoectochilus roxburghii, Goodyera viridiflora, Ludisia discolor and Goodyera pubescen show highest sequence abundance suggesting the economic importance of these species. Since previous studies highlighted the abundance of medical compounds detected in these species. Anoectochilus roxburghii is rich in polysaccharides, flavonoids, glycosides, organic acids, volatile compounds, steroids, triterpenes, alkaloids, and nucleosides (Ye et al., 2017); butanolide, goodyeroside A, butanolide in Goodyera genus (Du et al., 2008), amino acids and anthocyanin content in Ludisia discolor (Poobathy et al., 2016).
Estimation of sequence divergence: The variation within and between species based on ITS, matK, and rbcL regions were calculated and the data representing by evolutionary divergence (p distance value) are shown in Table 2. Based on p distance, it suggests that there is the large variability of three regions within a specific species of jewel orchid. Anoectochilus setaceus show highest variation divergence in ITS locus (0.044), Anoectochilus lylei show highest at matK (0.014) and Ludisia discolor at rbcL (0.004).
Table 2. Estimates of Average Evolutionary Divergence over Sequence Pairs within Group
| Species | p distance
of ITS |
SE | p distance
of matK |
SE | p distance
of rbcL |
SE |
| Aenhenrya rotundifolia | NA | NA | NA | NA | NA | NA |
| Anoectochilus albolineatus | NA | NA | NA | NA | NA | NA |
| Anoectochilus elatus | NA | NA | 0.000 | 0.000 | 0.000 | 0.000 |
| Anoectochilus formosanus | 0.002 | 0.002 | NA | NA | NA | NA |
| Anoectochilus lylei | 0.008 | 0.006 | 0.014 | 0.004 | NA | NA |
| Anoectochilus roxburghii | 0.003 | 0.002 | 0.023 | 0.004 | NA | NA |
| Anoectochilus setaceus | 0.044 | 0.008 | NA | NA | NA | NA |
| Dossinia marmorata | 0.000 | 0.000 | 0.002 | 0.001 | 0.000 | 0.000 |
| Goodyera hispida | 0.009 | 0.004 | NA | NA | NA | NA |
| Goodyera pubescens | 0.004 | 0.004 | 0.002 | 0.001 | 0.000 | 0.000 |
| Goodyera viridiflora | 0.009 | 0.003 | 0.012 | 0.003 | NA | NA |
| Goodyera vittata | 0.079 | 0.018 | NA | NA | NA | NA |
| Ludisia discolor | 0.003 | 0.003 | 0.000 | 0.000 | 0.004 | 0.002 |
| Macodes petola | NA | NA | NA | NA | NA | NA |
(The presence of n/c in the results denotes cases in which it was not possible to estimate evolutionary distances. Note: SE: standard error; NA: not available).
The number of base substitutions per site from averaging over all sequence pairs within each group are shown in Table 3, 4 and 5. The variability among ITS, matK and rbcL regions is from 0.003 – 0.106, 0 – 0.06, and 0 – 0.035, respectively.
Table 3. Estimates of Evolutionary Divergence over Sequence Pairs between Groups for ITS
| AA* | AF | AL | AR | AS | DM | GH | GP | GVir | GVit | LD | MP | |
| AA | 0.006 | 0.003 | 0.005 | 0.004 | 0.016 | 0.019 | 0.022 | 0.018 | 0.016 | 0.016 | 0.016 | |
| AF | 0.010 | 0.003 | 0.002 | 0.006 | 0.014 | 0.018 | 0.021 | 0.016 | 0.015 | 0.015 | 0.014 | |
| AL | 0.004 | 0.006 | 0.003 | 0.005 | 0.015 | 0.018 | 0.021 | 0.017 | 0.015 | 0.015 | 0.015 | |
| AR | 0.008 | 0.003 | 0.005 | 0.005 | 0.014 | 0.018 | 0.021 | 0.016 | 0.015 | 0.015 | 0.014 | |
| AS | 0.023 | 0.028 | 0.025 | 0.026 | 0.016 | 0.019 | 0.022 | 0.018 | 0.016 | 0.016 | 0.016 | |
| DM | 0.062 | 0.055 | 0.058 | 0.055 | 0.079 | 0.018 | 0.021 | 0.017 | 0.016 | 0.015 | 0.013 | |
| GH | 0.086 | 0.079 | 0.082 | 0.079 | 0.104 | 0.090 | 0.009 | 0.009 | 0.010 | 0.016 | 0.017 | |
| GP | 0.106 | 0.099 | 0.101 | 0.099 | 0.125 | 0.110 | 0.027 | 0.013 | 0.013 | 0.018 | 0.020 | |
| GVir | 0.078 | 0.071 | 0.074 | 0.071 | 0.096 | 0.081 | 0.028 | 0.046 | 0.011 | 0.015 | 0.016 | |
| GVit | 0.080 | 0.072 | 0.075 | 0.073 | 0.098 | 0.086 | 0.047 | 0.063 | 0.052 | 0.013 | 0.015 | |
| LD | 0.066 | 0.059 | 0.062 | 0.059 | 0.085 | 0.059 | 0.069 | 0.084 | 0.069 | 0.066 | 0.013 | |
| MP | 0.058 | 0.051 | 0.054 | 0.051 | 0.076 | 0.049 | 0.077 | 0.096 | 0.067 | 0.073 | 0.042 |
(*: Species names are abbreviated corresponding to Table 1, standard error of comparison is presented in italics upper diagonal).
Table 4. Estimates of Evolutionary Divergence over Sequence Pairs between Groups for matK
| AA* | AF | AL | AR | DM | GP | GVIR | GVIT | LD | AE | ARot | |
| AA | 0.004 | 0.002 | 0.004 | 0.007 | 0.009 | 0.006 | 0.007 | 0.006 | 0.000 | 0.009 | |
| AF | 0.014 | 0.004 | 0.003 | 0.007 | 0.009 | 0.007 | 0.008 | 0.006 | 0.004 | 0.009 | |
| AL | 0.007 | 0.017 | 0.004 | 0.007 | 0.008 | 0.006 | 0.007 | 0.006 | 0.002 | 0.009 | |
| AR | 0.012 | 0.007 | 0.013 | 0.007 | 0.009 | 0.007 | 0.007 | 0.005 | 0.004 | 0.009 | |
| DM | 0.031 | 0.037 | 0.035 | 0.035 | 0.008 | 0.007 | 0.007 | 0.005 | 0.007 | 0.008 | |
| GP | 0.049 | 0.056 | 0.050 | 0.053 | 0.044 | 0.006 | 0.007 | 0.008 | 0.009 | 0.009 | |
| GVIR | 0.035 | 0.041 | 0.037 | 0.039 | 0.034 | 0.031 | 0.002 | 0.006 | 0.006 | 0.007 | |
| GVIT | 0.033 | 0.040 | 0.035 | 0.038 | 0.032 | 0.030 | 0.007 | 0.006 | 0.007 | 0.008 | |
| LD | 0.022 | 0.024 | 0.025 | 0.023 | 0.021 | 0.041 | 0.027 | 0.025 | 0.006 | 0.008 | |
| AE | 0.000 | 0.014 | 0.007 | 0.012 | 0.031 | 0.049 | 0.035 | 0.033 | 0.022 | 0.009 | |
| ARot | 0.055 | 0.060 | 0.058 | 0.058 | 0.047 | 0.054 | 0.042 | 0.042 | 0.045 | 0.055 |
(*: Species names are abbreviated corresponding to Table 1, standard error of comparison is presented in italics upper diagonal).
Table 5. Estimates of Evolutionary Divergence over Sequence Pairs between Groups for rbcL
| AA* | AL | ARox | DM | GP | GVir | LD | MP | AE | ARot | |
| AA | 0.000 | 0.002 | 0.002 | 0.003 | 0.000 | 0.002 | 0.008 | 0.000 | 0.003 | |
| AL | 0.000 | 0.002 | 0.002 | 0.003 | 0.000 | 0.002 | 0.008 | 0.000 | 0.003 | |
| ARox | 0.002 | 0.002 | 0.003 | 0.003 | 0.002 | 0.003 | 0.008 | 0.002 | 0.004 | |
| DM | 0.002 | 0.002 | 0.004 | 0.003 | 0.002 | 0.003 | 0.007 | 0.002 | 0.004 | |
| GP | 0.004 | 0.004 | 0.006 | 0.006 | 0.003 | 0.003 | 0.008 | 0.003 | 0.004 | |
| GVir | 0.000 | 0.000 | 0.002 | 0.002 | 0.004 | 0.002 | 0.008 | 0.000 | 0.003 | |
| LD | 0.004 | 0.004 | 0.006 | 0.006 | 0.008 | 0.004 | 0.008 | 0.002 | 0.004 | |
| MP | 0.028 | 0.028 | 0.030 | 0.026 | 0.032 | 0.028 | 0.032 | 0.008 | 0.008 | |
| AE | 0.000 | 0.000 | 0.002 | 0.002 | 0.004 | 0.000 | 0.004 | 0.028 | 0.003 | |
| ARot | 0.006 | 0.006 | 0.008 | 0.008 | 0.010 | 0.006 | 0.009 | 0.035 | 0.006 |
(*: Species names are abbreviated corresponding to Table 1, standard error of comparison is presented in italics upper diagonal).
Substitution bias consisting of transition and transversion at codon position for each luster could reveal the trend of evolution. In this study, the substitution of different bases in analyzed regions is evaluated on entire codon positions (1st+ 2nd + 3rd nucleotide) and shown in Table 6. In general, transitional substitution is higher than transversional substitution in all loci. Two chloroplast namely matK and rbcL show a higher transversionsal substitution than ITS.
Table 6. Maximum Composite Likelihood Estimate of the Pattern of Nucleotide Substitution (in percentage)
| ITS | matK | rbcL | ||||||||||
| A | T | C | G | A | T | C | G | A | T | C | G | |
| A | – | 3.97 | 3.69 | 18.69 | – | 8.13 | 3.37 | 10.24 | – | 6.10 | 4.59 | 11.39 |
| T | 3.04 | – | 18.31 | 4.21 | 6.53 | – | 7.60 | 3.11 | 5.61 | – | 14.16 | 4.56 |
| C | 3.04 | 19.67 | – | 4.21 | 6.53 | 18.35 | – | 3.11 | 5.61 | 18.81 | – | 4.56 |
| G | 13.49 | 3.97 | 3.69 | – | 21.53 | 8.13 | 3.37 | – | 13.75 | 6.10 | 4.59 | – |
(Note: Each entry shows the probability of substitution from one base (row) to another base (column). For simplicity, the sum of r values is made equal to 100. Rates of different transitional substitutions are shown in bold and those of transversionsal substitutions are shown in italics).
Estimation of species resolution: Based on phylogenetic analysis, the species resolution is variable among three DNA barcode loci (Figure 1, 2 and 3). MatK show highest effectiveness in plant discrimination in which all of five genus are resolved (Figure 1), especially this locus is able to distinguish five per ten species consisting of Aenhenrya rotundifolia, Goodyera pubescens, Dossinia marmorata, and Ludisia discolor. ITS locus could also discriminate four genus consist of Anoectochilus, Dossinia, Macodes, and Lusidia. DNA sequences from this locus could separate four species namely Goodyera pubescens, Ludisia discolor, Macodes petola, and Dossinia mamorata (Figure 2).
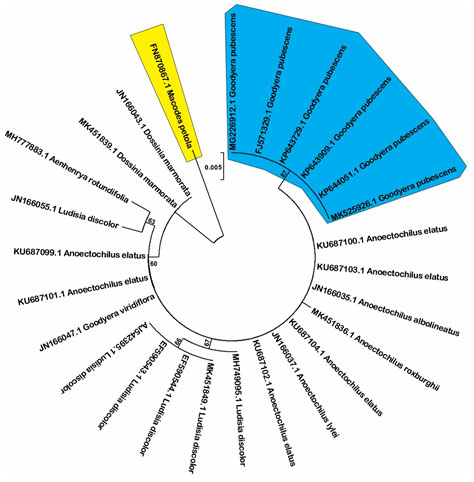
Although rbcL locus was reported as a good marker to differentiate species in Prunus genus (Singh et al. 2016), our data show that this is the poorest among three studied loci in term of discrimination power in which only Macodes petola and Goodyera pubescens are completely resolved (Figure 3). One of main reason of low discrimination power of this locus could be due to limited number of examined sequences, Sikdar and colleagues proposed to increase sequence number to enhance the discrimination power (Sikdar et al. 2018).
Figure 1: Neighbor-joining tree with 1000 bootstrap replicated based on matK sequences (Shaded areas and dot cycles present the completely resolved species and genus, respectively).
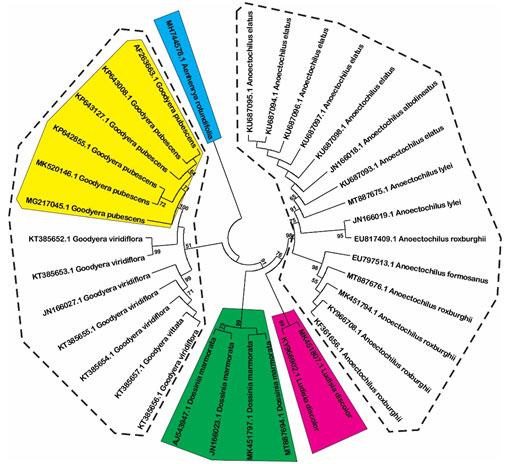
Even both Anoectochilus and Goodyera genus are rich in several medicinal compounds, the former is considered better than the later since some corresponding compounds extracted from Goodyera is less effective than those from Anoectochilus species (Du et al., 2008). Furthermore, Anoectochilus species are traditionally used for treating chest and abdominal pains, diabetes, nephritis, fever, hypertension, impotence, liver and spleen disorder, and pleurodynia whereas, L. discolor is used to reduce coughs and strengthening weak lungs (Poobathy et al., 2018). Thus, the high discrimination power of matK locus is highly valuable to identify, utilize and develop these two species for specific medicinal purposes.
Figure 2: Neighbor-joining tree with 1000 bootstrap replicated based on ITS sequences (Shaded areas and dot cycles present the completely resolved species and genus, respectively).
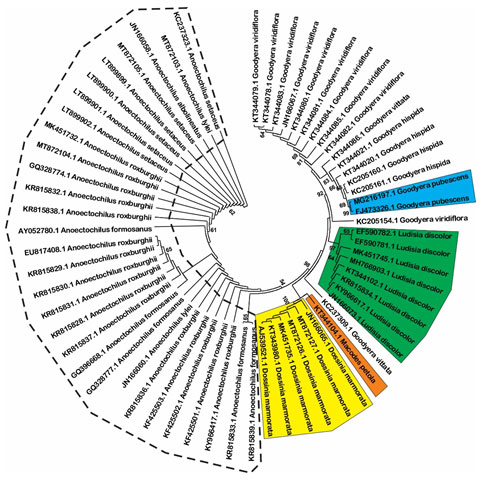
Figure 3: Neighbor-joining tree with 1000 bootstrap replicated based on rbcL sequences (Shaded areas present the completely resolved species).
CONCLUSION
The usefulness of three main DNA barcode loci in classify different jewel orchid plants is confirmed by In silico analysis. The obtained results suggest that the discrimination capacity of ITS, matK and rbcL DNA barcode loci are variable among different species of jewel orchid plants, in which matK and ITS loci reveal more potential for genetic classification at genus and species level of this herbal plants. In the future, higher sequence number should be included in the analysis to give more reliable result. The information from this study could be useful in conservation and development programs of jewel orchid plants.
Conflict of Interests: The author has no conflict of interest.
REFERENCES
Ahmedand THM, Mohamed ZMA (2014). Genetic diversity of mango (Mangifera indica L.) cultivars in Shendi Area. Extensive journal of applied sciences 3 (6): 219-224.
Barcaccia G, Lucchine M, Cassandro M (2016). DNA Barcoding as a Molecular Tool to Track Down Mislabeling and Food Piracy. Diversity 8,2 doi:10.3390/d8010002.
CBOL Plant Working Group et al. (2009). A DNA barcode for land plants. Proceedings of the National Academy of Sciences of the United States of America 106: 12794-12797.
Chen JR, Shiau YJ (2015). Application of internal transcribed spacers and maturase K markers for identifying Anoectochilus, Ludisia, and Ludochilus. Biologia Plantarum 59(3): 485-490. DOI: 10.1007/s10535-015-0520-3.
Du XM, Irino N, Furusho N et al. (2008). Pharmacologically active compounds in the Anoectochilus and Goodyera species. Journal of Natural Medicines 62: 132 – 148. DOI 10.1007/s11418-007-0169-0
Ho VT, Nguyen MP (2020). An in silico approach for evaluation of rbcL and matK loci for DNA barcoding of Cucurbitaceae family. Biodiversitas 21(8): 3879-3885. DOI: 10.13057/biodiv/d210858
Hollingsworth ML, Clark AA, Forrest LL et al. (2009). Selecting barcoding loci for plants: evaluation of seven candidate loci with species-level sampling in three divergent groups of land plants. Molecular Ecology Resources 9: 439-457. DOI: 10.1111/j.1755-0998.2008.02439.x
Hollingsworth PM, Graham SW, Little DP (2011). Choosing and using a plant DNA barcode. Plus ONE 6(5): e19254 oi:10.1371/journal.pone.0019254
Hu SJ, Hu HY, Gao H et al. (2019). DNA barcode and rapid identification of the precious herb Herba Anoectochili. Chinese journal of Natural medicines 17(10): 0738-0745.
Huynh HD, Nguyen TG, Duong HX et al. (2019). Using some dna barcode for the genetic analysis and identifying some species of Anoectochilus spp. Can Tho University journal of Science 55(1): 14-23.
Kress WJ (2017). Plant DNA barcodes: applications today and in the future. Journal of Systematics and Evolution 55(4): 291-307. Doi: 10.111/jse.12254.
Liang WL, Chen RC, Chiang YJ et al. (1990). Study of Anoectochilus species. I. Study on the physiological activities of Jin-Sian-Lian. Formosan science 43, 47 (1990).
Lin JM, Lin CC, Chiu HF et al. (1993), “Evaluation of the anti-inflammatory and liver-protective effects of Anoectochilus formosanus, Ganoderma lucidum and Gynostemma pentaphyllum in rats”, The American Journal of Chinese Medicine, 21 (1), pp. 59 – 69. DOI: 10.1142/S0192415X9300008X
Lv T, Teng R, Shao Q et al. (2015). DNA barcodes for the identification of Anoectochilus roxburghii and its adulterants. Planta DOI 10.1007/s00425-015-2353-x
Nguyen TNL, Nguyen HQ, Nguyen TH et al. (2017). Use of ITS DNA barcode for identification of Jewels of Opar (Talinum paniculatum) collected in Thanh Hoa, Vietnam. Vietnam journal of Science, Technolgoy and Engineering 60(1): 46-49.
Panda A, Rath S, Pradhan D et al. (2014), “Hepatoprotective and sub-acute toxicity study of whole part of the plant Anoectochilus formosanus Hayata (Orchidaceae)”, International Journal of Pharmacy and Pharmaceutical Sciences, 6 (2), pp. 617 – 621.
Poobathy R, Zakaria R, Murugaiyah V et al. (2018). Autofluorescence study and selected cyanidin quantification in the Jewel orchids Anoectochilus sp. and Ludisia discolor. PLoS ONE 13(4): e0195642. https://doi.org/10.1371/journal.pone.0195642
Poobathy R, Zakaria R, Hamzah SMES et al. (2016). Early studies on protoplast isolation of Ludisia discolor, a wild orchid. Tropical Life Sciences Research 27(Supp. 1): 15–19. doi: 10.21315/tlsr2016.27.3.3
Sherif NA, Kumar TS, Rao MV (2020). DNA barcoding and genetic fidelity assessment of micro propagated Aenhenrya rotundifolia (Blatt.) C.S. Kumar and F.N. Rasm.: a critically endangered jewel orchid. Physiology and Molecular Biology of Plants 26: 2391–2405
Sikdar S, Tiwari S, Thakur VV et al. (2018). An in silico approach for evaluation of rbcL and matK loci for DNA barcoding of Fabaceae family. International Journal of Chemical Studies 6 (6): 2446-2451.
Singh A, Drishti, Negi G et al. (2016). In silico analysis of sequence variation in rbcL gene to asses phylogenetic relations in Setaria species. International Conference on Innovative Research in Agriculture, Food Science, Forestry, Horticulture, Aquaculture, Animal Sciences, Biodiversity, Ecological Sciences and Climate Change: 16-18.
Suesatpanit T, Osathanunkul K, Madesis P et al. (2017). Should DNA sequence be incorporated with other taxonomical data for routine identifying of plant species? BMC Complementary Medicine and Therapies 17: 437. DOI 10.1186/s12906-017-1937-3.
Tamura K, Stecher G, Peterson D et al. (2013). MEGA 6: Molecular evolutionary genetic analysis version 6. Molecular Biology and Evolution 30 (12): 2725-2729.
Trinh NB, Trieu TH, Phung DT et al. (2020). Medicinal Plant, Anoectochilus: Distribution, Ecology, Commercial Value and Use in North Vietnam. Journal of Pharmaceutical Research International 32(11): 84-92.
Ye S, Shao Q, Zhang A (2017). Anoectochilus roxburghii: A review of its phytochemistry, pharmacology, and clinical applications. Journal of Ethnopharmacology 209: 184-202. http://dx.doi.org/10.1016/j.jep.2017.07.032
Wu F, Li M, Liao B et al. (2019). DNA barcoding analysis and phylogenetic relation of mangroves in Guangdong province, China. Forest 10, 56; doi:10.3390/f10010056
Zhang YB, Yuan Y, Pang YX et al. (2019). Phylogenetic reconstruction and Divergence Time Estimation of Blumea DC. (Asteraceae: Inuleae) in China Based on nrDNA ITS and cpDNA trnL-F Sequences. Plants 8, 210; doi:10.3390/plants8070210
Zhang D, Jiang B (2020). Species identification in complex groups of medicinal plants based on DNA barcoding: a case study on Astragalus spp. (Fabaceae) from southwest China. Conservation Genetics Resources https://doi.org/10.1007/s12686-019-01119-6
Zhang W, Sun Y, Liu J et al. (2021). DNA barcoding of Oryza: conventional, specific, and super barcodes. Plant Molecular Biology 105:215–228, https://doi.org/10.1007/s11103-020-01054-3

