Biogas Research Center and Microbiology Department, Gujarat
Vidyapith, Sadra, Gandhinagar, Gujarat, India
Corresponding author email: bhattnikhil2114@gmail.com
Article Publishing History
Received: 14/08/2021
Accepted After Revision: 18/12/2021
Distillery spent wash is an unwanted residual liquid waste generated during alcohol production. It is a potential source for production of different industrially important products. Distillery spent wash is dark colored and has many organic compounds as a waste. In this experiment, removal of color and organic compounds was carried out by anaerobic treatment. The treated spent wash was utilized for citric acid production with the help of microorganisms. The current study was performed with the treated spent wash which was applied for high level of citric acid production by a mutant strain of Aspergillus fumigatus PN12. The parent strain Aspergillus fumigatus PN12 was mutagenized by UV exposure to enhance citric acid production. After UV exposure investigation, mutant strain was selected for optimization and statistical method. The best citric acid production obtained was, 26.45 g/L at 30 ℃ with pH 6.0, 0.1 g/L of KH2PO4 and (NH4)2SO4 under OFAT.
Under RSM optimization, maximum citric acid production was achieved as 30.89 g/L. Thus, the process optimization through the statistical approach resulted in a 1.16-fold enhancement in citric acid production as compared to that of the OFAT parametric conditions. Citric acid producing enzymes such as aconitase, NAD+-isocitrate dehydrogenase and NADP+ isocitrate dehydrogenase was studied. Maximum activity (U/mg) of aconitase (3.19±0.023), NAD+-isocitrate dehydrogenase (3.0±0.15) and NADP+ isocitrate dehydrogenase (2.91±0.17) was observed at 96 h. The present study can conclude that spent wash is potential source for citric acid production. Utilization of mutant strain of Aspergillus fumigatus PN12 is beneficiary for large scale industrial fermentation and citric acid production.
Aspergillus fumigatus, Citric acid, Distillery spent wash, Fermentation, UV exposure
Aghera P, Bhatt N.Enhanced Production of Citric Acid by Mutant PN12 of Aspergillus fumigatus Using Statistical Design. Biosc.Biotech.Res.Comm. 2021;14(4).
Aghera P, Bhatt N.Enhanced Production of Citric Acid by Mutant PN12 of Aspergillus fumigatus Using Statistical Design. Biosc.Biotech.Res.Comm. 2021;14(4). Available from: <a href=”https://bit.ly/3C5uN4p“>https://bit.ly/3C5uN4p</a>
Copyright © This is an Open Access Article distributed under the Terms of the Creative Commons Attribution License (CC-BY) https://creativecommons.org/licenses/by/4.0/, which permits unrestricted use distribution and reproduction in any medium, sources the original author and sources are credited.
INTRODUCTION
Citric acid can be derived from natural sources (e.g., oranges, berries, limes, lemons, tangerines, and grapes) and synthetic sources (e.g., chemical reaction and microbial fermentation). Microorganisms can consume cheap raw materials and convert them into a value-added product such as organic acid. Generated wastewaters have many organic compounds which are utilized for production of various fermented products. Recently, spent wash generated from alcohol-producing industries is utilized for citric acid production. Citric acid has several extremely variable features and is purely a biological based product. So, it can be applied risk-free in the food and pharmaceutical industries. The benefit and versality of citric acid increase its demand in daily life consumption all over world (Sun et al. 2017; Aboyeji et al. 2020).
Increase in citric acid production is a major thing to overcome the demand in industries. Many techniques such as random mutations and selections are based on working hypotheses that are available for strain improvement. Selection of mutant strains is possible by the techniques of single-colony (single-spore) isolation and stable long-term maintenance of isolated strains. These are the principal ones that are generally employed on the vast scale. Various mutant strains of Aspergillus sp. are obtained and used for commercial production of citric acid. For this, mutagenesis is carried out by physical and chemical mutagens. Physical mutagens are UV and gamma radiation whereas chemical mutagens are ethyl methane sulfonate, N-Methyl-N-Nitrosoguanidine, ethidium bromide and acridine orange (Prasad et al. 2014; Alhadithy et al. 2020).
The Plackett-Burman design (PBD) is a statistical method used for screening the factors (media components) and finds the most significant influence on factors in a minimum number of experiments. After screening for the significant media components by the PBD method, the statistically based optimization using central composite design (CCD) and Box Behnken Design (BBD) was carried out under response surface methodology (RSM). The benefits of this method were the decreased number of experiments, time, and material resources. Furthermore, the analysis performed on the results can be easily realized with reduced experimental errors (Ayeni et al. 2019).
In the present investigation, efforts were made for raising potent of Aspergillus fumigatus PN12, a recently isolated fungal strain, for citric acid production by random mutagenesis using UV-irradiation. For further cost reduction, the ability of the selected mutagenized strain to utilize spent wash as carbon source was also examined. The aim of study was, production of citric acid using RSM with BBD by investigating the effects of parameters as well as citric acid fermentation in the optimized medium carried out in a 3 L bio fermenter.
MATERIAL AND METHODS
For the processing of raw material, chemical and medium component, distillery spent wash was obtained from sugar industry, Madhi, Surat, Gujarat, India. It was collected in an airtight sterile container and stored in refrigerator for the use of whole experiments. Spent wash contain high amount of sugars which can be utilized to convert valuable fermented products by fermentation process. Pretreatment of spent wash conducted in suspended growth reactor by physicochemical parameters. PDA medium, other mineral salt and nitrogen sources were purchased from Himedia laboratory, and S. D. fine (India). Citric acid enzymes reagents were supplied by Himedia Laboratory (India). All chemicals were of the highest purity and of an analytical grade.
For the isolation of fungal culture and gene sequencing, mutant strain Aspergillus fumigatus PN12 was isolated and identified as described in our previous published article (Aghera and Bhatt 2019). For mutagenesis, germicidal lamp (20 W) was used for UV mutation of Aspergillus fumigatus PN12 (˜1 × 10⁻⁶ spores/mL). UV exposure was operated at a distance of 20 cm with short wavelength 254 nm. Treated spore were collected in sterile petri plate and it was exposed to UV light at the time interval of 3 min for 3-21 min. After UV irradiation to spores, 100-fold serial dilutions of potentially mutation-induced spores were plated to give 40 colonies or less per plate (Adeoye et al. 2015; Aghera and Bhatt 2019).
To begin the mutation process for Aspergillus fumigatus PN12, it was first subjected to UV radiation to develop its hyper-producing mutants for enhanced citric acid production. Then, in a dark room, the spore dilutions (0.1 mL) from UV treated mutants were spread onto PDA media containing 2% triton X-100 as colony restrictor. Untreated spores; also plated as control. All processes were carried out in strict aseptic conditions in laminar airflow. The selected mutants were cultured in submerged fermentation (SMF). Citric acid production process using a mutant was then optimized to enhance citric acid production by the mutant in SMF (Javed et al. 2010).

For the assessment of various process parameters such as nutritional and environmental values were optimized by one at a time. The experiments were conducted in a 250 mL flask containing 100 mL of wastewater (treated spent wash). After inoculation (fungi) maintain under following operational conditions; these were pH (4, 4.5, 5, 5.5, 6, and 6.5), temperature (25, 28, 30, 35, and 37 °C), (NH4)2SO4 concentration (0.05 to 0.3 g/L) and KH2PO4 concentration (0.05 to 0.3 g/L).
For the optimization of citric acid production, a statistical approach was considered. An optimization statistical method called as Response Surface Methodology (RSM) with Box Behnken design (BBD). This technique was employed to investigate the optimum conditions for microbial production of citric acid yield from post methanated wastewater using potent fungal culture Aspergillus fumigatus PN12. Four independent parameters namely pH, temperature, (NH4)2SO4 concentration (g/L), and KH2PO4 concentration (g/L) were employed for the study.
Each of the independent variables was studied at three different levels as per BBD in four variables with a total of 28 experiments (Table 2). Citric acid production corresponding to the combined effects of four components were studied in their specified ranges (Table 1). The parameters were chosen and their levels were based on preliminary optimization experiments carried out in our laboratory and as discussed above. The design was planned for performing an experiment in a laboratory using Design-Expert version 11.0 (Stat-Ease, Inc.) software (Aghera and Bhatt 2019).
To study the enzymatic activity, acotinase, NAD+ Isocitrate dehydrogenase and NADP+ Isocitrate dehydrogenase enzymes were studied as described our previous published article (Aghera and Bhatt 2019). For the determination of citric acid, sugar consumption and dry biomass, the citric acid concentration was estimated by pyridine-acetic anhydride method at 427 nm using a UV visible spectrophotometer and HPLC method. Sugar consumption and residual sugar was measured by using DNSA method. Dry cell mass was estimated by gravimetric analysis (Miller et al. 1959; Aghera and Bhatt 2019).
RESULTS AND DISCUSSION
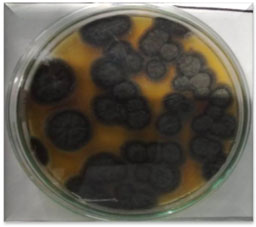
UV Mutagenesis: After UV mutagenesis of PN12 with different time intervals, the kill/survival curve was prepared and the time of exposure giving 0.04 × 10³ CFU/mL was selected (Figure 1). Mutant strain PN12 survived of growth still 21 min with exposed of UV light (Figure 2). Colonies that changed their color to blackish brown were picked from this plate and grown on slants for making a further selection. On the other hand, it was not showed results in chemical mutagenesis. Mutant colonies were changed their color greenish to brown color and user for further investigation (Abirami et al. 2018).
Figure 1: Survival / kill curve for UV treated PN12
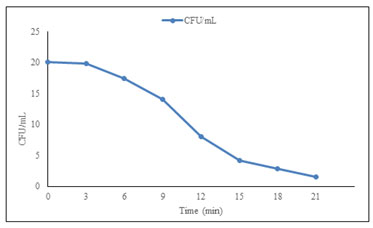
Figure 2: UV mutant strain PN12
Screening of mutation based on citric acid production: The selected mutants from UV exposure of PN12 were used for the high yield of citric acid in submerged fermentation. Mutant PN12 treated with UV (treated for 21 min) gave remarkable production of citric acid after 96 h. Citric acid production by the selected mutant could be further enhanced by the optimization of the submerged fermentation parameters. Javed et al. (2010) stated that all mutants showed better citric acid production when compared to the parent strain.
Our observations were in accordance with Abirami et al. (2018) said that the fermentation process was carried out by using three types of inoculum i.e., Aspergillus niger spores and mycelium and also mutated Aspergillus niger mycelium for citric acid production. The highest yield of citric acid (10g/100mL) was observed in the mutated mycelium with compared to the spores and normal mycelium (Javed et al. 2010; Abirami et al. 2018).
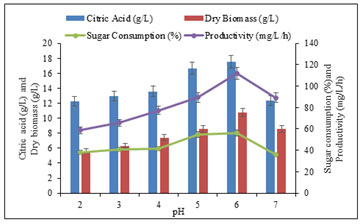
Optimization of environmental and nutritional parameters for citric acid production: Effect of pH on citric acid production: The hydrogen ion concentration influences citric acid production, therefore in this optimization study, the initial pH of the PMWW was varied from 2 to 7 (Figure 3). The production of citric acid was found to be maximum (17.52 ± 0.22 g/L), when the pH of the medium was maintained at 6.0. However, it was also noted that the medium amended with pH 6 consumed reducing sugar, (56 ± 0.8 %), produced dry biomass (10.74 ± 0.9 g/L/h), and maximum productivity (111.87 ± 0.3 mg/L/h) within 96 h. Mutant Aspergillus fumigatus PN12 exhibited good production in a narrow pH range from 5.0 to 6.0 with marked less productivity at pH up to 7.0.
The obtained results suggested that the change in pH affected the citric acid production. This may be related to the transport of the molecules across the membrane, which was considered a rate-limiting step for the citric acid production (Figure 3). The noted results were in accordance with the work of Emeka et al. (2012) who reported higher citric acid production by Aspergillus EGN003 at pH 5.5. However, the substrate used as a banana peel by Aspergillus niger MTCC 282 has been investigated to increase drastically under 3 to 5 ranges (Emeka et al. 2012; Abirami et al. 2018).
Figure 3: Effect of pH on citric acid production, consumed sugar and productivity
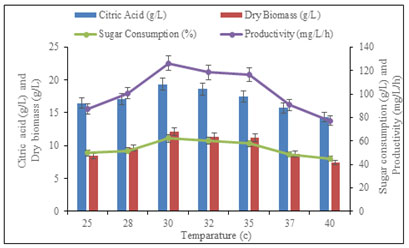
Effect of temperature on citric acid production: The selection of incubation temperature is guided by the optimum growth temperature of the culture. In the present investigation, the biosynthesis of citric acid by Aspergillus fumigatus PN12 determined at a different temperature range from 25 to 40 °C. The obtained results suggested that maximum citric acid production (19.36 ± 0.7 g/L), consumed reducing sugar (62.12 ± 0.55 %), produced dry biomass (12.12 ± 0.39 g/L/h) and maximum productivity (126.25 ± 0.21 mg/L/h) were observed at 30°C. Thus, the optimal temperature for citric acid biosynthesis and growth of the organisms were found to be the same as the organism has growth optima at 30 °C.
As the temperature was increased from 25 to 30 °C there was a gradual increase in the enzyme activity. However, with further up to 30 °C temperature there was a decrease in citric acid production (Figure 4). This study was supported by Ali et al. (2015) used arginine as a nutritional ingredient for citric acid production by A. ornatus at 30°C. In contrast, Xu et al. (2015) investigate the best production of citric acid at 37.5 °C from cassava and corn powder by A. niger (Emeka et al. 2012; Xu et al. 2015).
Figure 4: Effect of temperature on citric acid production,
consumed sugar and productivity
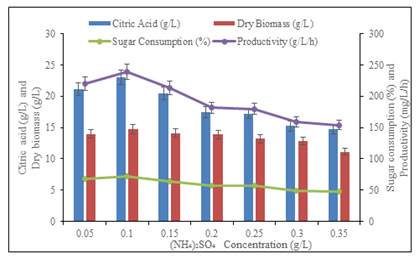
Effect of (NH4)2SO4 concentration on citric acid production: Fungal isolate Aspergillus fumigatus PN12 exhibited maximum production of citric acid when (NH4)2SO4 supplemented in the medium. In order to optimize the concentration of (NH4)2SO4 in the medium for maximum production, the extent of production was monitored at (NH4)2SO4 concentration varying from 0.05 to 0.35 g/L (Figure 5). However, increasing (NH4)2SO4 supplement in PMWW, the production efficiency of the culture increased proportionally and maximum citric acid production (22.98 ± 1.2 g/L), consumed reducing sugar, (72.43 ± 0.5 %), produced dry biomass (15.8 ± 0.17 g/L/h) and maximum productivity (164.58 ± 0.32 mg/L/h) was achieved with 0.1 g/L (NH4)2SO4 in 96 h.
Further increase in (NH4)2SO4 concentration in PMWW up to 0.1 g/L had no major effect on the production of citric acid. Based on the result observed, the citric acid production was significantly affected through fungal culture connected to the above or lower at 0.1 g/L of ammonium sulphate (Figure 5). The obtained results and findings are also similar to Max et al. (2010) they detected that lab-scale examination was supplemented by ammonia salt which was responsible for the decline in pH which gave a favorable fermentation process. Shankar et al. (2016) also reported NH4Cl as the best nitrogen source for enhancing the citric acid production using A. niger (Max et al. 2010; Shankar et al. 2016).
Figure 5: Effect of (NH4)2SO4 concentration on citric acid
production, consumed sugar, and productivity
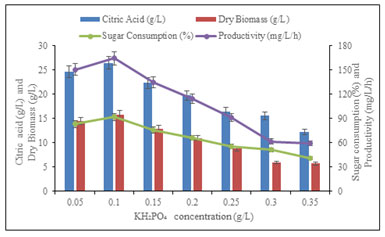
Effect of KH2PO4 concentration on citric acid production: Among different concentrations of KH2PO4 from 0.05 to 0.35 g/L tested in raw material as post methanated wastewater for citric acid production. It was noticed that maximum production of citric acid (26.45 ± 0.2 g/L) by mutant strain PN12, it was noted that the medium amended with 0.1 g/L KH2PO4 with consumed reducing sugar (91.60 ± 1.0 %), produced dry biomass (15.8 g/L/h) and maximum productivity (164.58 mg/L/h) of citric acid within 96 h.
However, we reached to the conclusion that the citric acid production was drastically changed by increased or decreased 0.1 g/L concentration of KH2PO4 (Figure 6). The observed results were similar to those previously carried out by Qurban et al. (2017) their work recommended that the restriction of phosphate might be absolutely affected on production of citric acid, while the high presence of phosphate could reduction in fixation of CO2 and responsible for the production of sugar acids (Qurban et al. 2017; Abirami et al. 2018).
Figure 6: Effect of concentration of KH2PO4 on citric acid
production, consumed sugar and productivity
Citric acid production by response surface methodology involving Box-Behnken design: The citric acid production was carried out by optimizing environmental and nutritional parameters viz. pH, temperature, (NH4)2SO4, and KH2PO4 at specified ranges as shown in (Table 1). The results of the 28 run BBD for citric acid production is shown in (Table 2).
Table 1. Coded and actual level of variables used in BBD for citric acid production.
| Variables | Symbol | Coded level of variables | ||
| -1 | 0 | 1 | ||
| Temperature (°C) | A | 28 | 30 | 32 |
| pH | B | 5 | 6 | 7 |
| (NH4)2SO4 concentration (g/L) | C | 0.05 | 0.1 | 0.15 |
| KH2PO4 concentration (g/L) | D | 0.05 | 0.1 | 0.15 |
The results of ANOVA are shown in (Table 3). The fitted second-order response surface model specified by Equation (1) for citric acid production in coded process variables was:
citric acid = +28.91 -0.7958 A+2.99 B+2.87 C+1.93 D -2.39 AB -1.51 AC -1.02 AD +0.3925 BC+1.38 BD +0.2300 CD -5.18 A² -7.73 B²-3.98 C² -9.38 D²
Where, Y was the predicted response, and A, B, C, and D were uncoded values of pH, temperature, (NH4)2SO4 concentration, and KH2PO4 concentration, respectively. For each run, the experimental responses along with the predicted response were calculated from the regression Equation (1).
Table 2. Box-Behnken design and results for optimization of citric acid production
| Run | A | B | C | D | Experimental value |
| 1 | 0 | -1 | -1 | 1 | 20.13 |
| 2 | 0 | 0 | -1 | 1 | 19.15 |
| 3 | 0 | 0 | 1 | 1 | 20.87 |
| 4 | 0 | 0 | 0 | 0 | 28.81 |
| 5 | 0 | 0 | -1 | -1 | 12.11 |
| 6 | 0 | 0 | 0 | -1 | 27.95 |
| 7 | 1 | 0 | 0 | 1 | 15.55 |
| 8 | 0 | 1 | 0 | 1 | 14.1 |
| 9 | -1 | 0 | 0 | 1 | 18.23 |
| 10 | 1 | -1 | 0 | 0 | 14.72 |
| 11 | -1 | -1 | 0 | 0 | 11.44 |
| 12 | 0 | -1 | 0 | -1 | 10.59 |
| 13 | 0 | 1 | -1 | 0 | 16.16 |
| 14 | -1 | 0 | -1 | 0 | 14.7 |
| 15 | 1 | 0 | 0 | -1 | 12.73 |
| 16 | -1 | 0 | 1 | 0 | 25.75 |
| 17 | -1 | 0 | 0 | -1 | 11.35 |
| 18 | 0 | -1 | -1 | 0 | 10.55 |
| 19 | 0 | 1 | 0 | -1 | 12.11 |
| 20 | 0 | -1 | 0 | 1 | 7.06 |
| 21 | 1 | 0 | 1 | 0 | 20.11 |
| 22 | 0 | 1 | 1 | 0 | 24.88 |
| 23 | 0 | 0 | -1 | 0 | 27.99 |
| 24 | 0 | 0 | -1 | -1 | 30.89 |
| 25 | 0 | -1 | 1 | 0 | 17.7 |
| 26 | -1 | 1 | 0 | 0 | 23.5 |
| 27 | 1 | 0 | -1 | 0 | 15.1 |
| 28 | 0 | 0 | 1 | -1 | 12.91 |
Table 3. Analysis of variance (ANOVA) for citric acid production: Individual and interactive effects of all four variables.
| Source | Sum of Squares | df | Mean Square | F-value | p-value | |
| Mean vs Total | 8723.34 | 1 | 8723.34 | |||
| Linear vs Mean | 258.60 | 4 | 64.65 | 1.71 | 0.1811 | |
| 2FI vs Linear | 44.58 | 6 | 7.43 | 0.1535 | 0.9857 | |
| Quadratic vs 2FI | 734.75 | 4 | 183.69 | 27.15 | < 0.0001 | Suggested |
| Cubic vs Quadratic | 72.49 | 8 | 9.06 | 2.93 | 0.1258 | Aliased |
| Residual | 15.46 | 5 | 3.09 | |||
| Total | 9849.23 | 28 | 351.76 |
The statistical analysis of experimental results suggested that the model was highly significant (p = < 0.0001) as shown in (Table 3). Fisher’s F’ and Student’s t-test were used for the testing of the analysis of the model. For the determination of the significance of the regression coefficient of variables, Student’s t-test was applied. p-values less than 0.0500 indicate model terms are significant. In this case pH, (NH4)2SO4, KH2PO4, temperature and temperature, pH and pH, (NH4)2SO4, and (NH4)2SO4, KH2PO4, and KH2PO4 were significant model terms.
A p-value of less than 0.05 indicated the test parameter was significant. The interaction effect among four variables was highly significant with p = < 0.0001. The model was significant, it was implied by Model F-value of 10.96. According to interaction effects were highly significant with p values less than 0.05. The expected R squared estimation of 0.358 was practically close with the adjusted R squared estimation of 0.484, which determined that the BBD configuration was in great concurrence with the observed and expected reaction (Abirami et al. 2018).
Interpretation of the model: The Figure representation provides a method to visualize the relationship between the experimental and response levels of each four variables and the type of interactions between test variables. (Figure 7) illustrates the variation in the citric acid production as a function of simultaneous change in the temperature (A, in Figure 7 indicated as A: temperature) and (B: pH in Figure 7 indicated as B: pH) whereas, temperature and pH were kept at the middle level of the range (at ‘0’ value).
Figure 7: 3D surface figure showing the interaction between temperature and pH
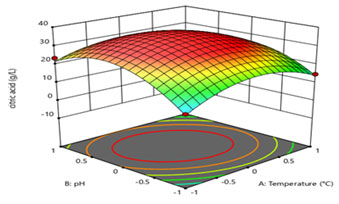
Figure 8: 3D surface figure showing interaction between temperature and (NH4)2SO4
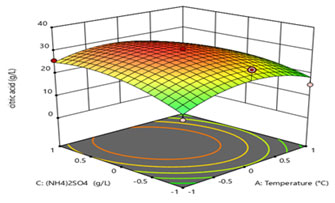
Figure 9: 3D surface figure showing interaction between temperature and KH2PO4
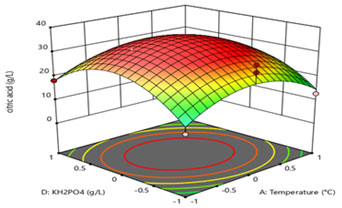
Figure 8 and 9 demonstrates the interactive effects of temperature (A in Figure 8 indicated as A: temperature) and (C, in Figure 8 indicated as C: (NH4)2SO4), and (A in Figure 9 indicated as A: temperature) and (D, in Figure 9 indicated as D: KH2PO4), respectively. Biological citric acid production highly varies in presence of nutrient components. Contour plot suggested that the level of temperature and pH should be kept at 0 levels (i.e., 30 °C and 6.0, respectively) while, (NH4)2SO4 and KH2PO4 concentration should be maintained at low level (0.05 g/L and 0.05 g/L, respectively) in process. The middle-level ranges of all four variables have shown optimum interactive effects on citric acid production as it can be illustrated from the contour plots.
(NH4)2SO4 and KH2PO4 is an important nutrient for the production of citric acid. In this study, high nutrient concentration did not allow the high citric acid production indicating the inhibitory effect of high nutrient content in the fermentation medium. Crolla et al. (2001) also studied the effect of nutrient concentration on citric acid production. They reported maximum citric acid production after 96 h of fermentation. The significant effect of KH2PO4 on citric acid production (Crolla et al. 2001; Hyder et al. 2011; Aghera et al. 2019).
Enzymatic study: To determine the biological perceptive for guideline of citric acid synthesis, Specific exercises of aconitase, NAD+ isocitrate dehydrogenase and NADP+ isocitrate dehydrogenase were concentrated from UV treated Aspergillus fumigatus PN12 regarding citric acid synthesis. The acceptance of different compounds during the citrus extract beneficial system likewise strengthens the active job of microorganisms in the produced cycle. As introduced in (Table 3.5) specific action of aconitase in high citric acid producing strains of A. fumigatus during the evolution time of 96 h.
It is seen that the action level of aconitase in PN12 is reliably higher all through the whole time of aging. Aghera et al. (2019) investigated that aconitase activity high during citric acid fermentation utilizing A. fumigatus PN12. NAD+ isocitrate dehydrogenase and NADP+ isocitrate dehydrogenase displayed nearly less specific activity. That likewise during citric acid fermentation high and brings down just as, the amount of aconitase, NAD+ isocitrate dehydrogenase, and NADP+-isocitrate dehydrogenase was essentially expanded and decreased (Aghera et al. 2019).
Table 4: The Effect on specific activities (U/mg protein) in A. fumigatus
| Enzymes | 12h | 24h | 48h | 72h | 96h | 120h |
|
Acotinase |
1.01±0.09 | 1.64±0.12 | 2.21±0.19 | 2.80±0.08 | 3.19±0.023 | 2.54±0.01 |
| NAD+ Isocitrate dehydrogenase | 0.86±0.02 | 1.56±0.06 | 1.89±0.15 | 2.50±0.23 | 3.0±0.15 | 2.34±0.10 |
| NADP+ Isocitrate dehydrogenase | 0.95±0.11 | 1.35±0.03 | 1.75±0.01 | 2.27±0.05 | 2.91±0.17 | 2.48±0.19 |
CONCLUSION
The findings of the present study suggests that the citric acid is an industrially important molecule which play an important role in preprocessing, bioremediation, and brewing industries. It is a natural preservative and is also used to add an acidic (sour) taste to food and soft drinks. This study investigated on an environmentally friendly and economic approach to produce citric acid from wastewater. Mutant strain was the survive and of growth was observed till 21 min with exposer of UV. The process optimization through the statistical approach resulted in a 1.16-fold enhancement in citric acid production as compared to that of the OFAT conditions. Thus, produced citric acid by the collective action of citrate formation enzymes where A. Fumigatus PN12 playing their significant role in citric acid fermentation.
ACKNOWLEDGEMENTS
This study was financially supported by the Gujarat Biotechnology Research Center (GBRC). Authors thank the institute for the culture identification and Dr Jyoti Vivecha for the statistical study.
Conflict of Interests: Authors declare no conflicts of interests to disclose.
Data Availability Statement: The database generated and /or analysed during the current study are not publicly available due to privacy, but are available from the corresponding author on reasonable request.
REFERENCES
Abirami, S. Revathi, P. Selva, A and Kannan, M. (2018). Random UV Mutagenesis Stimulated over Production of Citric Acid by Aspergillus niger. International Journal of Recent Research Aspects. 316-324.
Aboyeji, O., O. Oloke, J. K. Arinkoola, A. O. Oke, M. A and Ishola, M. M. (2020). Optimization of media components and fermentation conditions for citric acid production from sweet potato peel starch hydrolysate by Aspergillus niger. Scientific African. 10: 00554.
Adeoye, A. Lateef, A and Gueguimkana, E. (2015). Optimization of citric acid production using a mutant strain of Aspergillus niger on cassava peel Substrate. Biocatalysis and Agricultural Biotechnology. 15:1878-8181.
Aghera, P and Bhatt, N. (2019). Biosynthesis of citric acid using distillery spent wash as a novel substrate. Journal of pure and applied microbiology, 13(1): 599-607.
Alhadithy, D., A. Yasin, S. R and Ali, J. R. (2020). Optimum conditions for citric acid production from local Aspergillus niger S11 isolate by submerged fermentation. Tropical Medicine and Public Health. 23 (19).
Ali, S. Anwar, Z. Irshad, M. Mukhtar, S and Warraich. (2015). Bio-synthesis of citric acid from single and co-culture-based fermentation technology using agro-wastes. Journal of Radiation Research and Applied Sciences: 1-6.
Ayeni, A., O. Daramola, M. O. Taiwo, O. Olanrewaju, O. I. Oyekunle, D. T. Sekoai, P. T and Elehinaf, F. B. (2020). Production of Citric Acid from the Fermentation of Pineapple Waste by Aspergillus niger. The Open Chemical Engineering Journal. 19: 1874-1231.
Crolla, A and Kennedy, K. J. (2001). Optimization of citric acid production from Candida lipolytica Y-1095 using n-paraffin. Journal Biotechnology. 89(1):27–40.
Gupta, S and Sharma, C. (2002). Biochemical studies of citric acid production and accumulation. World Journal of Microbiology and Biotechnology. 18: 379–383.
Javed, S. Asgher, M. Sheikh, M and Haq Nawaz (2010). In:Strain Improvement Through UV and Chemical Mutagenesis for Enhanced Citric Acid Production in Molasses-Based Solid State Fermentation, Food Biotechnology. 24(2):165-179.
Hyder, Q. Ali, M and Zulkali, M. (2011). Statistical optimization of media components to enhance citric acid production from paddy straw using solid state fermentation. Journal of food Science Technology. 3(1): 1-8.
Max, B. Salgado, M. Rodriquze, N and Cortes, S. (2010). Biotechnological production of citric acid. Brazilian Journal of Microbiology. 41(4): 862-875.
Miller, L. G. (1959). Use of dinitrosalicylic acid reagent for determination of reducing sugar. Analytical Chemistry, 31(3): 426-428.
Nwoba Emeka, G. Ogbonna James, C. Ominyi Matthias, C. Nwagu Kingsley, E and Gibson-Umeh, G. (2012). isolation of citric acid-producing fungi and optimization of citric acid production by selected isolates. Global Journal of Bio science and Biotechnology. 1 (2): 261-270.
Prasad, D. SurendraBabu, V. Sridevi, V. Reddy, S and Prakasam, S. (2014). Response surface methodology for optimization of sorghum malt media for citric acid production by improved strains of Aspergillus niger. International Journal of Advanced Research. 2(1):498-507.
Qurban, H. Mohamed, M and Azzawi, Z. (2012) Economic benefit from the optimization of citric acid production from rice straw through Plackett-Burman design and central composite design. Turkish Journal of Engineering and Environmental Science. 36: 81 -93.
Shankar, T and Sivakumar, T. (2016). Optimization of Citric Acid Production Using Aspergillus niger Isolated from the Leaf Litter Soil of Sathuragiri Hills. Universal Journal of Microbiology Research. 4(4): 79-87.
Sun, X. Lu, H and Wang, J. (2017). Recovery of citric acid from fermented liquid by bipolar membrane electro dialysis. Journal of Cleaner Production. 9:1-7.
Xu, J. Chen, y. Zhang, H. Bao, J. Tang, L. Wang, K. Zhang, J. Chen, X and Mao, Z. (2015). Establishment and assessment of an integrated citric acid–methane production process. Bioresource Technology. 176:121–128.


