Faculty of Computing and Information Technology, King Abdul Aziz University, Jeddah, Saudi Arabia
Corresponding author Email: maaabdullah@kau.edu.sa
Article Publishing History
Received: 01/11/2018
Accepted After Revision: 29/12/2018
Coping with the high rate of business environment or gaining competitive advantages and customer satisfaction are mainly based on organizational resources, especially an employee. Employees with low performance cause a vital lose for organizations and the absenteeism consider to be one of the factors that affect performance So, understanding the causes of absenteeism may power the organization with a competitive advantages tool and open the area of research for computer and human resources fields. The aim of this paper is to discover the factors and causes of employees absence using computerized technologies. The research conducts data analysis on the absentee database and finds some factors that have a good correlation with absenteeism. Moreover, three prediction models are built: Naïve Bayes, Decision Tree, and Random Forest. These models discovered the factors and predict the absenteeism with high accuracy. The Random Forest is the best with an accuracy of 92% while the Naïve Bayes is the second followed by the Decision Tree model with an accuracy of 91% and 90% respectively.
Absenteeism, Classification, Prediction, Decision Tree, Naïve Bayes, Random Forest, Employee Attributes, Management, Human Resource.
Asiri A, Abdullah M. Employees Absenteeism Factors Based on Data Analysis and Classification. Biosc.Biotech.Res.Comm. VOL 12 NO1 (Spl Issue February) 2019.
Asiri A, Abdullah M. Employees Absenteeism Factors Based on Data Analysis and Classification. Biosc.Biotech.Res.Comm. VOL 12 NO1 (Spl Issue February) 2019. Available from: https://bit.ly/2XLQrur
Introduction
Recently, most of the organizations race to reduce expenses, increase productivity, catch the opportunity and meet customer satisfaction. In order to gain the race, the organizations should manage the factors that affect their performance. The main factor that has a direct effect on the organization’s performance is the human resource. The presence of employees means the planned workflow is performed as expected. It also means a reduction in the costs of management and supervision, overtime, additional workers and the penalty clause. By contrast, the absence of an employee leads to the exact opposite.
Currently, organizations are seeking to find the main causes behind absence. This subject has been studied before decades form a different perspective. However, the statistical methods are the most common methods for analyzing data and finding direct relationships.
This paper focus on extracting the relationship between the general information about the employees, which stored in the organization database, and the reasons for the absence to predict their absenteeism ratio. By finding the relationship, the organization gains a highly competitive advantage tool that could be used to address the consequences of the employees’ absence and help human resources management to improve the process of recruitment and crisis management.
In this paper, the statistical methods are used to understand the database and then find some absenteeism factors. Moreover, according to the type of data understudying, the most suitable technique is chosen, therefore the classification technique is used since the factors of absenteeism are categorical data. So, prediction models, based on classification, are built to uncover other factors that might have indirect causes in the absence.
Classification is a technique that can be done on different types of data, structured or unstructured. It is a process for categorizing the input data into a number of predefined classes. The objective of the classification technique is to identify and predict the class of the new data based on extraction rules from the previous data. It is one of the supervised machine learning techniques. Machine Learning is “the process of learning a set of rules from instances, for examples in a training set, which means, creating a classifier that can be used to generalize from new instances (Kotsiantis, 2007). Depending on how classifier is created, the classification algorithm, there are different types of classification techniques, such as: Naïve Bayes, K-Nearest Neighbor, Decision Tree, and Random forest.
The paper provides a brief background of the employees’ absenteeism and presents some related works in section 2. Section 3 describes and illustrates the methodology of this research with four stages: data preprocessing, processed databases, prediction models, and results and decision. Finally, section 4 concludes the paper.
Literature Review
The absenteeism studies were considered to be one the management filed researches. However, as a result of technological development, these studies are being conducted using computerized concepts. In this section, the background and the related work of the absenteeism studies are presented.
Background
The employees have a significant role in any business. Organizational performance and success, competitive advantages and customer satisfaction are mainly determined by the employees’ performance and human resource management [HR] (Binter et al., 1990) (Nickson et al., 2003) (Schneider et al., 2003). The crucial role of HR has been studied in ‘management literature’ via models, theories, and empirical studies. Managing the employees’ absenteeism consider being one of the most vital issues for HR managers to deal with. Absenteeism is defined as “a temporary absence from work (temporary withdrawal from an organization) for reasons such as illness, death in the family, or other personal issues” (Mathis and Jackson, 2008). It is also defined as “an employee’s intentional or habitual absence from work” (Cucchiella et.al., 2014).
Excessive absence can seriously affect any organization and it might lead to high direct and indirect costs and low productivity (Mathis and Jackson 2008) (Cikeš et.al., 2018). For example, in Tayler and Qi (2013) research, there is a loss of 3% of scheduled labor hours caused by unplanned absence. Moreover, many types of research have concluded that the low performance and high absenteeism of an employee gives an early indication for a turnover situation. Although it is a negative indicator, it could help business organizations and HR to search for more qualified alternatives before it occurs (Cohen and Golan, 2007) (Morrow et al., 1999).
So, understanding the employees’ absence depending on the process of extracting meaningful information from the available data and information to help organizations to manage their business is known as knowledge management [KM]. KM is the new concepts that will lead the organizations into a new area or opportunities and advantages by combining the individuals’ knowledge and effort with the capabilities of the new technologies (Becerra and Sabherwal, 2010). This research depends on the concept of KM to improve the organization management by understanding the absenteeism factors depending on the available data and information.
Related Work
In this research, the related work illustrates three stages of absenteeism studies. The first stage was for the early studies that focus on understanding absenteeism factors form administrative or social perspective or as a behavioral study. The computational method was used in the second stage while the computerized and machine learning technologies are used in the current stage, the last one.
Five decades from now, there were intensive researches to discover the absence behavior. In 1970, “the systematization of absenteeism causes and consequences” was the first significant paper (Muchinsky, 1977). In this paper, Muchinsky describes the relationship between absenteeism and personal, organizational and attitudinal variables. In addition, Muchinsky also studies the relationship between absenteeism and turnover. Moreover, many types of research have been conducted from that time until now, but most of them were conducted from an administrative or social perspective or as a behavioral study and resulted in a recommendation for improvement (Rhodes and Steers, 1981) (Harrison and Martocchio, 1998) (Cikeš et.al., 2018).
However, there was a use of computational methods to understand the relationship between absenteeism factors. For example, Tayler and Qi (2013) used Poisson regression to discover different factors of unplanned absences in rail dispatcher scheduling and resulted that the unplanned absences are estimated to cause a loss of 3% of scheduled work hours, which are used as statistical evidence. In addition, absenteeism studies have been criticized for using unsuitable analysis as many researchers used regression and correlation models and changed the data to suit the requirements of these models (Sturman, 1996). However, new studies use different models to understand absenteeism. For example, classification models provide more insight into the factors and causes of absenteeism even if they do not have a direct relationship.
Recently, Martiniano et al. (2016) used multilayer perceptron for absenteeism prediction, the proposed method was published while the results are not yet released. In this paper, following the new trend of studies in this field, three prediction models are built based on the concepts of classification and how can indirect factor affect the prediction model.
Discovering Employee Absenteeism Methodology
Employees’ absenteeism has been studied widely from a managerial perspective. However, the methodology of this paper follows a systematic approach of data analysis and uses classification to understand the factors behind the absenteeism. Discovering the factors affecting employee absenteeism methodology consists of four stages as shown in figure 1. They are: preprocessing data, developing the processed databases, conducting prediction models, deciding on which classifier is the most accurate and appropriate.
 |
Figure 1: Methodology of Discovering the Hidden Factors of Absenteeism |
Before working on the data set, it is important to describe data used in this research. It is a dataset of absenteeism of ‘A Courier Company’ in Brazil which was recorded from July 2007 to July 2010. It has 21 attributes and 740 instances (Martiniano et al. 2016). Table 1, shows the attributes and their description.
| Table 1: Absenteeism Dataset | |
| Attribute | Description |
| 1. ID | Individual identification |
| 2. Reason for absence (ICD). | Absences attested by the International Code |
| of Diseases (ICD) stratified into 21 categories | |
| (1-21), and 7 categories without (CID), | |
| 3. Month of absence | 1-12 represent real months |
| 4. Day of the week | Monday (2), Tuesday (3), Wednesday (4), |
| Thursday (5), Friday (6) | |
| 5. Seasons | 1-4 represent seasons restively |
| 6. Transportation expense | Integers |
| 7. Distance from Residence to Work | In kilometers |
| 8. Service time | In hours |
| 9. Age | Integers |
| 10. Work load Average/day | In hours |
| 11. Hit target | Integers |
| 12. Disciplinary failure | (yes=1; no=0) |
| 13. Education | high school (1), graduate (2), postgraduate |
| (3), master and doctor (4) | |
| 14. Son | Number of children |
| 15. Social drinker | (yes=1; no=0) |
| 16. Social smoker | (yes=1; no=0) |
| 17. Pet | number of pets |
| 18. Weight | Integers |
| 19. Height | Integers |
| 20. Body mass index | Integers |
| 21. Absenteeism time in hours (target) | In hours |
In this methodology, the work starts with preprocessing the absenteeism database by grouping some type of attributes and studying the correlation between the attributes and the absenteeism to find the significant causes of absenteeism.
After that, two databases will be used in the prediction models: the base database and the reduced one. For the base dataset, choosing the best classifier depends on the one with high accuracy. However, in the reduced database, to reach an accepted accuracy, the database is modified by adding an additional attribute, one at a time, even if there is no correlation between it and absenteeism. The process of adding the attribute discovers some factors of absenteeism which could not be known via regular data analysis such as correlation or regression.
Preprocessing Data
In any study, the quality of the data has a direct effect on the results, following the concept of ‘garbage in garbage out [GIGO]’ which describes: “the concept that flawed, or nonsense input data produces nonsense output” (Web-1). So, this process is the most significant part of this paper. In order to build a suitable prediction model, the database should be understood and studied carefully to get more insight about it and perform meaningful modifications.
In order to understand the database and choose the most significant attributes that affect the absenteeism, the relationship between the attributes and the importance of each one should be understated. Therefore, the ‘Statistical Package for the Social Sciences’ (SPSS) is used to discover and modify the database, as it is considered to be a good software to perform data analysis work and deal with format databases (Web-2) Two processes are performed on the database to be ready to use in the next stage: grouping and correlations.
Data Grouping
In this section, some of the database’s attributes are not in a format that can be used directly into ML.
to overcome that, data grouping is used.
Transportation Expense and Distance to the Work attributes are presented in real numbers, their ranges are very big, instead of dealing with them as numbers, they could be categorized into groups, intervals. From figure 2, it is clear that ‘Transportation Expense’ can be classified into three groups [100,200], [200,300] and [>300]. In addition, the same process is done with ‘Distance to the Work’ and the categories are [0-20], [21,40] and [>40], as shown in figure 3 and figure 4 while the new categories is shown in figure 5.
 |
Figure 2: Transportation Expanse_ Frequency |
 |
Figure 3: Distance from Resident to Work_ Frequency |
 |
Figure 4: Grouped Transportation Expanse |
 |
Figure 5: Grouped Distance form Resident to Work |
In Addition, Ages are varied from 27 -the minimum- to 58 – the maximum. According to figure 6, it is obvious that the ages could be classified into 3 categories [25-35] [35-45] [>45]. Form the pie chart in figure 7 almost 50% of absence comes from employees who are between 35 and 45 years old.
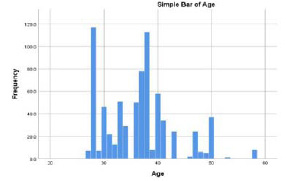 |
Figure 6: Age Frequency |
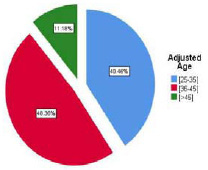 |
Figure 7: Grouped Age |
Moreover, BMI attribute was provided in kilograms, which include a very long range of meaningless data. To overcome this, the data are modified according to the International formula for defining BMI (Web-3):
Underweight = <18.5 Normal weight = 18.5–24.9 Overweight = 25–29.9 Obesity >= 30
The pie chart in figure 8 presents the grouped BMI which provides more meaningful information and indicate that 64% of absent employees are obese or overweight.
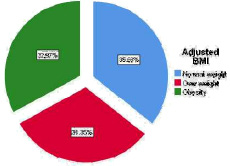 |
Figure 8: Grouped BMI |
Finally, in the original database, the range of the absenteeism in hour attribute starts from zero to 120, as this attribute will be the predicted one, the range should be minimized to include fewer classes. With respect to the frequencies of the absenteeism times, almost 6% of data represents 0, where the major frequency with 85% lies between 1-0, leaving just 9% to represents all the absence time more than 10. As a result, this attribute could be classified into three categories [0], [1-10], and [>10], as shown in figure 9.
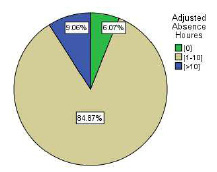 |
Figure 9: Grouped Absenteeism Hours |
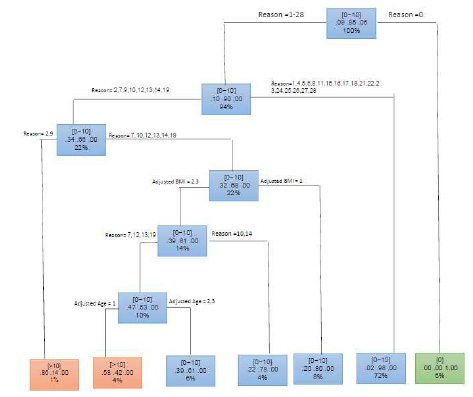 |
Figure 10: Decision Tree Model |
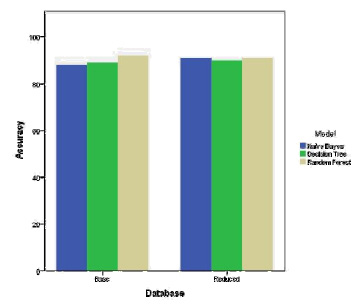 |
Figure 11: Results of Prediction Models |
Correlations
Understanding the relationship between the attributes appears more insight and information about the dataset. To discover these relations, correlation is used. it is “a statistical measure that indicates the extent to which two or more variables fluctuate together. A positive correlation indicates the extent to which those variables increase or decrease in parallel; a negative correlation indicates the extent to which one variable increases as the other decreases” (Larson and Farber, 2015).
The database is analyzed using correlation to discover the most significant attributes that affect the absenteeism, as table 2 shows these attributes with the correlation values and at which significant level. It is obvious that the correlation between most of the attributes is positive. However, the surprising information here shows that the correlation between absenteeism and ‘Distance form Work’ is negative.
Processed Databases
The third stage of the methodology is to prepare the processed databases. There are two databases that are used for the next stage. The first database is ‘Base Database’, which consists of all the attributes of the main database but processed version. The second database ‘Reduced Database’, which contains the attributes that have a strong correlation with absenteeism attribute as shown in table 2.
| Table 2: Correlation between Absenteeism and Attributes | ||
| Attribute | Correlation | Level of Significant |
| Distance from work | -0.071 | 0.05 |
| Age | 0.063 | |
| Son | 0.105 | |
| Social Drinker | 0.082 | 0.01 |
| Hight | 0.126 | |
Prediction Models
There are some insights about the employees absenteeism causes and factors are exposed during the preprocessing process in the previous section. However, to get more insights and discover hidden relationships, three classification prediction models are built: Naïve Bayes, Decision Tree, and Random Forest, where they have good performance with categorical data. The R language is used, as it is one of the most popular and efficient languages for data science and has the flexibility to deal with different topics by providing supported packages (Web-4). The base and reduced databases are used and divided into 75% training data and 25% testing data.
Naïve Bayes
It is the simplest classification methods which required low computational time. The model is run to classify the database into three classes [0], [1-10] or [>10], the result of this model using two databases is shown in table 3.
| Table 3: Naïve Bayes Results | |||||
| Database | Accuracy | Sensitivity | Specificity | ||
| The Base | 0.88 | [0] | 1.00000 | [0] | 0.98974 |
| [1-10] | 0.9489 | [1-10] | 0.5938 | ||
| [>10] | 0.31579 | [>10] | 0.96296 | ||
| The Reduced | 0.91 | [0] | 1.00000 | [0] | 1.00000 |
| [1-10] | 0.9943 | [1-10] | 0.4375 | ||
| [>10] | 0.052632 | [>10] | 0.994709 | ||
Decision Tree
It is generally used in ML applications especially with the categorical data type. It is a tree where nodes represent an event while the leaves represent the decisions. A decision tree recursively divided the predictor factor to represent the relation between the predictor variable and the responses variable. As decision tree has a -build in- attribute selection, which known as ‘information gain’, the most homogeneous set of attributes and ranks are discovered via constructing decision tree as shown in figure 10. The result of this model is presented in table 4.
| Table 4: Decision Tree Result | |||||
| Database | Accuracy | Sensitivity | Specificity | ||
| The Base | 0.89 | [0] | 1.00000 | [0] | 1.00000 |
| [1-10] | 0.9636 | [1-10] | 0.5750 | ||
| [>10] | 0.29167 | [>10] | 0.96610 | ||
| The Reduced | 0.90 | [0] | 1.00000 | [0] | 1.00000 |
| [1-10] | 0.9909 | [1-10] | 0.4500 | ||
| [>10] | 0.083333 | [>10] | 0.991525 | ||
Random Forest
It’s concept based on creating large numbers of decision trees. Every observation is fed into every decision tree. The most common outcome for each observation is used as the final output. 500 classification trees are used in the Random Forest model. The result is presented in table 5.
| Table 5: Random Forest Result | |||||
| Database | Accuracy | Sensitivity | Specificity | ||
| The Base | 0.92 | [0] | 0.93750 | [0] | 1.00000 |
| [1-10] | 0.9864 | [1-10] | 0.5750 | ||
| [>10] | 0.33333 | [>10] | 0.98729 | ||
| The Reduced | 0.91 | [0] | 1.00000 | [0] | 1.00000 |
| [1-10] | 0.9682 | [1-10] | 0.5500 | ||
| [>10] | 0.25000 | [>10] | 0.97034 | ||
Results and Decision
The last stage of the methodology is to investigate the results that come from the prediction models and decide which model has the best performance. Figure 11 shows the results of the three prediction models using the two databases. It is clear that the three models have almost high accuracy and the random forest provides the highest accuracy with 92% using the base database and it is the one that can be chosen to predict the absenteeism of the employees.
However, this research tends also to know the factors of absenteeism not only to predict it, so, when using the decision tree model with the reduced database, the resulted tree, as shown in figure 10 presented some attributes that did not have a high correlation with absenteeism and some of the highly correlated attributes are discarded. As a result, the prediction models provide not only prediction benefit but also can be used to discover some relation between the data where the regular statistical methods cannot discover it.
Conclusion
Predicting the causes behind the employees’ absence has a crucial impact on the efficiency of Human Resource Management. However, most of the current studies focused on statistical methods, such as correlation and regression. Nevertheless, the results of the prediction models lead to discovering the gaps in the statistical approaches and how the results of these approaches give narrow and incomplete information.
Despite of the relationship between the attributes in the reduced database, as this database includes only the attributes that have a good correlation with the prediction attribute, the models’ performance is high with the base database, which contain all the attributes and with after adding additional attributes to the reduced database, as what happened in the decision tree model. Consequently, it is obvious that there are hidden factors that affect the absence even if they do not have a direct relationship with absenteeism. Table 6 shows that the random forest model excesses the other models by having an accuracy of 0.92 % by using the base
database.
It is better for management, especially the Human Resources Department, to design an employees’ database that includes as much descriptive data as possible about the staff, since the hidden causes of absence could be predicted via these data. As a result, absenteeism can be avoided before it occurs, or the prediction values can be used as an effective tool for crisis management. Moreover, these hidden causes of absenteeism could be used by the organizations to set additional requirements for a new job. Therefore, the percentage of the absence could be decreased.
Using the computerized approaches to discovering information and knowledge from the data such as machine learning techniques consider to be a rich field for researcher especially for human resources management.
References
- Becerra-Fernandez, Irma, and Rajiv Sabherwal. 2010. Knowledge Management: Systems and Processes. Armonk, N.Y: M.E. Sharpe.
- Binter, Marry Jo, Bernard Booms, and Marry Stanfiled. 1990. ‘The Service Encounter: Diagnosing Favorable and Unfavorable Incidents’. The Journal of Marketing, 71–84.
- Cikeš, Vedrana, Helga Maškarin Ribaric´, and Kristinacˇrnjar. 2018. ‘The Determinants and Outcomes of Absence Behavior: A Systematic Literature Review’. Social Sciences 7 (8): 120. https://doi.org/10.3390/socsci7080120.
- Cohen, Aaron, and Ronit Golan. 2007. ‘Predicting Absenteeism and Turnover Intentions by Past Absenteeism and Work Attitudes: An Empirical Examination of Female Employees in Long Term Nursing Care Facilities’. Career Development International 12 (5): 416–32. https://doi.org/10.1108/13620430710773745.
- Cucchiella, Federica, Massimo Gastaldi, and Luigi Ranieri. 2014. ‘Managing Absenteeism in the Workplace: The Case of an Italian Multiutility Company’. Procedia – Social and Behavioral Sciences 150 (September): 1157–66. https://doi.org/10.1016/j.sbspro.2014.09.131.
- Harrison, David A., and Joseph J. Martocchio. 1998. ‘Time for Absenteeism: A 20-Year Review of Origins, Offshoots, and Outcomes’. Journal of Management 24 (3): 305–50. https://doi.org/10.1177/014920639802400303.
- Jensen, Taylor and Sun, Qi. 2013. Absenteeism Prediction and Labor Force Optimization in Rail Dispatcher Scheduling.
- Kotsiantis, S B. 2007. ‘Supervised Machine Learning: A Review of Classification Techniques’, 20.
- Larson, Ron, and Elizabeth Farber. 2015. Elementary Statistics: Picturing the World. 6th edition. Boston: Pearson.
- Martiniano, A, R P Ferreira, R J Sassi, and C Affonso. 2016. ‘Application of a neuro fuzzy network in prediction of absenteeism at work’, 4.
- Mathis, Robert L., and John Harold Jackson. 2008. Human Resource Management. 12th ed. Mason, OH: Thomson/South-western.
- Morrow, Paula C., James C. McElroy, Kathleen S. Laczniak, and James B. Fenton. 1999. ‘Using Absenteeism and Performance to Predict Employee Turnover: Early Detection through Company Records’. Journal of Vocational Behavior 55 (3): 358–74. https://doi.org/10.1006/jvbe.1999.1687.
- Muchinsky, Paul M. 1977. ‘Employee Absenteeism: A Review of the Literature’. Journal of Vocational Behavior 10 (3): 316–40. https://doi.org/10.1016/0001-8791(77) 90066-5.
- Nickson, Dennis, Tom Baum, Erwin Losekoot, and Alison Morrison. 2003. ‘Skills, Organizational Performance And Economic Activity In The Hospitality Industry: A Literature Review’, 109.
- Rhodes, Susan, and Steers, Richard. 1981. A Systematic Approach to Diagnosing Employee Absenteeism, Employee Relations, Vol. 3 Issue: 2, pp.17-22.
- Schneider, Benjamin, Ellen G. Godfrey, Seth C Hayes, Mina Huang, Beng-Chong Lim, Lisa H Nishii, Jana L Raver, and Jonathan C Ziegert. 2003. ‘The Human Side of Strategy’: Organizational Dynamics 32 (2): 122–41. https://doi.org/10.1016/S0090-2616(03)00014-7.
- Sturman, Michael C. 1996. ‘Multiple Approaches to Absenteeism Analysis’, 32.

