Edwin A. Pithawala1*![]() and Nayan K. Jain2
and Nayan K. Jain2
1Department of Microbiology, Khyati Institute of Science, Ahmedabad, India
2Department of Life Sciences, School of Sciences, Gujarat University, Ahmedabad, India
Corresponding author email: edwinpithawala@gmail.com
Article Publishing History
Received: 13/04/2020
Accepted After Revision: 30/05/2020
Melanins are natural pigments distributed in living organisms and they are responsible for pigmentation of surface structure. The present work emphasis the complex relative dielectric function ɛ*(ω) = ɛ’-jɛ” of bacterial Pannonibacter phragmitetus [EP83], water soluble melanin and 80 Ώ milli Q water at varying concentrations viz. 0, 25, 50, 75, 100 µg/mL have been measured using LCR meter in the frequency range 20 Hz to 2MHz at various temperature ranges of 95, 98.6, 102.2, 105.8, 109.4 and 113 K i.e. a temperature range between 35 to 45 ˚C with a difference of 2˚C. The electric/dielectric properties of the melanin sample in milli Q water was represented in terms of intensive quantities namely, complex relative dielectric function ε*(ω), electric modulus M*(ω), electrical conductivity σ*(ω) and extensive quantities like complex admittance Y*(ω) and complex impedance Z*(ω). All of these presentations are used to explore various processes contributed in the electrical/dielectric properties of the melanin in pure state of water so that it may give a direct idea and influence of melanin in cellular system when incorporated or induced with. Result so obtained in the selected temperature ranges makes the base line for the influence of the extracted Pannonibacter phragmitetus [EP83] melanin in the cellular system. This may shed a new horizon in the pharmaceutical sciences for the cosmetic allegiance of a skin and also would be made employed for a treatment of leucoderma or for the development of the cosmetic product with dielectric/electric based mode of actions. Further aspects of this implication are under study and focused to increase the application part of Pannonibacter phragmitetus [EP83] water soluble melanin.
Complex permittivity, electric modulus, complex impedance, precision LCR meter, water soluble melanin, Pannonibacter phragmitetus [EP83].
Pithawala E. A, Jain N. K. Dielectric and Electrical Properties of Water-Soluble Bacterial Melanin Extracted from Pannonibacter phragmitetus [EP83] at Optimum Temperature Range. Biosc.Biotech.Res.Comm. 2020;13(2).
Pithawala E. A, Jain N. K. Dielectric and Electrical Properties of Water-Soluble Bacterial Melanin Extracted from Pannonibacter phragmitetus [EP83] at Optimum Temperature Range. Biosc.Biotech.Res.Comm. 2020;13(2). Available from: https://bit.ly/37bCQii
Copyright © Pithawala and Jain This is an open access article distributed under the terms of the Creative Commons Attribution License (CC-BY) https://creativecommns.org/licenses/by/4.0/, which permits unrestricted use distribution and reproduction in any medium, provide the original author and source are credited.
INTRODUCTION
Melanins are amorphous, irregular polymeric pigments distributed in living organisms and they are responsible for the pigmentation of surface structure (Crippa and Michelini, 1999; Mosca et al., 1998; Riley, 1997; Bilinsk, 1996; Rosei and Mosca, 1996; Prota, 1992; Crippa et al., 1989; Miyake et al., 1986). The basic chemical structure of melanin is not well defined but it is usually represented by covalently linked models. Melanin synthesis is produced either by auto-oxidation of catechola or by the tyrosin action on the enzyme tyrosinase.
Melanins are synthesized from tyrosine by hydroxylation to dihydroxyphenylalanine (DOPA) and subsequent oxidation to dopaquinone, both reactions are catalyzed by the enzyme tyrosinase, (Rile, 1997; Rosei and Mosca, 1995; Rosei and Mosca, 1996; Blarzino et al., 1999,Hutchinson et al., 2019).
Several investigations have been devoted to characterize their physical and chemical properties, such as its higher molecular weight, insolubility in water and common organic solvents, specific heat, carrier mobility, electrical conductivity, redox, chelating, and photo protective action (Crippa and Michelini, 1999; Mosca et al., 1998; Riley, 1997; Bilinsk, 1996; Rosei and Mosca, 1996; Prota, 1992; Crippa et al., 1989; Miyake et al., 1986; Harki et al., 1997; Blarzino et al., 1999; Rosei and Mosca, 1995; Kollias et al., 1991; Saran, 1992; Krol and Liebler, 1998; Yong-gang et al., 2009; Hengshan et al., 2006; Mejia-Caballero et al., 2016 Maranduca et al., 2019 ).
However, the molecular mechanism of melanin at cellular and sub-cellular level is not yet fully explained by the biophysical and biochemical studies (Crippa and Michelini, 1999; kollias et al., 1991; Saran, 1992). Dielectric properties of biological materials have been previously investigated (Ghannam et al., 2002; Foster and Schwan, 1995; Subrata, 1992; Grant et al., 1978). It has been established that the direct current (DC) conductivity of 3, 4-dihydroxyphenylalanine (DOPA) melanin is strongly dependent on the water content in the polymer structure (Jastrzebsk et al., 2002, 1995; D’Alba and Shawkey 2019).
The melanin under study from Pannonibacter phragmitetus [EP83] bacterial origin is a water soluble melanin. This enchants the study in a more urge and a mandatory need to understand its dielectric properties. Dielectric measurements are very important to study the molecular, solute-solute, solute-solvent interactions and dynamics of polar liquids, (Sengwa and Sankhla, 2007 Qashou et al., 2017).
This paper presents the result of measured parameters over the frequency range of 20 Hz to 2MHz on mixture of water-soluble melanin with 80 Ώ milli Q water. The dielectrics have been studied at various temperatures viz. 95, 98.6, 102.2, 105.8, 109.4 and 113 K i.e. a temperature range between 35 to 45 ˚C with a difference of 2˚C under various concentration ranges as 0, 25, 50, 75, 100 µg/mL of water soluble melanin extracted from Pannonibacter phragmitetus [EP83].
The confirmation of the primary melanin structure under varying environmental conditions and interaction amongst the molecular position is one of the most interesting and challenging subjects in the scientific field like medicine, physics, biology, electronics engineering etc.
MATERIALS AND METHODS
Sample preparation
Melanin extract was obtained from the bacterial source, Pannonibacter phragmitetus [EP83] GenBank: AJ400704.1 (Pithawala and Jain, 2013) as a water soluble black-brown pigment. The pigment was extracted and made purified using the previously standardized method (Wei and Chen, 2005). The culture broth was mixed with a four volume of methanol and mixed vigorously. The resulting solution was centrifuged at 10,000 rpm for 10 min. The upper layer was collected and filtered through a 0.22 μpore sized filter paper. The filtrate was concentrated using a rotary evaporator and subsequently extracted with 3.0 M chloroform. The chloroform phase was collected and concentrated to obtain the resultant product, the black-brown pigment. The melanin as produced by Pannonibacter phragmitetus [EP83] is also known to solubilize in a mixture of aqueous chloroform. The mixtures of melanin extracted with milli Q water were prepared at different concentrations by volume as 0, 25, 50, 75 and 100µg/mL.
Measurements
An Agilent E 4980A precision LCR meter with a four terminal liquid dielectric test fixture (Agilent 16452A) were used for the capacitance and resistance measurement in the frequency range 20 Hz to 2MHz. The capacitance and resistance of the liquid dielectric test fixture, with and without sample, were measured in order to compensate for a short. The test fixture correction co-efficient was also considered to cancel the effect of the stray capacitance during the evaluation of the value of the complex dielectric function. The measurements were carried out at constant temperature by thermostat with an accuracy of ± 0.1 K.
Evaluation of Different Parameters
The complex dielectric constant ε*(ω) of the material is determined from the Eq. 1 (Agilent 16452A manual 2000).
![]()
where ω=2πf is the angular frequency, C0 is the capacitance in free space, Cp is the capacitance with sample, Rp is the equivalent parallel resistance with sample and α is the corrective co-efficient of the cell.
The charges considering as an independent variable, conductivity relaxation effects can be suitably analyzed within the modulus formation in terms of a dimensionless quantity, called electric modulus M*(ω) is obtained from the below relation (Shinyashiki et al., 1998).
![]()
The main advantage of this formalism is that the space charge effects often do not mask the features of the spectra. The complex impedance formalism Z*=1/Y*, where Y* is the complex admittance which is commonly used to separate the bulk and the surface phenomena (Sengwa and Sankhla 2007). The electrode polarization (EP) is a highly capacitive phenomenon and therefore it characterized by large relaxation times than the polarization mechanisms in bulk. A common feature of dielectric with σdc is a discontinuity at electrode/dielectric interface, which has different polarization properties than the bulk of the dielectric. The frequency dependent value of the complex impedance Z*(ω) of the material was evaluated by the relation
![]()
All dielectric parameters were carried out at various temperatures between 35˚C to 45˚C with a temperature difference of 2˚C.
Results AND DISCUSSION
The frequency dependence of the real part of relative dielectric function ɛ’ of various concentrations of melanin at various temperature ranges are shown in Fig. 1, in which the value of ɛ’ is high in the lower frequency region corresponding to the electrode polarization effect. Here time consistency between hydration and temperature effects for the conductivity model utilizing dielectric spectroscopy, heat capacity measurements, frequency scaling phenomena. Level of hydration is sufficient for melanin to be in the conductive regime in
Figure 1: Frequency dependence of the real part of relative dielectric function ε′ for various concentrations of melanin in 80 Ω milli Q water at various temperature ranges.
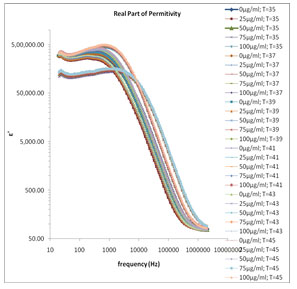
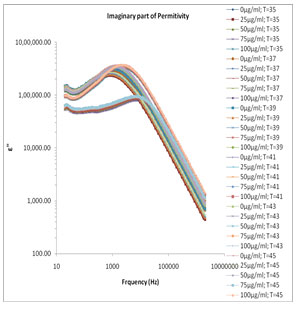
which the reaction is strongly exhibited. (Motovilov et al., 2019). The electrode polarization (EP) phenomena occur due to formation of electric double layer (EDL) on the electrode surfaces. The magnitude of EP depends on the fractal structure of the electrode surface and the material used for fabrication of the electrodes. The large value of ɛ’ (Fig.1) and ɛ” (Fig.2) at lower frequency make it easy to identify the effect of blocking electrodes which corresponds to free charge motion within the material. These values are rather corresponding to free charge build up at the interface between the dielectric materials and the electrodes. The values of ɛ’ in lower frequency region also change with concentration of mixture constituents.
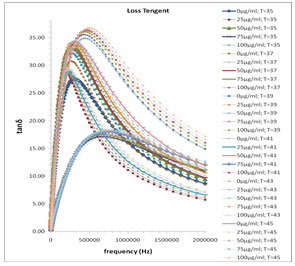
In Fig. 1 the values of ɛ’ are almost independent of frequency at higher frequency range these values of ɛ’ represents the static dielectric constant ɛ0 of the melanin samples. The values of ɛ0 in the higher frequency range symmetrically increase with the decreased concentration of melanin (Fig. 1). This happens with a general rule with all selected temperature range between 35˚C to 45˚C with a difference of every 2˚C temperature. Fig. 3 shows the frequency dependent tanδ spectra of the mixture of water-soluble bacterial melanin with 80 Ω milli Q water. The tanδ spectra have the peak value corresponding to the electrode polarization (EP) relaxation frequency fEP, which is used to separate the bulk material property and EP phenomena’s (Zhang, et al. 2005; Motovilov et al., 2019).
Figure 2: Frequency dependence of the dielectric loss ε″ various concentrations of melanin in 80 Ω milli Q water at various temperature ranges.
The values of fEP where used to evaluate the electrode polarization relaxation time (Sengwa et al., 2007 a; b; c and Shinyashiki et al., 1998). The τEP values representing the mean time for an ion to travel from one electrode to another and involves charging/discharging time of electric double layer capacitance, which is associated with the overall dynamics of the absorbed ions on the electrode surface in the alternating electric field. Such behavior is accompanied by moderate increase of the frequency dependent conductivity (Sengwa et al., 2007d, Shinyashiki et al., 1998; Motovilov et al., 2019).
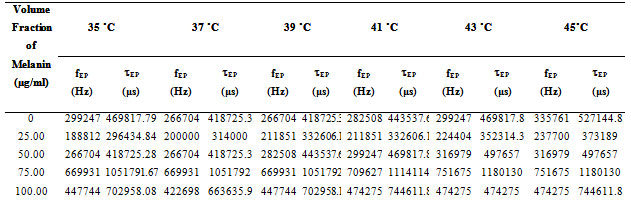
In Fig. 3 the values of the tanδ peak frequency changes with the concentration of the Pannonibacter phragmitetus [EP83] melanin, whereas the magnitude of the tanδ peak values are in between 15 to 38. The frequency of electrode polarization relaxation increases with increases of EP83 melanin concentration up to around 80% and then it starts to decrease. The value of electrode polarization relaxation time τEP with volume fraction of melanin concentration is reported in Table 1. The variation of the electrode polarization relaxation time τEP versus volume fraction of Pannonibacter phragmitetus [EP83] melanin in milli Q water is shown in Fig. 4, which clearly indicates that the values of τEP increases with increase of the concentration of Pannonibacter phragmitetus [EP83] melanin in milli Q water up to certain concentration and later decreases.
Figure 3: Frequency dependence of the loss tanδ for pure milli Q water and mixtures of miliQ water and EP83 melanin at various temperature ranges.
The dielectric spectroscopic study provides insights into the structure of compounds, grain boundary, grain, transport properties and charge storage capabilities of dielectric material. The dielectric properties depend on several factors, including the chemical composition and the method of preparation, etc.
Figure 4: Plots of the electrode polarization relaxation time FEP versus concentration of EP83 melanin for the binary mixture of milli Q Water and melanin at various temperatures.
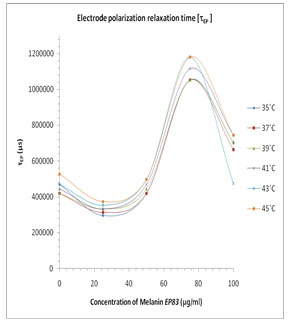
Fig. 5 and Fig. 6 show the variation of M’ and M” versus frequency of varying concentration of Pannonibacter phragmitetus [EP83] melanin. At lower frequency the charges has to build up at the electrodes and material interface before change of the field direction, giving a high effective value of ɛ’ (electrode polarization phenomenon). With increasing frequency there is less time for the buildup of the charges at the boundaries of conducting species in the material and at the ends of conducting path. (Uchino and Nomura 2017).
Figure 5: Frequency dependence of the real part of electric modulus M′ for pure milli Q water and mixtures of miliQ water and EP83 melanin at various temperature ranges.
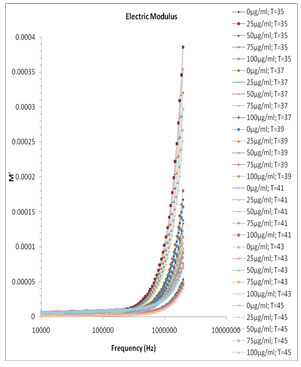
This phenomenon leads to the so-called conductivity relaxation and in fact reflects the distribution of the conductivity relaxation time (Kyritsis et al., 1995), which is the time of electrical stress associated with ion mobility (Zhang et al., 2005; Uchino and Nomura 2017). There is no peak found within the selected frequency range and hence the values and graph of τEP and thus the ionic conductivity relaxation time τσ is not feasible.
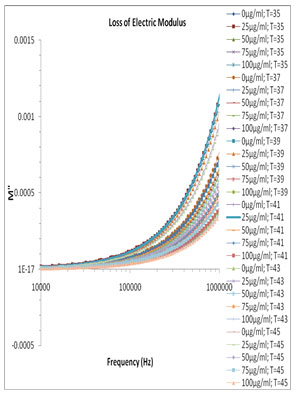
Figure 6: Frequency dependence of the electric modulus loss M″ for pure milli Q water and mixtures of miliQ water and EP83 melanin at various temperature ranges.
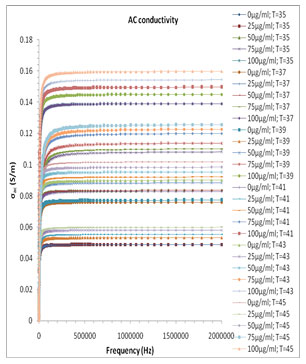
The alternating current (ac) complex conductivity σ*(ω) has the frequency dependent real part σ’ and the imaginary part σ”. The σ*(ω) of the liquid sample were obtained from the below equation
![]()
Where ɛo(8.854×10⁻¹² N/m) is dielectric constant of the vacuum. The ac conductivity plot of the different volume fraction mixture of the system is shown in Fig. 7. The σ’ spectra of melanin and milli Q water have frequency dependent plateau (Fig. 7), which corresponds to ionic or ac electric conductivity σac and exhibits dispersion at lower frequency region. Usual increase of ionic conductivity of a mixture is due to the increment of the number of mobile charge carrier produced in the liquid system with change in concentration at the constituent.
The real part of ac conductivity σac of the milli Q and Pannonibacter phragmitetus [EP83] melanin mixture increases with the increase up to 80% of the melanin concentration and then for higher concentration of melanin in the mixture shows the anomalous behavior in concentration dependant conductivity values, which is due to the significant change of the hydrogen bond interactions and molecular dynamics of the binary mixture of milli Q Water and Pannonibacter phragmitetus [EP83] melanin.
Figure 7: Frequency dependence of the real part of ac conductivity (σac) for pure milli Q water and mixtures of miliQ water and EP83 melanin at various temperature range.
The complex impedance plane plot for the mixture of milli Q and Pannonibacter phragmitetus [EP83] melanin is shown in Fig. 8. From this plot it can be seen no separate arcs are observed corresponding to the bulk material effect (the high frequency arc) as well as electrode surface polarization effect (the low frequency arc). For mixture of milli Q and Pannonibacter phragmitetus [EP83] melanin, single arc is observed which representing the bulk material effect. Usualy the frequency values corresponding to Z” minimum values in the Z” versus Z’ plot separates the bulk effect and the surface effect (Pissis and Kyritsis, 1997). This frequency is found to vary with the concentration of melanin in milli Q.
Figure 8: Plots of Z″ versus Z′ for the mixture of EP83 melanin and milli Q water at various temperature range.
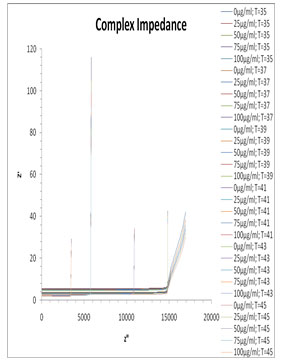
Table 1. Calculated values of electrode polarization relaxation time tEP with change in volume fraction of Pannonibacter phragmitetus [EP83] melanin concentration at various temperature ranges
Electrical behavior of synthetic melanin films has been investigated in vacuum, to prevent any possible effect from the ambient humidity, as it has been reported for thick melanin samples (pellets) prepared from powders (Goncalves et al. 2006). The explanation of the electrical properties could be done assuming the existence of two types of water in the melanin structure. The electrical conduction, observed in all samples, could be related to an irreversible mechanism of easy water desorption with a consequent change of the structure affecting the electrical behavior. In fact, from RT to 380–400K the resistance will decrease due to the raise of the carrier density, while water desorption will have minor effects on the electrical conduction. At higher temperatures the electron density will further increase together with a higher rate of easy water desorption from the melanin molecules. These water molecules are permanently lost by the melanin, since the electrical characterization is carried out in high conditions. This result acts as an independent confirmation that significant amounts of liquid like water is present in the wet melanin sample at high temperatures. Results also demonstrate that bimolecular conductivity models should account for temperature and hydration effects coherently. Such a behavior persists, even if reducing its amplitude, as long as water is bound to the melanin molecule. The present study will be great application potentials in cosmetics, and pharmaceutical industries.
CONCLUSION
The dielectric and electrical properties of the binary mixtures of Pannonibacter phragmitetus [EP83] melanin in milli Q water were investigated at various temperatures viz. 95, 98.6, 102.2, 105.8, 109.4 and 113 K i.e. a temperature range between 35 ˚C to 45 ˚C with a difference of 2˚C under various concentration ranges as 0, 25, 50, 75, 100 µg/mL in the frequency range of 20 Hz to 2 MHz. The complex dielectric function of these binary mixtures in lower frequency region is governed by ionic conduction and electrode polarization phenomenon. The comparative analysis of the various dielectric and electrical quantity spectra conforms that the behavior of ionic conduction and EDL dynamics is dependent on the concentration of the mixture constituents. The ionic conduction and surface effect in the mixture systems are confirmed by the electric modulus and the impedance formalism. The electrode polarization relaxation time τEP depend on the concentration of melanin in the mixture. Melanin possesses physicochemical properties and biological activities that make it a suitable biomaterial for a wide range of applications in cosmetic, pharmaceutical, electronic, and other processing industries. In addition, this pigment has a considerable biotechnological interest because it can be produced on a large scale with low cost, making its use for future practical economically advantageous applications.
However, it is necessary to expand the knowledge about the dielectric properties of water-soluble melanin from bacterial origin. The present research article emphasis on Pannonibacter phragmetetus [EP83]; GenBank: AJ400704.1 for production of water-soluble melanin. However, there are very few known bacterial species that produces water soluble pigment especially melanin. In this context, the information will be useful and will encourage a greater number of researches on melanin, which might be useful to deploy innovative and sustainable solutions for human health and the environment.
ACKNOWLEDGMENT
The authors are thankful to UGC-Info net and INFLIBNET Gujarat University for providing e-source facilities. Special thanks to Dr. V. A. Rana, Professor, Department of Physics; and H. P. Vankar, Research Scholar for their assistance in helping out to dielectric concepts and data validation. We are also thankful to Prof. P.N. Gajjar, Head, Department of Physics, School of Sciences, Gujarat University, Ahmedabad for permission to use precision LCR meter – Agilent E 4980A.
Conflict of Interest
The authors declare that the research was conducted in the absence of any commercial or financial relationships that could be construed as a potential conflict of interest.
REFERENCES
Bilinsk B (1996) Progress of infrared investigations of melanin structure Spectrochemica Acta. Part A. Vol 52: Pages 1157-1162.
Blarzino C, Mosca L, Foppoli C, Coccia R, De Marco C and Rosei M (1999) Lipoxygenase/H2O2–Catalyzed oxidation of Dihydroxyindolles: synthesis of melanin pigments and study of their antioxidant properties. Free Radical Biology and Medicine Vol 26: Pages 446- 453.
Crippa P, Horak V, Prota G, Svoronos P and Wolfram L (1989) Chemistry of melanins In: A. Brossi pp. 253-323 Alkalides, (Edited by) Academic Press, New York.
Crippa PR and Michelini S (1999) Model for interfacial electron transfer on colloidal melanin. Journal of Photochemistry and Photobiology B: Biology Vol 50: Pages 119-123.
D’Alba L and Shawkey MD (2019) Melanosomes: Biogenesis, Properties, and Evolution of an Ancient Organelle Physiological Review Vol 99 No 1: Pages 1-19.
Foster K and Schwan H (1995) Handbook of biological effects of electromagnet. In: Polk C and Postow E, pp.25-102 (Edited by), Baco Raton, FL: CRC, Fields.
Ghannam MM, Al-Gebaly RH, Gaber MH and Ali FM (2002) Inhibition of Ehrlish Tumor Growth in Mice by Electric Interference Therapy (In–vivo Studies), Electromagnetic Biology and Medicine Vol 21: Pages 267-280.
Goncalves PJ, Filho OB, Graeff CFO (2006) Effects of hydrogen on the electronic properties of synthetic melanin Journal of Applied Physics Vol 99 No 10: Page 4701.
Grant EH, Sheppard RJ and South GP (1978). Dielectric behaviour of biological molecules in solution, pp 123-157 (Edited by) Clarendon Press, Oxford.
Harki E, Talou T and Dargent R (1997) Purification, characterization and analysis of melanin extracted from Tuber melanosporum vitt., Food Chemistry Vol 58: Pages 69-73.
Hengshan W, Yingming P, Xujie T and Zhiqing H (2006) Isolation and characterization of melanin from Osmanthus fragrans’ seeds. LWT Food Science Technology Vol 39: Pages 496-502.
Hutchinson JA, Hamley IW, Charlotte JC, Castelletto V, Cristian P, Cramer R, Kowalczyk R, Seitsonen J, Ruokolainen J and Rambo RP (2019) Melanin production by tyrosinase activity on a tyrosine-rich peptide fragment and pH-dependent self-assembly of its lipidated analogue Organic and Biomolecular Chemistry Vol 17 Page 4543-4553.
Jastrzebsk M, Kocot A, Vij J, Zalewsk J and Witecki T (2002) Dielectric studies on charge hopping in melanin polymer. Journal of Molecular Structure Vol 606 Pages 205-210.
Kollias N, Sayre R, Zeise L and Cedekel M (1991) Photoprotection by melanin, Journal of Photochemistry and Photobiology B: Biology Vol 9: Pages 135-160.
Krol S and Liebler DC (1998) Photoprotective action of natural and synthetic melanins Chemical Research in Toxicology Vol 11: Pages1434-1440.
Kyritsis A, Pissis P and Grammatikakis J (1995) Dielectric relaxation spectroscopy in poly (hydroxyethyl acrylates) /water hydrogels Journal of Polymer Science Part B: Polymer Physics Vol 33: Page 173.
Maranduca MA, Branisteanu D, Serban DN, Branisteanu DC, Stoleriu G, Manolache N, and Serban IL (2019) Synthesis and physiological implications of melanic pigments. Oncology Letters Vol 17 No. 5: Pages 4183-4187.
Mejia-Caballero A, Anda R, Hernandez-Chavez G, et al. (2016) Biosynthesis of catechol melanin from glycerol employing metabolically engineered Escherichia coli. Microbial Cell Factory Vol 15: Page 161.
Miyake Y, Izumi Y, Tsutsumi A and Jimbow K (1986) Chemico-Physical Properties of Melanin III. In: Jimbow K Structure and Function of Melanins. Pp 3-18 (Edited by) Fuji Sapporo
Mosca L, Blarzino C, Coccia R, Foppoli C and Rosei M (1998) Melanins from Tetrahydroisoquinolines: spectroscopic characteristics, scavenging activity and redox transfer properties. Free Radical Biology and Medicine Vol 24: Pages 161-167.
Motovilov KA, Grinenkobc V, Savinovd M, Gagkaevaa ZV, Kadyrova LS, Pronine AA, Bedrana ZV, Zhukovaae ES, Mostert AB and Gorshunovae BP (2019) Redox chemistry in the pigment eumelanin as a function of temperature using broadband dielectric spectroscopy Royal Society of Chemistry advance Vol 9 Pages 3857-3867.
Pissis P and Kyritsis A (1997) Electrical conductivity studies in hydrogels Solid State Ionics Vol 97: Pages 105-113.
Pithawala EA and Jain NK (2013) Synthesis and Screening of Melanin from Bacterial Strain EP83 International Journal of Scientific Research Vol 2 No 7: Pages 35-36.
Prota G (1992) Melanins and Melanogenesis. first ed., Academic Press, San Diago
Qashou SI, Darwish AA, Rashad M and Khattari Z (2017) AC electrical conductivity and dielectric relaxation studies on n-type organic thin films of N,N′-Dimethyl-3,4,9,10-perylenedicarboximide (DMPDC) Physica B: Condensed Matter Vol 525: Pages 159–163.
Riley PA (1997) Melanin in Focus, Melanin International Journal of Biochemistry and Cell Biology Vol 29: Pages 1235-1239.
Rosei M and Mosca L Galluzi F (1996) Photoelectronic Properties of synthetic melanins Synthetic Metals Vol 76: Pages 331-335.
Rosei M, Mosca L (1995) Production of melanin pigments by chemical and enzymatic oxidation of Tetrahydroisoquinolines Biochemistry and Molecular Biology Internaional Vol 7: Pages 1253-1259.
Saran T (1992) Properties and function of ocular melanin, A photobiophysical view, Journal of Photochemistry and Photobiology Part B Biology Vol 12: Pages 215-258.
Sengwa RJ and Sankhla S (2007) Characterization of heterogeneous interaction in binary mixtures of ethylene glycol oligomer with water, ethyl alcohol and dioxane by dielectric analysis, Journal of Molecular Liquid Vol 130: Pages 119-213.
Sengwa RJ and Sankhla S (2007a) Solvent effects on the dielectric dispersion of poly(vinyl pyrrolidone)-poly(ethylene glycol) blends, Colloid and Polymer Science Vol 285: Pages 1237–1246.
Sengwa RJ and Sankhla S (2007b) Dielectric Dispersion Study of Poly (vinyl Pyrrolidone)–Polar Solvent Solutions in the Frequency Range 20 Hz–1 MHz. Journal of Macromolecular Science Part B: Physics Vol 46: Pages 717–747.
Sengwa RJ and Sankhla S (2007c) Low-frequency dielectric response and chain dyanamics study of poly(vinyl pyrrolidone)-poly(ethylene dlycol) coexisting two-phase polymetric blends Indian Journal of Engineering and Materials Sciences Vol 14: Pages 317–323.
Sengwa RJ and Sankhla S (2007d) Dielectric dispersion study of coexisting phases of aqueous polymeric solution: Poly (vinyl alcohol) + poly (vinyl pyrrolidone) two- phase systems, Polymer. Vol 48: Pages 2737-2744.
Shinyashiki N, Yagihara S, Arita I and Mashimo S (1998) Dynamics of Water in a Polymer Matrix Studied by a Microwave Dielectric Measurement, Journal of Physical Chemistry: B Vol 102 No. 17: Pages 3249-3251.
Subrata S (1992) Electric and Dielectric Properties of Wet Human Cortical Bone as a Function of Frequency IEEE Transactions of Biomedical Enginering Vol 59: Pages 1298-1304.
Uchino K and Nomura S (2017) Critical exponents of the dielectric constants in diffused-phase-transition crystals, Ferroelectrohemistry Letter Vol 44: Pages 55-61.
Wei Yu-Hong and Chen (2005) Enhanced production of prodigiosin-like pigment from Serratia marcescens SMÄR by medium improvement and oil supplementation strategies Journal of Bioscience and Bioengineering Vol 99 No. 6: Pages 616-622.
Yong-gang Tu, Ya-zhen Sun, Ying-gang Tian, Ming-yong Xie and Jie Chen (2009) Physicochemical characterisation and antioxidant activity of melanin from the muscles of Taihe Black-bone silky fowl (Gallus gallus domesticus Brisson). Food Chemistry Vol 114: Pages 1345-1350.
Zhang S, Dou S, Colby RH, Runt J, (2005) Glass transition and ionic conduction in plasticized and doped ionomers. Journal of Non-Crystalline Solids Vol 351: Pages 2825–2830.

