Yury G. Aleynikov1*![]() and Anastasia V. Konstantinovich2
and Anastasia V. Konstantinovich2
1Russian State Agrarian University – Moscow Timiryazev Agricultural Academy (RSAU – MTAA or RSAU – MAA named after K.A. Timiryazev) (Timiryazevskaya st., 49, Moscow, Russian Federation, 127550).
2Russian State Agrarian University – Moscow Timiryazev Agricultural Academy (RSAU – MTAA or RSAU – MAA named after K.A. Timiryazev) (Timiryazevskaya st., 49, Moscow, Russian Federation, 127550).
Corresponding author email: yuri@AleyRobotics.com
Article Publishing History
Received: 21/03/2021
Accepted After Revision: 14/06/2021
Processes research of plant organisms involves many biometric parameters. Latest 3D scanning technologies and computer vision systems makes it possible to evaluate such plant parameters as leaf width, length, plant height, green mass and volume. Thus, the chief purpose of the study is to examine the creation of 3D cloud models for plants using a scanner and a walking machine with dynamic stability. To fulfil that aim, for scanning plants in laboratory and in field conditions, a 3D scanner and stereo cameras are mounted on a walking machine with dynamic stability. To automate the collection of biometric parameters of plants, it is proposed to use a walking machine with dynamic stability equipped with high-resolution cameras and a 3D scanner. For scanning plants in the laboratory and in the field, a 3D scanner and stereo cameras are installed on a walking machine with dynamic stability.
A 3D scanner creates a point cloud depth map by illuminating the surrounding space with an infrared laser with a structured light. Depth data is converted to 3D image by software. Laboratory experiments and field tests of a 3D scanner installed on a walking machine with dynamic stability, were created 3D point clouds models of plants. In the course of the research were revealed the features of scanning plants with aperture light. Small leaves and thin stems are difficult to scan if their size are less than 8 mm. Due wind condition imperfect scan algorithms create duplicated identical leaves. To reduce the distortion of the point cloud, it is necessary to apply stabilization methods, based on vibrations and orientation in space parameters of the walking machine body. And make scan action at exactly moment in time when the machine body has the lowest oscillatory speed.
Walking Machine, Walking Machine Sensors, 3d Point Cloud, 3d Scanning, Computer Vision
Aleynikov Y. G, Konstantinovich A. V. Creation of 3D Cloud Models for Plants Using a Scanner and Walking Machine with Dynamic Stability. Biosc.Biotech.Res.Comm. 2021;14(2).
Aleynikov Y. G, Konstantinovich A. V. Creation of 3D Cloud Models for Plants Using a Scanner and Walking Machine with Dynamic Stability. Biosc.Biotech.Res.Comm. 2021;14(2). Available from: <a href=”https://bit.ly/2RaIM7o“>https://bit.ly/2RaIM7o</a>
Copyright © Aleynikov and Konstantinovich This is an open access article distributed under the terms of the Creative Commons Attribution License (CC-BY) https://creativecommns.org/licenses/by/4.0/, which permits unrestricted use distribution and reproduction in any medium, provide the original author and source are credited.
INTRODUCTION
Research of plant body’s growth processes involves the measurement of multiple indicators. The need to reduce manual effort to measure plant biometrical indicators is long overdue and modern digital technology makes it possible to automate measurement processes. The use of the newest 3D scanning technologies and computer vision systems allows estimating such plant characteristics as leaf width and length, height of the plant, and the volume of green mass. At present, we have accumulated experience and developed methods for determining leaf area and plant height, and planimeters have been created for this purpose.
Many of the methods for determining the indicators require manual work being performed by an agronomist. In order to automate the collection of plant biometric parameters, it is proposed to use a walking machine with dynamic stability equipped with high-resolution cameras and a 3D scanner. It is planned that, while moving in open and protected ground, the machine will be an excellent assistant for agronomists in their plant monitoring (Asgharzadeh and Manda, 2021).
Nowadays, with the advent of computer technology, automation of the plant growth and development monitoring processes allows us to receive plants parameters, to systematize them, and make prognoses and give recommendations to agronomists on the basis of mathematical models. Foreign specialists have been actively using the newest technologies of plants scanning (Sheikhshoaie et al, 2018). Databases of colour 3D plant models are being created.
Decreasing the cost of 3D scanners and optical systems makes it possible to create inexpensive automated monitoring systems. High resolution laser scanners are used for monitoring wheat growth (Adam et al., 2017). Digital models of plants are being created based on graphs and triangulation; they allow creating models based on the growth points of leaves, flowers and fruits on the plant stem (Kjaer & Ottosen, 2015; Lancelot et al., 2017; Asgari,(2021).
Nowadays researchers face difficulties in software development, precision of optical instruments and there is a search of balance between high cost of the equipment and practical importance of data collected by them (Wang et al., 2019). Few studies have been conducted so far, and their results are difficult to replicate because each study uses many types of equipment and also non-standard and often self-written software not suitable for other research projects. Since 3D technologies have been actively used in plant growing relatively recently, it is safe to say that this area is understudied (Panjvani et al., 2019).
Optical methods for creating plant models are also actively studied, and specialized scanners and software are created (Paulus, 2019). Neural network algorithms are also used in modelling (Nguyen et al., 2016). Research and design of walking machines is being carried out not only abroad, but also in Russia (Petrov, 2019; Chaudhury et al., 2020).
The purpose and importance of this survey is demonstrating the possibilities of 3D plant scanning by means of scanner and computer vision intended to define values of plants’ biometric indicators, to accumulate an experience of scanner operation, to reveal the best methods of scanning and processing point clouds.
MATERIAL AND METHODS
For scanning plants in laboratory and in field conditions, a 3D scanner and stereo cameras are mounted on a walking machine with dynamic stability. 3D scanners generate a depth map in the form of a point cloud by illuminating the surrounding area with an infrared laser with structured illumination. This makes it possible to track and identify objects in three dimensions. For this task, inexpensive and reliable diffractive optical elements are well suited (Sheikhshoaie et al, 2018; Chaudhury et al., 2020).
A Kinect device made by Microsoft is used as a 3D scanner. This device allows us to capture a colour image at a speed of 30 fps with a field of view of 57ºx43º and a resolution of 640×480 pixels. The colour image is encoded in RGB format with 8 bits per channel and contains depth information with an accuracy of 11 bits. The unit’s laser projector illuminates the entire scene simultaneously using a diffraction grating to create a digital pattern. The distance from the lens is calculated by correlating and triangulating an IR image and the reference pattern diagram stored in the device’s memory. This method allows moving parts to avoid, and also to reduce electric power consumption, device dimensions and sensor cost in comparison to LIDAR scanners.
Depth data can be converted into a three-dimensional representation by means of software. Sensor transmits coordinates of points and their colour (x, y, z, R, G, B). The practical sensor accuracy is ±10 mm at 2m distance and ±70 mm at 5m (Paulus, 2019; Chaudhury et al., 2020). The manufacturer’s stated optimum distance is 1.2 – 3.5 m. This distance is too long for measurements between rows of plants, so optical lenses from spectacles are used to correct the camera’s “far-sightedness”. A special lens holder on the sensor allows easy selection of the necessary dioptre value. The measurement accuracy is also affected by many factors: bright sunshine, the reflectivity of leaf surfaces, and movement of plants in windy weather.
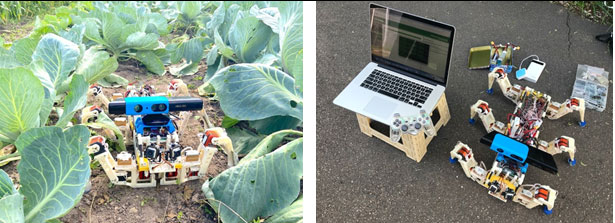
Point clouds were collected and processed using the open-source Point Cloud Library (PCL). Blender, an open-source editor, was used to edit and visualise the point cloud. Point clouds were acquired using Kinect. The data was processed in several steps: noise reduction, smoothing and removing artefacts, selecting individual plants, calculating the volume and dimensions of the plants. Scanning was carried out using a walking machine, and further processing and analysis was performed in the laboratory using a desktop computer, see Figure 1.
In the field conditions, a laptop computer can be used to adjust the motion parameters, to record telemetry, and also to make prompt changes to the walking machine software. Communication between the laptop and the machine’s on-board computer was carried out using a wireless Wi-Fi connection. Scanning was carried out by means of the equipment installed on the walking machine. The measurement accuracy made with the scanner was checked by comparing the digital data values and linear dimensions measured with a ruler. The experimental plot, where measurements were carried out, is located on the territory of the Educational Scientific and Production Centre “V.I. Edelstein Experimental Vegetable Growing Station” at K.A. Timiryazev RSAU-MAA in Moscow (coordinates: 55°49′40″N, 37°33′3″E).
Figure 1: Experimental walking machine
RESULTS AND DISCUSSION
In the course of the research, data was obtained in the form of a plant’s colour point cloud. In the course of the research, the peculiarities of plant scanning by means of aperture illumination were revealed. As the scanner and on-board computer scan the surrounding space slowly, at a speed of 3-10 fps, some leaves of the plants were blurred. The plants were moved by the wind during the scanning process. Contrary to expectations, bright sunlight had no effect on the laser light, and the accuracy and quality of the measurements were the same in both shaded and lit areas. To improve scanning quality and speed, it is advisable to increase the number of scanners mounted on the walking machine.
This will widen the viewing angle, as well as reduce the blind spots in the surrounding space, where there are no point clouds. Plant scanning was carried out under laboratory and field conditions. The following plants were scanned under laboratory conditions with artificial light in statics: common basil (lat. Ocimum basilicum L.), hot pepper (lat. Capsicum annuum L.), zonal pelargonium (lat. Pelargonium hortorum L.), jade tree (Crassula ovate L., another name is Crassula or “money tree”), spurge (lat. Euphorbia leuconeura), dill (Anethum graveolens L.). The plants were placed on a high stool, around which the scanner was moved manually.
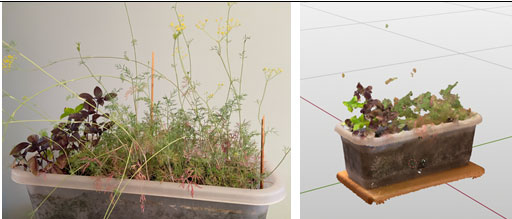
The purpose of scanning was to identify peculiarities of plant scanning and to work out methods of collection, processing and visualization of the obtained data. The results showed that small stems and leaves were difficult to scan and were often not detected by the scanner. Dill was the most difficult plant to scan. Its thin stems and leaves, like a cloud of dots, were a jelly of dots. It was not possible to distinguish the stem, the individual leaves, or to separate one plant from another, see Figure 2. In the cloud of dots, there were groups of dill flowers that hang separately in space.
Figure 2: Plants of great basil (lat. Ocimum basilicum L.) and fragrant dill (lat. Anethum graveolens L.)
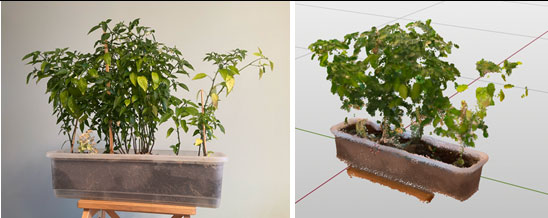
Scanning of the pepper showed that leaves with a circumference of 8 mm or more on their surface were confidently detected by the scanner at a distance of 50 cm. Thin stems with a diameter of 4-5 mm at the root were absent from the dot cloud, see Figure 3.
Figure 3: Plants of hot pepper (lat. Capsicum annuum L.)
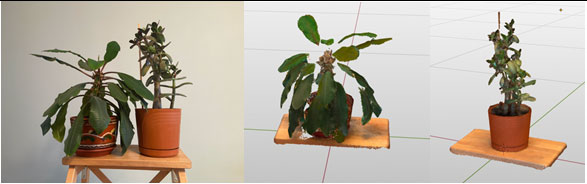
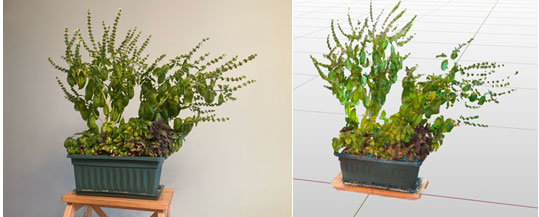
An attempt was made to scan a plant with a thick, pronounced stem and leaves. The objects selected were a Crassula and a spurge plant. The thick stems and leaves of the Crassula are well suited for scanning, while the stems of the milk thistle are hidden behind the leaves. Plants with a small gap between the leaves are difficult to scan, see Figure 4.
Figure 4: Crassula (lat. Crassula ovata L.) and spurge (lat. Euphorbia leuconeura)
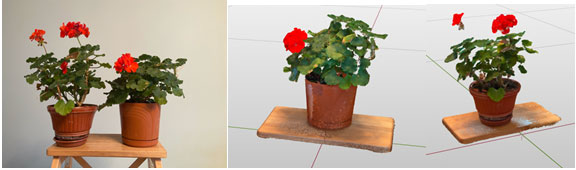
A scan of the geranium also revealed areas inaccessible to the scanner in the blind spots between the leaves of the plant. The stems and soil in the pot were not detected by the scanner, see Figure 5.
Figure 5: Plants of geraniums (lat. Pelargonium hortorum L.)
An interesting result was obtained by scanning a flowering basil plant. The scanned image clearly shows flowers from 8 mm in size, Figure 6.
Figure 6: Plants of great basil (lat. Ocimum basilicum L.)
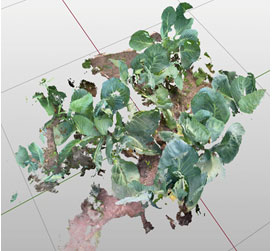
The experience gained with the scanner in the laboratory made it possible to carry out the experiment in the field conditions. A scanner was installed on a walking machine, see Figure 1. It was found in the process of scanning that the software, which provides orientation in space of a lot of pictures with data on depth, is very important parameters of feedback on vibrations and oscillations of the machine body, and also it is necessary to synchronize movements on shifting supports with the process of scanning. Abrupt movements cause blurring of the point cloud. White cabbage (lat. Brassica oleracea L.) plants were scanned under field conditions. Growing conditions, row spacing, and leaf size matched the specifications formulated in the laboratory tests, see Figure 7.
Figure 7: The fragment of points cloud for cabbage (lat. Brassica oleracea L.)
The field experience with scanning revealed a number of observations. The scanning algorithms used proved ill-prepared for moving plants. Leaves moving in the wind in the resulting point cloud look like duplicated leaf surfaces at a distance of about 10 mm from each other.
During laboratory experiments and field testing of a 3D scanner installed on a walking machine with dynamic stability, 3D models of plants in the form of a point cloud were created. Plant scanning showed that small leaves and thin stems are difficult to scan if their size is smaller than 8 mm. Movable plant leaves in the wind look like duplicate identical leaves due to imperfect algorithms in the point cloud (Petrov 2019; Chaudhury et al., 2020).
In order to reduce distortion of the point cloud it is necessary to apply stabilization methods, to take into account vibrations and orientation in space of the walking machine body, as well as to scan at a given point in time, at which the machine body has the lowest speed of oscillatory motion.
ACKNOWLEDGEMENTS
The authors received no direct funding for this research.
Conflict of Interests: the authors declare that there is no conflict of interest in this study.
REFERENCES
Asgari, Bajgirani M (2021). Investigating the Feasibility of Removing Nitrogen and Phosphorus from Gray Water in Effluent Treatment to Reuse Water. Progress in Chemical and Biochemical Research, Vol No 4 pp 11-19.
Asgharzadeh M and Manda N (2021). Antibacterial activity of metabolites isolated from Streptomyces SSp. On Soil Sample of West Azerbaijan, Iran. International Journal of Advanced Biological and Biomedical Research, Vol 9 pp 147-159.
Chaudhury A, Boudon F and Godin C (2020). 3D Plant Phenotyping: All You Need is Labelled Point Cloud Data. In European Conference on Computer Vision, pp. 244-260.
Kjaer KH and Ottosen CO (2015). 3D laser triangulation for plant phenotyping in challenging environments. Sensors, Vol 15 pp 13533-13547.
Nguyen CV, Fripp J, Lovell DR, Furbank R, Kuffner P, Daily H and Sirault X (2016). 3D scanning system for automatic high-resolution plant phenotyping. In 2016 international conference on digital image computing techniques and applications (DICTA) pp. 1-8.
Panjvani K, Dinh AV and Wahid KA (2019). LiDARPheno–A low-cost lidar-based 3D scanning system for leaf morphological trait extraction. Frontiers in plant science, No 10 pp 147-151.
Paulus S (2019). Measuring crops in 3D: using geometry for plant phenotyping. Plant Methods, Vol 15 pp 1-13.
Petrov NB (2019). Educational walking mobile robot development. Polytechnic youth magazine, Vol 9 pp 7-11.
Sheikhshoaie I, Sheikhshoaei M and Ramezanpour S (2018). Synthesis and Characterization of Nano Sized ZnO and CdO by Direct Thermal Decomposition of Their Nano Sized Metal Schiff base Complexes. Chemical Methodologies, Vol 2 pp 103-113.
Wang Y, Wen W, Wu S, Wang C, Yu Z, Guo X and Zhao C (2019). Maize plant phenotyping: comparing 3D laser scanning, multi-view stereo reconstruction, and 3D digitizing estimates. Remote Sensing, Vol 11 pp 63-70.

