1Geobiotechnology Laboratory, Department of Biotechnology, National College (Autonomous), Tiruchirappalli – 620 001, Tamil Nadu, India
2Post Graduate and Research Department of Botany, National College (Autonomous), Tiruchirappalli – 620 001, Tamil Nadu, India.
Corresponding author email: senthil@nct.ac.in
Article Publishing History
Received: 14/04/2020
Accepted After Revision: 25/05/2020
Biorestoration of the textile industry sludge (TS) was carried out through a process of vermistabilization involving earthworms, Eudrilus eugeniae. TS were mixed with cow dung (CD) at different concentrations, which were subjected to vermicomposting studies for a period of 12 weeks. During the study, maximum viability of worms and cocoons production were observed for CD70 and TS30 during the sixth week of incubation. The maximum worm weights were observed on CD90 and TS10 at 4th week, while hatchling production was observed maximum on CD90 and TS10 during twelfth week. The physico-chemical parameters such as pH, EC, TDS, OC were found to be significantly decreased in the final product of vermicompost while parameters such as Ca,N,P,K,Na was found to be significantly increased in the final product of vermicompost. Further, Fe, Cr, Cu, and Zn also decreased in the final product. Allium cepa root chromosomal aberration assay was used to assess the genotoxicity of pre-vermicompost and post-vermicompost samples of TS to understand the effect of vermistabilization on the reduction of toxicity. Genotoxicity analysis of vermistablilized TS revealed 68% decline in the chromosomal aberration frequencies.
Textile Sludge, Vermistabilization, Eudrilus Eugeniae ,Genotoxicity, Chromosomal Aberration, Allium Cepa
Ramu S, Sadasivam S. K. Biorestoration of Textile Industry Sludge Through Vermistabilization and Subsequent Genotoxic Assessment in Allium Cepa. Biosc.Biotech.Res.Comm. 2020;13(2).
Ramu S, Sadasivam S. K. Biorestoration of Textile Industry Sludge Through Vermistabilization and Subsequent Genotoxic Assessment in Allium Cepa. Biosc.Biotech.Res.Comm. 2020;13(2). Available from: https://bit.ly/2S8yqTd
Copyright © Ramu and Sadasivam This is an open access article distributed under the terms of the Creative Commons Attribution License (CC-BY) https://creativecommns.org/licenses/by/4.0/, which permits unrestricted use distribution and reproduction in any medium, provide the original author and source are credited.
INTRODUCTION
There are numerous textile industries present in the world which produces high volumes of textile effluent. During the treatment process of these effluents, a large volume of textile sludge (TS) is produced which is a potential source of contamination of agricultural land, surface, and ground water systems causing public health hazards. The space requirement, stringent national waste discarding system and public consciousness have made land filling highly expensive and impractical (Ndegwa and Thompson 2001). Vermicomposting is seen as an alternative technology for the bioconversion of this textile sludge into organic manure. During vermicomposting, earthworms degrade organic matter present in the waste and convert it into high-grade fertilizer called vermicompost. This is a simple and low cost technique used for the breakdown of complex chemical into nontoxic forms. Application of vermicomposting in sludge management is named vermistabilization (Garg et al., 2005; Datta et al., 2018). Application of earthworms and biodegrading microorganisms in vermicomposting offers an efficient technique for the recycling of various nutrients. Application of vermistablilized sludge into land can increase water holding capacity, decrease soil bulk density, increase soil aeration, root penetration and stimulate microbial activity Munawar (2016) and Ramu et al. (2019).
The aim of the present study is to biorestore textile industry sludge amended with cow dung through vermistabilization involving E. eugeniae. Further, the efficiency of vermistabilization in the reduction of toxicity is assessed in Allium cepa. Toxicity evaluation through A. cepa root chromosomal aberration is the most suitable Genotoxicity study recommended by the International program on Plant Bioassay (IPPB) for testing environmental pollutants (Chandrakant et a., 2016) and especially many researchers have used it to evaluate genotoxicity of industrial effluents (Bhat et al., 2014; Shivika et al., 2018).
MATERIALS AND METHODS
Collection of textile Sludge (TS), cow dung (CD) and Eudrilus eugeniae: Textile Sludge (TS) was collected from the Common Effluent Treatment Plant (CETP) of State Industries Promotion Corporation of Tamil Nadu (SIPCOT), Perundurai, Erode District, Tamil Nadu, India. Cow dung (CD) was collected from a single source in a local cattle farm , Karumandapam, Trichy. The initial physico-chemical characteristics of PS and CD are given in (Table 1). Eudrilus eugeniae were collected from Periyar Research Organization for Bio-Technique and Eco-system (PROBE), Periyar Maniyammai University, Vallam, Thanjavur, Tamil Nadu, India.
Experimental design:The experiments were conducted in a specially designed perforated plastic basket (diameter 21.5cm and depth 11.5cm). TS and CD were completely air-dried and sieved (2.0mm mesh) before mixing. The experiments were repeated thrice for each feed mixture. TS were mixed with CD in different ratios and 100 percent CD was used as control. TS was mixed with CD in different ratios V0 0:100, V190:10, V2 80:20, V370:30, V4 60:40, V550:50, V640:60, V730:70, V820:80, V910:90, V100:100. These mixtures were turned manually every day for 30 days in order to eliminate volatile gases which are potentially toxic to earthworms. After 30 days, E. eugeniae (20 gram) were introduced into each vermireactors. Moisture content was maintained at 70% by periodic sprinkling of water. All the vermireactors were kept under ambient conditions (room temperature 25±2°C which is the appropriate temperature for E. eugeniae). At the end of experiment total earthworm number, cocoon and hatchling was counted. The 0th day refers to the time of initial mixing of textile sludge and cow dung that is before pre-composting. The samples were air-dried in the shade at room temperature and stored in plastic bags for further chemical analysis.
Physico-chemical analysis: pH , TDS and EC was measured by using digital meter (Eutech Instrument, PCST test 35 series) by dissolving double distilled water suspension of each sample in the ratio 1:10 (w/v). Organic Carbon (OC) was measured on igniting the samples in a Muffle furnace at 550°C for 1 hour by the method of (Nelson and Sommers 1996). Nitrogen (N) was determined by Bremner and Mulvaney (1982) procedure. Phosphorous (P) was analyzed using the colorimetric method of molybdenum in sulphuric acid. Potassium (K), Sodium (Na) and Calcium (Ca) was Sodium (Na) was measured using a Systronics Flame Photometer-128 after digesting the samples in diacid mixtures (HClO4:HNO3 in 4:1 ratio). Heavy metals were measured by using Agilent AA 240 model Atomic Absorption Spectrophotometer (AAS).
Preparation of extract for genotoxicity analysis :Pre-vermicomposted and post-vermicomposted samples were prepared by mixing 50g of samples in 500 ml of distilled water, after which the sample were continuously stirred for 24 h. Then all sample was filtered through Whatman Filter paper 1 A (pore size 11µm) and was tested for genotoxicity effect. 100% of raw textile sludge was used as positive control and sterile distilled water served as negative control according to French Standardized Method (Ferrari et al., 1999; Sharma et al., 2012).
Experimental procedure:The Allium cepa (commonly called as small onion) was purchased at local market and sorted for equal size of onion bulb for all treatment along with control. The surface scales of the onion bulbs were gently removed from the bottom of the root. The rings of the root primordial were left intact Genotoxicity test was described by Rank and Nielsen (1994). The experiments were performed in triplicates and four bulbs were used per treatment. The onion bulbs were inoculated for 24-48 h in distilled water until the development of roots of 0.5-1cm lenght. Then the onion bulbs were exposed to the various concentrations of pre and post vermicomposted extract (10%, 20%, 30%, 40 %, 50 %, 60 %, 70 %, 80 %, 90 %, and 100%) as well as positive and negative control. It was exposed of 3 and 6 h in arrange to evaluate occurrence of chromosomal aberration and abnormalities before and after treatment. Later the bulb is washed with distilled and the roots are gently removed and were fixed the Farmer’s fluid (glacial acetic acid and ethanol at 1:3 ratio) for 24 h and stored at 4°C. After fixation the root tips were hydrolyzed in 1N HCl for 2 min and then squashed in 4% of aceto carmine after intermittent heating for for 2-4 min. (Sharma et al. 2012).
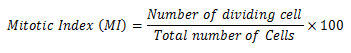
Later the root caps are removed from the well-stained root tips and were immersed in a drop of 45% acetic acid on a clean glass slide. Further squashed under a cover slip with matchstick, sealed (with nail polish) and were examined under light microscope. The presence of chromosome aberrations was observed in a minimum of 500 cells for each treatment groups. The genotoxicity analysis was performed from the pre to post vermicomposted samples. The Mitotic Index (IM) was calculated by observing a minimum of 500 cells per slides for each treatment. The root growth inhibition experiment (root length) was formed after a 12h exposure test on pre-vermicomposted and post-vermicomposted extract (Rank 2003). After the treatment onion bulb was washed with tap water and then the root length was measured. The mitotic index was calculated by using the following formula:
Statistical analysis: One–way ANOVA was used to calculate the differences among various feed mixtures. Tukey’s post–hoc analysis was used to compare the means (n=3) between initial and final compost values of different physico chemical parameters. For MI, and root length, means ± SE was calculated and the stage of significant was determined by Tukey’s post–hoc test. For chromosomal aberration the linear relationship between different concentration was obtained by regression and correlation study. The experimental data is accessible as (means ± SE) triplicate experiment. The statistical analysis was done with help of SPSS version 16.0 among Origin pro 8 software programs.
RESULTS AND DISCUSSION
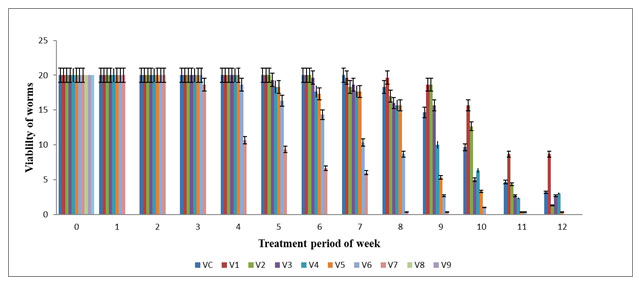
The highest viability of worms (in numbers) were observed in V0 (20±0.0), V1 (20±0.0), V2 (20±0.0) and V3 (20±0.0) in the 6th week and the lowest viability of worms were observed on V5 (3.33±0.33) and V6 (8.66±0.33) in the 10 week but V7 (0.33±0.33) almost declined in the 6th week. The mean viability of worms observed on various concentration of feed mixture was statistically significant (p≤0.05). Viability of E. eugeniae was zero in V8, V9 and V10 from 1st day to 12th week of the experiment period. The net mortality rate were noted on V6 and V7 on 10th week and then in V4 and V5 on 12th week but no mortality was observed in V0 till end of experiment. Significant change was noted on V1 and V2 on 8th week followed by V3 on 4th week and subsequently in V4, V5,V6 on 5th week when compared with all other vermireactors in their respective week (Figure 1). The viability of worms gradually decreased in V2 and V3 from 8th week to 12th week while V4, V5 and V6 from 4th week except V7 till end of the experiment. The mortality rate was directly proportional to the concentration of textile sludge in the vermireactors. Similar observations had been reported by Elvira et al. (1998), Garge and Priya (2003) for E. andrei and on E. foetida by Kaushik and Garg (2004) in textile mill sludge vermistabilization.
Figure 1: Viability of earthworm (numbers) in various concentration of textile sludge mixture with cowdung : All values are mean (n=3) ± S.D Viability earthworm in different vermireactors during the experiment of 12 weeks are different feed mixture of textile sludge and cow dung
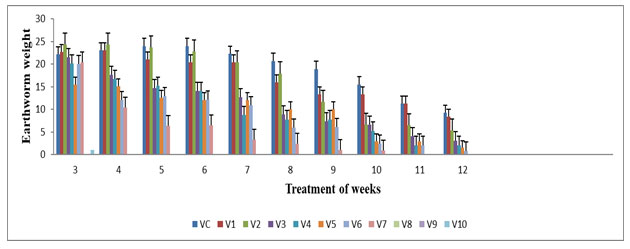
The highest earthworm weight was observed in V1 (22.2 ±0.00), V2 (24±0.39) & V3 (21.56±0.76) during 4th week and lowest worm weight was observed in V4 (7.8±0.03), V5 (10.03±0.03), V6 (5.93±0.03) & V7 (2.43±0.23) during 8th week of the experiment period (Figure 2) .The worm’s weight at concentrations of feed mixture was statistically different (p≤0.05). Significant changes were observed in V1 & V2 on 8th week; in V3, V4, V5, V6 & V7 for the 6th week compared with all vermireactors from the 1st week up to 12th week of the experimental period. The earthworm weight showed insignificant decreased from V0 to V3 from 6th week and V4 to V7 from 2nd week of the experimental period. The loss in worm weight can be recognized to the exhaustion of food Renuka and Garg (2007). When E. eugeniae conventional the food under a maintenance level, it lost weight at a rate which depended upon the quantity and nature of its ingestible substrates by Yadav and Garg (2009) .This was in compatibility with the study carried out by Neuhauser et al. 1980; Renuka et al (2007) in E. foetida.
Figure 2: Earthworm weight (g) in various concentration of textile sludge mixture with cow dung. All values are mean (n=3) ± S.D Earthworm weight in different vermireactors during the experiment of 12 weeks are different feed mixture of textile sludge and cow dung
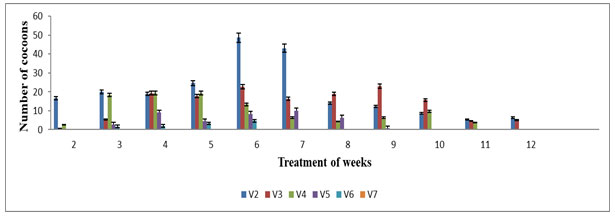
The cocoon production started from the 2nd week up to 12th week of the experiment. The highest number of cocoon was noted in V1 (48±1.11) and V2 (43±1.00) on 8th week and V0 (36.33±1.45) on 6th week during the experimental periods. The lowest cocoons production was observed in V4 (3.00±0.33) on 10th week and V5 (1.33±0.33) in 6th week as well as V6 (4.66±0.33), while no cocoons production was observed in V7, V8, V9 and V10 (Figure 3). The cocoon production in various concentrations of feed mixture was also statistically significant (p≤0.05). The differences among rates of cocoon production in different vermireactors could be related to the biochemical quality of the feed mixtures, which was one of the important factors in determining the onset of cocoon production Edwards et al (1998). Results reveal the maximum cocoon production in V2 at 7th week during the entire treatment period. The results recommend that if higher proportion of TS added, it could not be suitable for cocoon production by E.eugeniae. Similar results were also observed by Sartaj et al (2014) on Press Mud (PM) where it is found that the higher percentage of PM in the feed mixtures significantly affected cocoon production and delayed the sexually maturity and reproduction of E.fetida.
Figure 3: Number of cocoon production in various concentration of textile sludge mixture with cow dung : All values are mean (n=3) ± S.D Cocoon production in different vermireactors during the experimental period of 12 weeks are feed mixture of textile sludge and cow dung V8, V9 & V10 were not plotted in the graph since no cocoon production was observed throughout the experiment period.
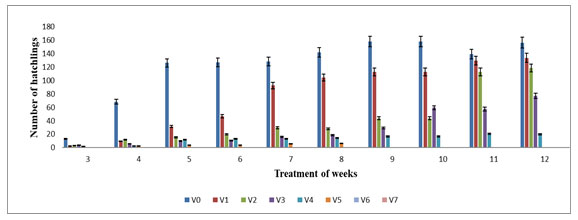
The hatchling started from the 4th week of experiment in V1, V2, V3, V4, V5 and V0. The highest number of hatchling were observed in V1 (126.05±0.06), V2 (118.33±0.20) and V3 (37.33±6.65) on 12th week followed by V0 with 156.33±2.62 while the lowest number of hatchling was observed in V5 (6.33±0.33) on 8th week. It was observed that hatchling had gradually increased in V1, V2, V3 and V4 except V5 (Figure 4). The hatchling production in various concentrations of feed mixture was also statistically significant (p≤0.05). The hatchling production was not observed in V6, V7, V8, V9 and V10 which may be due to high concentration of TS. Thus present study shows that higher proportion of TS could not suitable for hatchling production by E. eugeniae. The maximum number of hatchlings in V4 was supported by the studies conducted by Bhat et al (2015) where maximum number of hatchlings was observed in 60 – 100% amendment of cow dung with sugar beet mud in E. fetida.
Figure 4: Hatchling production in different various concentration of textile sludge mixture with cow dung
In the present study, a decrease of pH was observed in the final product with maximum decrease in V2 (6.57%) and minimum in V6 (1.67%). The pH showed significant difference (p≤0.05) in different concentration of feed mixtures (Table 2 and 2 a ). The lower level of pH in the final vermicompost is attributed to the production of CO2 and organic acids by microbial activity through the process of bioconversion of various substrates in the feed given to earthworms (Gupta and Garg 2007). The pH change towards neutral is attributed to mineralization of the nitrogen and phosphorus into nitrites/ nitrates and orthosphates and bioconversion of the organic materials into intermediate species of organic acids (Yadav and Garg 2009).
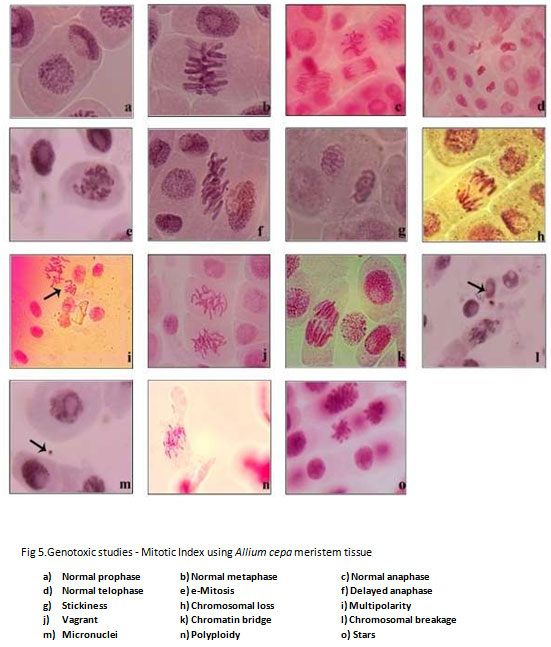
Figure 5: Genotoxic studies – Mitotic Index using Allium cepa meristem tissue
The electrical conductivity (EC) was found to be significantly decreased in vermicompost as compared to initial feed mixture. The maximum decrease in EC was observed in V1, V2, V3, V4, V5, and V6 while minimum decrease was observed in V7, V8, V9 and V10. Decrease in EC in vermicompost is due to stabilization of mixtures. Singh et al. (2010) also observed a decline in EC in the vermicompost from the bio sludge of a beverage industry. Bhat et al (2015) have reported that the acceptance limit of EC for plant growth as 4.0 m Scm−1 and our results are in accordance to it.
The total dissolved solids (TDS) were found to be significantly decreased in vermicompost when compared to initial the initial feed mixture. Minimum decrease was observed in V8 (0.33%) and maximum decrease of TDS was observed in V4 (52.15 %). The calcium significantly increased in vermicompost as compared to initial feed mixture and the maximum increase was observed in V1 (182.35%) and minimum increase in V4 (10.27%). Previous study have found calcium metabolism in earthworm is mostly associated with gut secreted enzymes (Suthar 2010).
A significant increase (p≤0.05) in K in final product was observed as compared to the initial feed mixture in all different concentration. Maximum increase in potassium was observed in V4 (132.3%) and lowest was in V9 (7.09%). Most of previous report on vermicompost have reported a higher K at the end of experiment (Khwairakpam and Bhargava 2009; Hait and Tare 2011). The acid production by microorganism is the major role for solubilizing of insoluble potassium. It is evident that the inoculation of earthworms in waste feedstock enhances the waste mineralization process. Basically organic waste, during the respiration period pass through the earthworm gut and some fraction of minerals is changed in to the additional available nutrients (i.e exchangeable forms) due to the work endogenic and/or exogenic enzyme (Suthar et a., 2012).
Results reveal the significant increase (p≤0.05) of phosphorus content after inoculation of earthworm. V2 showed highest increase in with 242% and V9 showed a minimum increase of 19.41%. The increase in P is possibly due to activities of P-solubilizing bacteria and enzymatic activities of earthworm gut (Garg et al 2005; Suthar 2012). The level of P in the final product indicates that the vermistabilized sludge is ready as soil amendment material.
The C: N ratio is an important indicator of vermicompost maturity. In this study the C: N ratio of vermicompost material was significantly low than initial substrates. Decline in C: N ratio in this study was due to higher loss of carbon through microbial respiration in the form of CO2 along with an increase in nitrogen and stabilization of waste by the action of E. eugeniae. Similar results were observed by Bhat et al. (2014). Earlier studies suggest that a C: N ratio below 20 is an indicative of acceptable maturity, while a ratio of 15 or lower is being preferred for agronomic use of composts. The vermicompost obtained in this study showed C: N ratio within the preferable limits as described by Morais and Queda (2003).
Table 1. Initial Physico- chemical parameters of raw textile sludge and cow dung (Mean ±SE)
| S. No. | Physico-chemical parameters | Textile sludge
(TS) |
Cow dung
(CD) |
| 1 | pH | 8.78±0.10 | 7.69±0.24 |
| 2 | EC(Ms/cm) | 12.32±0.04 | 12.54±0.40 |
| 3 | TDS( mg/L) | 21.83±2.09 | 1.84±0.05 |
| 4 | Na(g/kg) | 3.43±0.22 | 3.60±0.09 |
| 5 | K(g/kg) | 0.15±0.02 | 6.88±0.11 |
| 6 | Ca(g/kg) | 274.47±4.00 | 18.48±0.54 |
| 7 | OC(g/kg) | 5.93±0.15 | 38.15±0.74 |
| 8 | P(g/kg) | 1.48±0.24 | 1.68±0.62 |
| 9 | N(g/kg) | 9.47±0.64 | 16.12±0.22 |
| 10 | C:N ratio | 0.85±0.18 | 2.55±0.38 |
| 11 | Zn(mg/g) | 2.41±0.07 | 1.1±0.10 |
| 12 | Cu(mg/g) | 1.8±0.11 | 0.88±0.08 |
| 13 | Cr(mg/g) | 1.02±0.06 | 0.15±0.01 |
| 14 | Fe(mg/g) | 8.07±1.19 | 1.03±0.16 |
The nitrogen content was significantly increased (p≤0.05) in all feed mixture at end of the experiment. N Maximum increase was observed in V2 (61.65%) and minimum was observed in V6 (12.01%). Generally body secretions of earthworm (excreta, mucus) add nitrogen in substrate if earthworms were inoculated in organic wastes for longer periods. Earthworms also alter the microclimatic conditions of vermireactors which consequently promote microbial populations responsible for nitrogen enrichment (Suthar et al. 2012). Hence in the present study the combination of the organic waste CD and textile sludge acted as good energy stuff for nitrogen fixing bacteria enhanced by E. eugeniae.
Organic carbon in the final product was significantly reduced when compared with the initial feed mixtures. The maximum reduction in OC was observed in V2 (21.12%) and minimum reduction was observed in V10 (2.06%). Reduction may be due to combined action of earthworm and microorganisms where the loss for organic carbon from the initial waste is in the form of release of CO2 by respiration of earthworms. Kaviraj and Sharma (2003) reported 45% loss of carbon during vermicomposting of municipality and industrial wastes. Similarly, Prakash and Karmegam (2010) reported reduction of OC in vermicomposting of sugar industry waste. Vermicomposting brings about significant reduced in TOC level of the waste property and accelerates waste stabilization process (Singh and Suthar 2012; Hait and Tare 2011).
The sodium content was significantly increased (p≤0.05) in all feed mixture with maximum increase in V3 (77.31%) and minimum in V9 (16.37%). Our results are in corroboration with Singh et al. (2010).The heavy metal analysis reveals Cu, Cr, Zn and Fe decreased from initial feed mixture to final product of vermicomposting (Table 2 and 2 a ). Reduction in the heavy metal concentrations could be related to discharge of these cations by excess water drainage (Garg etal. 2003). Genotoxic effects of textile sludge on meristematic cells of A.cepa were estimated on the basis of mitotic index and chromosomal aberrations.The root length was observed in different concentration of pre and post vermicomposting of textile sludge along with negative and positive controls after five days of exposure. The average root length of onion in the positive and negative controls was (2.80±0.52) and (8.30±0.36) respectively. The increase in root length was observed in post-vermicompost as compared to initial textile sludge extract. The maximum root length was observed at 10% (8.50±0.61), 20% (8.06±1.00) and 30% (7.00±1.00) concentration of post–vermicompost while minimum root length was observed at the 100% TS (4.60±0.45) post-vermicompost (Table. 3). By observing the results it can be concluded that vermistabilization reduce toxic effect of textile sludge. In the A.cepa test, inhibition of root development and the appearance of stunted roots indicate retardation of growth and cytotoxicity while root wilting explain toxicity (Sartaj et al 2014).
Table 2. Initial and final physico-chemical parameters (mean ±SE) different proportion of textile sludge mixed with cow dung*
| Parameters | VC | V1 | V2 | V3 | V4 | |
| pH | Initial | 7.49±0.06 | 7.72±0.13 | 7.81±0.06 | 7.85±0.60 | 7.97±0.07 |
| Final | 6.58±1.14 | 6.78±0.11 | 7.06±0.11 | 7.25±0.01 | 7.19±0.00 | |
| % change | -12.14 | -12.17 | -10.74 | -7.60 | -8.40 | |
| EC (µs) | Initial | 5.87±0.09 | 5.78±0.12 | 5.39±0.40 | 5.89±0.58 | 5.41±0.21 |
| Final | 2.26±0.05 | 2.09±0.00 | 3.46±0.05 | 4.11±0.00 | 4.99±0.01 | |
| % change | -61.49 | -65.05 | -35.80 | -30.22 | -7.76 | |
| TDS mg/ml | Initial | 3.91±0.64 | 4.87±0.16 | 4.25±0.05 | 5.57±1.37 | 5.56±1.40 |
| Final | 1.73±0.34 | 1.59±0.00 | 2.26±0.25 | 2.52±0.28 | 2.29±0.00 | |
| % change | -55.75 | -67.35 | -46.82 | -54.67 | -53.41 | |
| Ca g/kg | Initial | 18.14±0.06 | 19.50±0.53 | 36.11±1.00 | 73.89±0.54 | 114.34±0.91 |
| Final | 25.46±0.55 | 55.06±9.13 | 59.27±0.17 | 99.26±0.33 | 122.59±5.79 | |
| % change | 40.35 | 182.35 | 62.13 | 34.33 | 7.21 | |
| K(g/kg) | Initial | 3.70±1.12 | 3.86±1.90 | 3.14±0.10 | 2.99±0.00 | 2.97±0.40 |
| Final | 9.33±0.57 | 7.99±0.11 | 7.87±0.27 | 6.88±0.98 | 6.90±0.27 | |
| % change | 152.16 | 141.88 | 150.63 | 130.10 | 132.32 | |
| P (g/kg) | Initial | 1.88±0.96 | 1.52±0.52 | 1.43±0.88 | 1.48±0.46 | 1.20±0.10 |
| Final | 4.30±0.60 | 4.10±0.17 | 4.33±0.57 | 3.22±0.06 | 2.99±0.30 | |
| % change | 128.91 | 164.51 | 202.79 | 117.56 | 149.16 | |
| C:N g/kg | Initial | 2.53±0.22 | 2.51±0.72 | 2.34±0.36 | 2.43±0.14 | 1.64±0.07 |
| Final | 0.66±0.11 | 0.91±0.06 | 0.89±0.08 | 0.96±0.07 | 0.89±0.25 | |
| % change | -73.91 | -63.74 | -63.63 | -60.43 | -45.73 | |
| N g/kg | Initial | 17.08±0.94 | 16.99±1.00 | 16.29±0.61 | 16.84±1.09 | 16.78±0.08 |
| Final | 27.38±1.40 | 26.17±1.48 | 25.36±0.54 | 25.61±2.19 | 21.89±1.35 | |
| % change | 60.30 | 54.03 | 55.67 | 52.07 | 30.45 | |
| OC g/kg | Initial | 43.25±2.19 | 44.33±9.80 | 45.89±2.30 | 41.21±0.51 | 28.18±1.34 |
| Final | 18.07±1.40 | 28.47±2.58 | 26.14±1.75 | 26.13±0.04 | 19.40±4.08 | |
| % change | -58.21 | -32.74 | -43.03 | -36.59 | -32.15 | |
| Cu (mg/kg) | Initial | 1.24±0.04 | 1.49±0.43 | 1.57±0.35 | 1.72±0.30 | 1.56±0.19 |
| Final | 0.51±0.44 | 0.99±0.09 | 1.05±0.11 | 1.08±0.06 | 1.15±0.11 | |
| % change | -86.29 | -33.55 | -33.12 | -37.20 | -26.28 | |
| Cr (mg/kg) | Initial | 0.38±0.01 | 0.56±0.90 | 0.74±0.12 | 0.88±0.00 | 0.93±0.05 |
| Final | 0.17±0.01 | 0.19±0.01 | 0.20±0.01 | 0.23±0.01 | 0.26±0.13 | |
| % change | -.55.26 | -66.07 | -72.97 | -73.86 | -72.04 | |
| Zn (mg/kg) | Initial | 2.63±0.12 | 2.59±0.51 | 2.79±0.16 | 2.84±0.26 | 2.92±0.23 |
| Final | 0.53±0.00 | 1.37±0.29 | 1.58±0.04 | 1.66±0.17 | 1.60±0.11 | |
| % change | -79.84 | -38.99 | -43.36 | -41.54 | -45.20 | |
| Fe (mg/kg) | Initial | 0.80±0.06 | 1.90±0.34 | 2.81±0.37 | 2.85±0.12 | 2.96±0.06 |
| Final | 0.40±0.08 | 0.17±0.28 | 0.58±0.39 | 0.78±0.00 | 2.08±0.13 | |
| % change | -50 | -91.05 | -79.35 | -72.63 | -29.72 |
Weight in (g/kg) and (mg/kg) Significance level was determined by Tukey test p ≤ 0.0*
Table 2 a. Initial and final physico-chemical parameters (mean ± SE) different proportion of textile sludge mixed with cow dung*
| Parameters | V5 | V6 | V7 | V8 | V9 | V10 | |
| pH | Initial | 7.95±0.60 | 7.96±0.06 | 7.98±0.07 | 8.19±0.03 | 8.42±0.40 | 8.50±0.03 |
| Final | 7.41±0.00 | 7.52±0.02 | 7.84±0.11 | 7.95±0.00 | 7.96±0.00 | 7.95±0.00 | |
| % change | -6.20 | -1.01 | -.1.38 | -2.95 | -5.46 | -.2.92 | |
| EC (µs) | Initial | 6.20±0.51 | 7.35±0.03 | 7.21±0.18 | 7.65±0.00 | 7.42±0.39 | 7.96±0.09 |
| Final | 5.87±0.56 | 7.18±0.00 | 7.04±0.06 | 7.14±0.12 | 7.17±0.29 | 7.86±0.23 | |
| % change | -5.32 | -2.31 | -2.35 | -6.66 | -3.23 | -1.25 | |
| TDS mg/ml | Initial | 6.16±1.57 | 6.66±1.57 | 7.62±0.54 | 7.66±0.41 | 13.2±3.46 | 15.80±1.32 |
| Final | 2.73±0.05 | 3.66±0.25 | 3.52±0.41 | 7.75±0.33 | 7.43±0.40 | 7.91±0.21 | |
| % change | -55.68 | -45.04 | -53.80 | -1.17 | -43.71 | -49.93 | |
| Ca g/kg | Initial | 147.81±0.51 | 156.41±0.50 | 164.30±1.09 | 164.75±4.58 | 171.30±11.5 | 171.47±10.1 |
| Final | 204.15±0.17 | 235.80±0.59 | 289.44±0.49 | 289.55±0.55 | 287.48±0.15 | 288.63±0.30 | |
| % change | 43.89 | 85.05 | 75.44 | 75.33 | 67.82 | 68.32 | |
| K(g/kg) | Initial | 2.96±0.69 | 2.88±0.12 | 2.09±0.84 | 1.53±0.12 | 1.55±0.10 | 1.56±0.17 |
| Final | 6.20±0.50 | 5.21±0.23 | 4.86±0.05 | 1.92±0.12 | 1.94±0.06 | 1.95±0.06 | |
| % change | 109.45 | 80.90 | 132.53 | 25.49 | 25.16 | 24.99 | |
| P (g/kg) | Initial | 1.19±0.22 | 1.23±0.36 | 1.16±0.14 | 1.08±0.07 | 1.03±0.04 | 0.99±0.00 |
| Final | 2.85±0.05 | 2.69±0.33 | 2.22±0.23 | 1.40±0.19 | 1.23±0.00 | 1.17±0.06 | |
| % change | 139.49 | 118.69 | 91.37 | 29.62 | 19.41 | 18.81 | |
| C:N g/kg | Initial | 1.34±0.12 | 1.54±0.07 | 1.01±0.10 | 0.99±0.07 | 0.98±0.40 | 0.96±0.03 |
| Final | 0.72±0.06 | 0.69±0.04 | 0.94±0.06 | 0.92±0.12 | 0.91±0.07 | 0..89±0.10 | |
| % change | -45.26 | -55.19 | -6.93 | -7.07 | -7.14 | -10.10 | |
| N g/kg | Initial | 14.40±0.52 | 13.77±0.58 | 13.40±1.21 | 9.15±0.45 | 9.52±0.42 | 9.40±1.22 |
| Final | 18.84±1.10 | 17.36±0.35 | 15.01±0.00 | 12.61±0.58 | 12.34±0.58 | 11.77±1.41 | |
| % change | 30.83 | 26.07 | 12.01 | 37.81 | 29.62 | 25.21 | |
| OC g/kg | Initial | 19.40±0.86 | 21.24±0.54 | 13.61±0.40 | 12.76±0.40 | 11.65±0.16 | 12.43±0.18 |
| Final | 13.98±0.00 | 12.52±0.15 | 12.63±0.61 | 10.48±0.06 | 9.62±0.32 | 9.41±0.61 | |
| % change | -27.93 | -41.05 | -.7.20 | -17.86 | -17.42 | -24.29 | |
| Cu (mg/kg) | Initial | 1.85±0.22 | 2.29±0.32 | 2.34±0.40 | 2.50±0.34 | 2.60±0.56 | 2.37±0.47 |
| Final | 1.37±0.01 | 1.58±0.00 | 1.68±0.00 | 1.77±0.02 | 1.90±0.01 | 1.87±0.01 | |
| % change | -25.94 | -31.00 | -32.80 | -29.2 | -26.92 | -21.09 | |
| Cr (mg/kg) | Initial | 0.99±0.01 | 0.99±0.01 | 0.96±0.05 | 1.14±0.06 | 1.40±0.41 | 1.44±0.50 |
| Final | 0.30±0.08 | 0.42±0.11 | 0.62±0.22 | 0.82±0.21 | 0.81±0.22 | 0.93±0.38 | |
| % change | -69.69 | -57.57 | -35.41 | -28.07 | -28.07 | -35.41 | |
| Zn (mg/kg) | Initial | 3.36±0.46 | 3.38±0.39 | 3.40±0.40 | 3.80±0.51 | 3.85±0.61 | 3.88±0.32 |
| Final | 1.65±0.03 | 1.77±0.00 | 1.82±0.11 | 1.87±0.02 | 2.00±0.11 | 2.37±0.54 | |
| % change | -52.31 | -47.63 | -46.47 | -50.78 | -48.05 | -30.29 | |
| Fe (mg/kg) | Initial | 2.96±0.06 | 3.06±0.40 | 3.25±0.55 | 4.34±0.12 | 4.38±0.24 | 4.53±0.39 |
| Final | 2.41±0.00 | 2.74±0.04 | 2.89±0.00 | 4.04±0.01 | 4.08±0.02 | 4.09±0.00 | |
| % change | -18.58 | -10.45 | -11.07 | -6.91 | -6.84 | -9.71 |
Weight in (g/kg) and (mg/kg) Significance level was determined by Tukey test p ≤ 0.05
Table 3. Root length of Allium cepa (mean±SE) exposed to pre-compost Extract and post-compost (100%) textile sludge
| Concentration (%) | Pre compost
Root length(cm) |
Post compost
Root length(cm) |
| PC | 2.80±0.52 | 2.80±0.52 |
| NC | 8.30±0.36 | 8.30±0.36 |
| 10% | 6.70±0.55 | 8.50±0.61 |
| 20% | 5.63±0.55 | 8.06±1.00 |
| 30% | 4.86±0.23 | 7.00±1.00 |
| 40% | 4.33±0.57 | 6.80±0.72 |
| 50% | 3.99±0.00 | 6.33±0.57 |
| 60% | 3.73±0.15 | 6.76±1.04 |
| 70% | 3.96±0.05 | 6.60±1.03 |
| 80% | 3.33±0.57 | 5.33±1.36** |
| 90% | 3.66±0.41 | 5.43±0.45* |
| 100% | 3.06±1.00 | 4.60±0.45** |
NC = negative control (distilled water), PC =positive control (Fresh ST), Signification level was determined by t- test *p≤0.01. **p≤0.05
The total number of dividing cells in the cell cycle is the characteristics of Mitotic Index (MI) and in this study the MI increased as the concentration of the TS increased. (Table 4 ). The MI was maximum during 6 h exposure on 10%, 20%, 30% post-vermicompost extract. It is observed that the lesser the concentration of the textile sludge the lesser was the impact on the roots. Higher the concentration of TS showed higher abnormalities on root meristem cells. MI decrease in the A. cepa test has been reported by Jiang and Liu (2000); Jain et al. (2004) and Sartaj et al. (2014) and they have correlated the decrease of MI to exposure with heavy metals in the feed mixture. The significantly less MI of all the treatment groups when compared to the negative controls reflects an alteration in chromosomes due to the adverse effect of substances in the TS on the growth and development of exposed cells.
Table 4. Mitotic index values (mean± SE) in control and different concentration of Pre-vermicompost and post vermicompost textile sludge extract.
| Concentration | Mitotic index in pre-vermicompost a | Mitotic index in post-
vermicompost b |
| NC | 12.46±2.73 | 12.46±2.73 |
| PC | 2.06±0.11 | 2.06±0.11 |
| 10 % 3 h | 7.16±0.05 | 10.33±0.57 |
| 6 h | 7.66±0.57 | 10.63±1.09 |
| 20 % 3 h | 7.53±0.57 | 9.73±20.70 |
| 6 h | 7.33±0.41 | 9.33±1.52 |
| 30 % 3 h | 6.40±0.69 | 8.83±1.25 |
| 6 h | 7.86±0.61 | 9.56±2.18** |
| 40 % 3 h | 5.66±1.03 | 6.66±1.15* |
| 6 h | 6.06±1.81 | 6.93±1.00* |
| 50 % 3 h | 5.66±1.30 | 6.40±2.16** |
| 6 h | 6.65±1.44 | 7.60±0.87** |
| 60% 3 h | 4.66±0.83 | 4.86±0.64** |
| 6 h | 4.46±0.41 | 5.73±0.30** |
| 70% 3 h | 3.90±0.23 | 4.46±0.23** |
| 6 h | 4.20±0.20 | 4.80±0.20** |
| 80% 3 h | 3.36±0.70 | 4.20±0.20** |
| 6 h | 3.73±0.61 | 4.86±0.83** |
| 90% 3 h | 3.60±0.34 | 4.20±0.50** |
| 6 h | 3.80±0.11 | 4.40±0.34** |
| 100% 3 h | 2.40±0.40 | 2.80±0.52** |
| 6 h | 2.60±0.69 | 3.06±0.80** |
NC Negative control (distilled water); PC= Positive control (fresh ST); aFrom each group 3000-5000 cells were scored to determine MI; bFrom each group 4000-6500 cells were scored to determine MI; The level of significance was determined by t- test:*p≤0.01 **p≤0.05
The chromosomal aberrations were studied by using A. cepa root meristem cells exposure to pre- and post-vermicompost TS extract. (Table 5 and 5a) Results reveal that the levels of aberration in concentration-dependent as the post-compost showed significantly reduced aberration. The aberration percentage was highest in the pre-compost of V10 (100% TS) with 28.8 percent and it reduced to 24 percent after vermistabilization. Abnormalities such as C-mitosis, delayed anaphase, stickiness, chromosomal loss, multipolarity, vagrant, chromatin bridge, chromosomal breakage, micronuclei, polyploidy, and stars were observed. This is corroboration with the findings Dixit and Nerle (1985); Joshi and Singh (1989); Qian (2004) and Sartaj et al (2014) reported that the increase in the concentration of various effluents increased the aberration rate. It is evident from the results that the raw textile sludge has Genotoxicity potential and the proposed vermistabilization has the potential to mitigate the effect that arises through land filling or dumping of textile industry sludge.
Table 5. Different Chromosomal Aberration and nuclear abnormalities in the root meristem cells of Allium cepa exposed to pre-vermicompost and post-vermicompost textile sludge extract*.
| Chromosomal
Aberration |
Negative control | Positive control | 10% | 20% | 30% | 40% | |||||
| No .of aberrant
cells |
No. of aberrant cells | No .of aberrant
cells |
No .of aberrant
cells |
No .of aberrant
cells |
No .of aberrant
Cells |
||||||
| 3h | 6 h | 3h | 6h | 3h | 6h | 3h | 6h | ||||
| Different Chromosomal Aberration and nuclear abnormalities in pre-vermicompost | |||||||||||
| C- Mitosis | 0 | 23 | 5 | 5 | 6 | 7 | 9 | 9 | 11 | 11 | |
| Delayed anaphase | 2 | 10 | 3 | 4 | 4 | 6 | 6 | 6 | 8 | 8 | |
| Stickiness | 1 | 17 | 3 | 3 | 3 | 7 | 9 | 8 | 10 | 11 | |
| Chromosomal loss | 1 | 21 | 2 | 5 | 2 | 1 | 3 | 5 | 6 | 7 | |
| Multipolarity | 1 | 8 | 1 | 2 | 1 | 2 | 4 | 5 | 4 | 4 | |
| Vagrant | 1 | 9 | 2 | 3 | 4 | 4 | 5 | 7 | 2 | 4 | |
| Chromatin bridge | 5 | 23 | 5 | 6 | 5 | 6 | 8 | 8 | 10 | 12 | |
| Chromosomal breakage | 3 | 22 | 4 | 5 | 6 | 6 | 7 | 9 | 6 | 6 | |
| Micronuclei | 0 | 4 | 0 | 0 | 2 | 1 | 1 | 1 | 3 | 3 | |
| Polyploidy | 0 | 5 | 1 | 1 | 1 | 1 | 1 | 2 | 3 | 2 | |
| Stars | 0 | 0 | 0 | 0 | 1 | 1 | 0 | 0 | 0 | 0 | |
| Total aberration | 14 | 151 | 26 | 28 | 36 | 37 | 56 | 60 | 65 | 68 | |
| Percent aberration (%) | 2.8 | 30.2 | 5.2 | 5.6 | 7.2 | 7.4 | 11.2 | 12 | 13 | 13.6 | |
| Different Chromosomal Aberration and nuclear abnormalities in post-vermicompost | |||||||||||
| C- Mitosis | 0 | 23 | 0 | 1 | 1 | 2 | 3 | 5 | 6 | 6 | |
| Delayed anaphase | 2 | 10 | 1 | 2 | 2 | 2 | 3 | 4 | 5 | 7 | |
| Stickiness | 1 | 17 | 1 | 2 | 2 | 2 | 4 | 4 | 5 | 7 | |
| Chromosomal loss | 1 | 21 | 1 | 1 | 2 | 1 | 3 | 3 | 5 | 6 | |
| Multipolarity | 1 | 8 | 1 | 1 | 1 | 1 | 1 | 1 | 1 | 1 | |
| Vagrant/s | 1 | 9 | 2 | 1 | 1 | 1 | 3 | 2 | 2 | 4 | |
| Chromatin bridge | 5 | 23 | 2 | 2 | 2 | 5 | 4 | 5 | 4 | 3 | |
| Chromosomal breakage | 3 | 22 | 2 | 2 | 2 | 3 | 3 | 4 | 6 | 6 | |
| Micronuclei | 0 | 4 | 1 | 1 | 2 | 2 | 2 | 2 | 1 | 3 | |
| Polyploidy | 0 | 5 | 0 | 0 | 1 | 1 | 1 | 1 | 1 | 1 | |
| Stars | 0 | 0 | 0 | 0 | 0 | 0 | 0 | 0 | 0 | 0 | |
| Total aberration | 14 | 151 | 10 | 13 | 16 | 18 | 27 | 30 | 35 | 41 | |
| Percent aberration % | 2.8 | 30.2 | 2 | 2.6 | 3.2 | 3.6 | 5.4 | 6 | 7 | 8.2 | |
Table 5a. Different Chromosomal Aberration and nuclear abnormalities in the root meristem cells of Allium cepa exposed to pre-vermicompost and post-vermicompost textile sludge extract*.
| Chromosomal
Aberration |
50% | 60% | 70% | 80% | 90% | 100% | ||||||||||
| No .of aberrant
cells |
No. of aberrant cells | No .of aberrant
cells |
No .of aberrant
cells |
No .of aberrant
cells |
No .of aberrant
Cells |
|||||||||||
| 3h | 6 h | 3h | 6 h | 3h | 6h | 3h | 6h | 3h | 6h | |||||||
| Different Chromosomal Aberration and nuclear abnormalities in pre-vermicompost | ||||||||||||||||
| C- Mitosis | 13 | 14 | 15 | 16 | 18 | 17 | 19 | 19 | 21 | 21 | 20 | 20 | ||||
| Delayed anaphase | 10 | 11 | 10 | 12 | 10 | 11 | 11 | 12 | 12 | 13 | 13 | 15 | ||||
| Stickiness | 11 | 11 | 11 | 12 | 14 | 15 | 16 | 16 | 12 | 14 | 15 | 15 | ||||
| Chromosomal loss | 9 | 10 | 12 | 12 | 14 | 16 | 16 | 17 | 19 | 19 | 20 | 21 | ||||
| Multipolarity | 5 | 6 | 5 | 6 | 3 | 3 | 4 | 7 | 7 | 6 | 8 | 8 | ||||
| Vagrant | 6 | 7 | 9 | 9 | 11 | 12 | 8 | 7 | 10 | 11 | 6 | 8 | ||||
| Chromatin bridge | 12 | 13 | 13 | 17 | 19 | 18 | 20 | 20 | 20 | 21 | 24 | 20 | ||||
| Chromosomal breakage | 7 | 8 | 11 | 11 | 16 | 16 | 21 | 22 | 23 | 24 | 22 | 22 | ||||
| Micronuclei | 2 | 2 | 4 | 4 | 3 | 3 | 4 | 5 | 6 | 7 | 6 | 7 | ||||
| Polyploidy | 2 | 2 | 3 | 4 | 3 | 5 | 4 | 4 | 5 | 5 | 7 | 7 | ||||
| Stars | 0 | 0 | 1 | 3 | 1 | 1 | 0 | 0 | 0 | 0 | 0 | 0 | ||||
| Total aberration | 77 | 84 | 95 | 106 | 114 | 117 | 123 | 129 | 135 | 138 | 139 | 144 | ||||
| Percent aberration (%) | 15.4 | 16.8 | 19 | 21.2 | 22.8 | 23.4 | 24.6 | 25.8 | 27 | 27.6 | 27.8 | 28.8 | ||||
| Different Chromosomal Aberration and nuclear abnormalities in post-vermicompost | ||||||||||||||||
| C- Mitosis | 5 | 6 | 8 | 10 | 12 | 14 | 15 | 16 | 18 | 20 | 20 | 23 | ||||
| Delayed anaphase | 9 | 10 | 9 | 10 | 8 | 9 | 10 | 9 | 10 | 11 | 10 | 12 | ||||
| Stickiness | 4 | 6 | 4 | 8 | 9 | 9 | 10 | 12 | 12 | 14 | 13 | 15 | ||||
| Chromosomal loss | 4 | 7 | 10 | 10 | 10 | 10 | 12 | 14 | 13 | 15 | 17 | 18 | ||||
| Multipolarity | 1 | 1 | 1 | 1 | 2 | 2 | 1 | 3 | 2 | 1 | 1 | 2 | ||||
| Vagrant/s | 3 | 5 | 2 | 5 | 6 | 8 | 8 | 9 | 10 | 13 | 12 | 12 | ||||
| Chromatin bridge | 6 | 8 | 10 | 9 | 11 | 13 | 12 | 17 | 20 | 18 | 21 | 20 | ||||
| Chromosomal breakage | 5 | 7 | 8 | 9 | 10 | 12 | 13 | 12 | 16 | 17 | 20 | 15 | ||||
| Micronuclei | 1 | 1 | 1 | 2 | 4 | 3 | 3 | 3 | 4 | 4 | 2 | 2 | ||||
| Polyploidy | 1 | 1 | 2 | 2 | 0 | 1 | 0 | 0 | 1 | 1 | 1 | 1 | ||||
| Stars | 0 | 0 | 0 | 0 | 0 | 0 | 0 | 0 | 0 | 0 | 0 | 0 | ||||
| Total aberration | 39 | 44 | 51 | 66 | 72 | 81 | 83 | 92 | 106 | 118 | 113 | 120 | ||||
| Percent aberration % | 7.8 | 8.8 | 10.2 | 13.2 | 14.4 | 16.2 | 16.6 | 18.4 | 21.2 | 23.6 | 22.6 | 24 | ||||
* Out of 500 cells examined
CONCLUSION
The use of textile sludge as raw material in the vermistabilization system can potentially help to convert the waste into a value added final product and the preeminent growth and fecundity of Eudrilus eugeniae in CD 70: TS 30 is an evident for it. The study revealed that vermicompost produced from E. eugeniae possessed higher nutrient content, lower C/N ratio, and lower electrical conductivity. Further the genotoxicity study clearly indicate that the vermitechnology reduced the toxicity potential of raw TS. It also reflects the potential of the earthworm E. eugeniae to convert raw textile sludge into nutrient- rich manure and play a major role in solid waste management.
ACKNOWLEDGEMENTS
The authors would like to acknowledge the TDT Division, Department of Science and Technology (DST), New Delhi, India [Grant No:DST/TDT/WMT/2017/054] and Tamil Nadu State Council for Science and Technology (TNSCST), Tamil Nadu, India [Grant No. TNSCST/S&T projects/VR/ES/2012-2013-200 dated 10.05.2013] for the financial support. The authors are grateful to the Dr. K. Anbarasu, Director of Studies and Shri. K. Ragunathan, the Secretary of National College (Autonomous), Tiruchirappalli, India, for all their constant support and encouragement in the pursuit of this research.
Conflict of Interest: The authors declare that they have no conflict of interest
REFERENCES
Arillo A and Melodia F (1991) Reduction of hexavalent chromium by the earthworm E.fetida. (Savigny). Ecotoxicology and Environmental Safety Vol 57 Page 391-394.
Bhat S A Singh J and Vig A P (2015) Vermistabilization of sugar beet (Beta vulgaris L) waste produced from sugar factory using earthworm Eisenia fetida: Genotoxic assessment by Allium cepa test. Environmental Science and Pollution Research. Vol 22 Page 11236–11236.
Chandrakant R Holkar Ananda J Jadhav Dipak V Pinjari Naresh M Mahamuni Aniruddha B Pandit Journal of Environmental Management Vol 182 Page 351-366
Elvira C Sampedro L Benitez E and Nogales R (1998) Vermicomposting of sludges from paper mill and dairy industries with Eisenia andrei: a pilot study. Bioresource Technology. Vol 63 page 205–211
Fernandes T C Mazzeo D E C Marin-Morales M A (2007) Mechanism of micronuclei formation in polyploidizated cells of Allium cepa exposed to trifluralin herbicide. Pesticide Biochemistry and Physiology . Vol 88 Page 252-259.
Ferrari B Radestski C M Veber A M Ferard J F (1999) Ecotoxicologcal assessment of solid waste: a combined liquid and solid phase testing approach using a battery of bioassay and biomarkers. Environmental Toxicology Chemistry. Vol 18 Page 1195-1202
Fischer E Koszous L (1992) Sublethal, accumulation capacities and elimination rates of As, Hg and Se in the manure worms Eisenia fetida. Pedobiologia. Vol 36 Page 172-178
Fracchia L Dohrmann A B Martinotti M G Tebbe C C (2006) Bacterial diversity in a finished compost and vermicompost differences revealed by cultivation-independent analyses of PCR-amplified 16S rRNA genes Applied Microbiology Biotechnology Vol 71 Page 942–952
Garg V K and Priya K (2005) Vermistabilization of textile mill sludge spiked with poultry dropping by an epigeic earthworm Eisenia foetida. Bioresource Technology Vol 96 Page 1063–1071
Grover I S Kaur S (1999) Genotoxicity of wastewater samples from sewage and industrial effluent detected by the Allium root anaphase aberration and micronucleus assays Mutation Research Vol 426 Page 183–188
Haimi V Hutha (1986) Capacity of various organic residues to support adequate earthworm biomass in vermicomposting, Biology and Fertility Soil Vol 2 Page 23–27
Hait S Tare V (2011) Vermistabilization of primary sewage sludge. Bioresource Technology Vol 102 Page 2812–2820
Kaviraj B and Sharma S (2003) Municipal solid waste management through vermicomposting employing exotic and local species of earthworms. Bioresource Technology Vol 90 Page 169–173.
Khwairakpam M Bhargava R (2009) Vermitechnology for sewage sludge recycling.Journal of Hazardous Materials Vol 161 page 948–954
Lazcano C Gómez-Brandón M Domínguez J (2008) Comparison of the effectiveness of composting and vermincomposting for the biological stabilization of cattle manure chemosphere Vol 72 page 1013–1019
Morais F M C Queda C A C (2003) Study of storage influence on evolution of stability and maturity properties of MSW composts. In: Proceeding of the fourth International Conference of ORBIT association on Biological Processing of Organics: advantages for a Sustainable Society part II Perth Australia
Munawar I. (2016) Vicia faba bioassay for environmental toxicity monitoring A review Chemosphere Vol 144 page 785-802
Ndegwa P M Thompson S A (2001) Integrating composting and vermicomposting the treatment and bioconversion of biosolids. Bioresource Technology Vol 76 page 107–112
Priya K and Garg V K (2004) Dynamics of biological and chemical parameters during vermicomposting of solid textile mill sludge mixed with cow dung and agricultural residues. Bioresource Technology Vol 94 page 203–209
Qian X W (2004) Mutagenic effects of chromium trioxide on root tips of Vicia faba Journal of Zhejiang University Scicnce Vol 5 page 1570-1576
Rank J Nielsen M H (1994) Evaluation of the Allium anaphase-telophase test in relation genotoxicity screening of industrial waste water Mutation Research Vol 41 page 113-119
Rank J Nielsen M H (1998) Genotoxicity testing of waste water sludge using the Allium cepa anaphase-telophase chromosome aberration assay. Mutation Research. Vol 418 page 113-119
Rank J Nielsen M H (2003) The method of Allium cepa anaphase –telophase chromosome aberration assay.Ekologija Vol 1 Page 38-42
Ramu S Varuna K Infancia L Deepa S and Senthil kumar S (2019) Bioconversion of textile industry sludge into soil enriching material through vermistabilization Research & Reviews A journal of life science Vol 3 No 1
Renuka Gupta V K Garg (2009) Stabilization of primary sewage sludge during vermicomposting. Journal of hazardous Materials Vol 168 Page 262-268
Renuka G and Garg V K (2007) Stabilization of primary sewage sludge during vermicomposting Journal of Hazardous Materials Vol 153Page 1023–1030
Sartaj A J singh A P Vig (2014) Genotoxicity assessment and optimization of pressmud with the help of exotic earthworm Eisenia fetida .Environmental Science pollution Research Vol 21 Page 8112-8123
Sharma S Nagpal A Vig A P (2012) Genoprotective potential of Brassica juncea(L) Czen. Against mercury- induced genotocity in Allium cepa L.Turkish Journal of Biology Vol 36 Page 622-629
Singh J Kaur A Vig A P and Rup P J (2010) Role of Eisenia fetida in rapid recycling of nutrients from biosludge of beverage industry. Ecotoxicology and Environmental Safety Vol 73 Page 430–435
Singh J Kaur A et al (2010) Role of Eisenia fetida in rapid recycling of nutrient from biosludge of beverage industry Ecotoxicology and environmental safety Vol 73 Page 430-435
Suthar S (2010) Recycling of agro-industrial sludge through Vermitechnology Ecological Engineering Vol 36 Page 1028-1030
Suthar S Pravin K Singh S (2012) Vermicomposting of milk processing industry sludge spiked plant wastes. Bioresource Technology Vol 116 Page 214-219
Yadav A Garg (2009) Feasibility of nutrient recovery from industrial sludge by vermicomposting technology. Journal of Hazardous materials Vol 168 Page 262-26

