1Geobiotechnology Laboratory, National College (Autonomous), Tiruchirappalli – 620 001, Tamil Nadu, India.
2Post Graduate and Research Department of Biotechnology, National College (Autonomous), Tiruchirappalli – 620001, Tamil Nadu, India
3Post Graduate Department of Zoology, Khalsa College, Amritsar – 143 001, Punjab, India.
4Post Graduate and Research Department of Botany, National College (Autonomous), Tiruchirappalli – 620 001, Tamil Nadu, India.
Corresponding author email: senthil@nct.ac.in; microsenthilkumar@gmail.com
Article Publishing History
Received: 15/04/2020
Accepted After Revision: 25/05/2020
The present study is focused on biorestoration of the soil polluted by textile effluent through a process of vermistabilization. The polluted soil (PS) amended with cow dung (CD) is vermistabilized by Eudrilus eugeniae and its efficiency is subsequently evaluated with Phaseolus radiatus. A series of admixtures of PS and CD on dry weight basis were studied under laboratory condition for 8 consecutive weeks and the results were monitored on a weekly basis. During the study, maximum viability of worms was observed for CD90 PS10 during the 4th week, and there was peak hatchling production during the 5th week when amended soil was composed of CD50 PS50. However maximum worms weight and cocoon production were recorded for an admixture of CD60 S40 during 4th and 5th weeks respectively. The biorestoration resulted in marked changes in physico-chemical parameters of the final vermicompost (CD50 PS50) with significant increase in TKN (77 %), TP (202 %), TK (48 %), TCa (57 %), Mg (27 %) and reduction in EC (46 %), C:N ratio (75 %), TNa (30 %) and S (50 %). Further, heavy metals such as Cu and Zn have also registered an increase in their concentration while Fe, Mn and Cr exhibit a downward trend. Germination studies and plant growth measurements have also been carried out during the investigation and it has been observed that the amended mixture with CD50 PS50 is the optimal medium for biorestoration through vermistabilization for the soils affected by textile effluent.
Vermistabilization, Textile Effluent, Eudrilus Eugeniae, Biorestoration, Phaseolus Radiatus.
Ramu S, Shanmuganathan B, Thanavel M, Kumaravel V, Singh J, Sadasivam S. K. Biorestoration of Textile Effluent Polluted Soil Through Vermistabilization. Biosc.Biotech.Res.Comm. 2020;13(2).
Ramu S, Shanmuganathan B, Thanavel M, Kumaravel V, Singh J, Sadasivam S. K. Biorestoration of Textile Effluent Polluted Soil Through Vermistabilization. Biosc.Biotech.Res.Comm. 2020;13(2). Available from: https://bit.ly/2KkMuEU
Copyright © Ramu et al., This is an open access article distributed under the terms of the Creative Commons Attribution License (CC-BY) https://creativecommns.org/licenses/by/4.0/, which permits unrestricted use distribution and reproduction in any medium, provide the original author and source are credited.
INTRODUCTION
India is the second largest producer and exporter of textile and garments globally Corporate Catalyst (2015). Textile industries utilize about 200 L of water to produce 1 kg of fabric. Water is mainly used for application of chemicals onto the fibers and rinsing of the final products (Ghaly et al., 2014). The wastewater produced during this process contains large amount of dyes, salts, chemicals and heavy metals. Textile effluents are mostly discharged after minimal or no pretreatment into the neighboring water channels, streams and estuaries. The presence of chemicals in large quantities in the effluent not only affects water bodies but also collapses the soil properties adjacent to the water bodies and impinges on plant growth. Soil is a vibrant living matrix that is an indispensable part of the terrestrial ecosystem. The textile effluent polluted soil having an excess of any element or compound through direct or secondary exposure causes toxic response to biota or humans, resulting in unacceptable environmental risks (Baskaran et al.2009 Kabir et al. 2019, Garczynska et al 2020).
The Textile belt of Tamil Nadu (Tirupur, Coimbatore, Erode and Salem), India, had been discharging their effluents into wastelands which were once cultivable until strict rules and regulations were passed to confine their effluents (Sadasivam et al. 2015). For the past two decades, the dyeing units located in the textile belt of Tamil Nadu have polluted non-perennial tributaries of Cauvery by discharging the toxic effluents. According to Tamil Nadu Pollution Control Board (TNPCB) 8.8 crore litres of effluents, after primary processing in effluent treatment plants are being let out into the Noyyal River every day. TNPCB specifies that the total dissolved solids (TDS) in the water discharged into the river should not be more than 2,100 parts per million (ppm). But the TDS level in the water in Orathupalayam dam area is above 9,000 ppm; in summer when evaporation shoot up, the level of TDS is still higher (Jayanth et al. 2011). Environmentally acceptable alternatives to unsustainable treatment methods for textile effluent polluted soils have been sought. Regulators are now starting to recognize the influence of contaminant bioavailability and mobility on environmental risk, and consequently, there is an increasing adoption of a risk-based approach when assessing soil quality ( Selvam et al. 2018 Garczynska et al 2020).
Organic materials are a popular choice for this as they are derived from biological matter and often require little pre-treatment before they may be directly applied to soils (Selvam et al. 2019). Additionally, such amendment practices may also be a convenient route to the disposal of organic residues surplus to requirement (Beesley et al. 2011). The amendments of textile effluent polluted soil for remediation has been a long standing procedure aimed at reducing the risk of pollutant transfer to proximal waters or receptor organisms ( Esmaeili 2020).
Hence, this study focuses on the biorestoration of textile effluent polluted soil of the Perundurai region, Erode, Tamil Nadu, India, through vermistabilization process. Cow dung was the organic material used in this study. Eudrilus eugeniae, commonly called African night crawler, is native of tropical West Africa, is an epigeic earthworm commonly used for vermistabilization as growth, fecundity, maturation and biomass are significantly greater when compared with other species. Hence, Eudrilus eugeniae was the choice for this study for vermi stabilization.
MATERIAL AND METHODS
Collection of textile effluent polluted soil (PS), cow dung (CD) and Eudrilus eugeniae
The PS was collected from the Common Effluent Treatment Plant (CETP) of State Industries Promotion Corporation of Tamil Nadu (SIPCOT) industrial estate area, Perundurai, Erode district, Tamil Nadu, India. Fresh cow dung was collected from the residential areas in and around Karumandapam, Tiruchirappalli, Tamil Nadu, India. The initial physico-chemical characteristics of PS and CD are given in Table 1. Eudrilus eugeniae were obtained from Periyar Research Organization for Bio-Technique and Eco-system (PROBE), Periyar Maniyammai University, Vallam, Thanjavur, Tamil Nadu, India.
Table 1. Initial physico-chemical characteristics of CD and PS
| Composition | Cow dung (CD) | Polluted soil (PS) |
| pH | 8.13±0.05 | 7.86±0.01 |
| EC | 1.63±0.05 | 0.62±0.01 |
| TOC | 56.30±0.45 | 4.26±0.01 |
| TKN | 12.33±0.05 | 7.64±0.04 |
| TP | 2.30±0.10 | 1.64±0.45 |
| TK | 9.33±0.05 | 9.40±0.17 |
| C:N ratio | 0.74±0.03 | 0.06±0.17 |
| Cu | 0.69±0.00 | 0.14±0.00 |
| Zn | 1.56±0.01 | 1.88±0.06 |
| Fe | 9.63±0.01 | 15.00±0.01 |
| Cr | 0.78±0.03 | 0.15±0.21 |
The experiments were conducted in a specially designed perforated plastic basket (diameter 20 cm and depth 15 cm) named as vermireactors and numbered as per PS and CD concentrations in each mixture. PS and CD were completely air-dried and sieved (2.0 mm mesh) before mixing. PS was mixed with CD in different ratios VO 100% CD ,90:10, 80:20, 70:30,60:40, The study included a control vermireactor having CD only as feed mixture for the earthworms. The ratio of PS and CD in different ratio These mixtures were turned manually every day for 15 days in order to eliminate volatile gases potentially toxic to earthworms. After 15 days, 3 adult individuals of E. eugeniae weighing between 1 g and 1.2 g were introduced into each vermireactor. The experimental period was for 8 consecutive weeks. Care was taken to rear the earthworms with more than 60 % of moisture in the immediate surroundings using water sprinkler. Moisture content was measured based on the previous studies of (Sadasivam et al. 2015). All the vermireactors were kept under ambient conditions (room temperature 25±2 °C; appropriate temperature for E. eugeniae). The experiments were repeated thrice for each feed mixture. Homogenized samples (free from earthworms, cocoons and hatchlings) of the feed material were drawn on 0, 7, 14, 21, 28, 35, 42, 49 and 56th days from each vermireactors. The initial and final vermicompost samples were air-dried in the shade at room temperature, ground in a stainless steel blender and stored in plastic vials for further chemical analysis.
Physico-chemical characteristics and metal composition: The pH was measured using a digital pH meter (Systronics) by dissolving double distilled water suspension of each vermicompost in the ratio of 1:10 (w/v). Electrical conductivity (EC) was determined in double distilled water suspension of each mixture in the ratio of 1:10 (w/w) using a HM digital meter-COM-100. Total Organic Carbon (TOC) was measured on igniting the samples in a Muffle furnace at 550°C for 1 h following the method of (Nelson and Sommers (1996). Total Kjeldhal nitrogen (TKN) was determined by Bremner and Mulvaney (1982) procedure. Total phosphorous (TP) was analyzed using the colorimetric method of molybdenum in sulphuric acid. Total potassium (TK) was determined by flame photometer [Elico, CL 22D, Hyderabad, India]. Total sodium (TNa) was measured using a Systronics flame photometer-128 after digesting the samples in diacid mixtures (HClO4: HNO3 in 4:1 ratio). Heavy metals were measured by using Agilent AA 240 model atomic absorption spectrophotometer after digesting the samples in diacid mixtures.
Germination studies and plant growth measurements: Germination studies and plant growth measurements were done in Phaseolus radiatus (Green gram) to assess the manure quality of the biorestored soil. 1–5 % of the final vermicompost from the best vermireactor was mixed with normal soil to check germination and plant growth of P. radiatus for 4 consecutive days. Direct seed germination test (Warman 2010) of Phaseolus radiatus was conducted in triplicate by mixing final vermicompost of the best vermireactor with normal soil. Based on the previous studies carried out by David et al. (2014), the percentage amendment of vermicompost of the best vermireactor with normal soil chosen for this study ranged from 1 to 5 %. Amendments of the vermicompost of the best vermireactor with the normal soil were named as AST1 to AST5. Three controls were chosen (i) positive control comprising 100 % vermicompost of the best vermireactors (ASC1), (ii) negative control comprising 100 % polluted soil (ASC2) and (iii) overall control comprising 100 % normal soil (ASC3). Each amended soil was seeded with 16 seeds of Phaseolus radiatus. The cell packs were moistened with potable water (as required) and kept under 12-14 h of light and 25±2°C in the area where vermicomposting had been carried out. Germination count of the seeds was noted after 48 hours of seeding. The plants were harvested after 4 days of sowing and repeatedly washed with tap water. Furthermore, these were rinsed with 10 mM CaCl2 solution and washed with deionised water. Wet biomass of root, shoot and leaves was obtained after taking off excess water with tissue paper and using a Shimadzu weighing balance. Dry biomass of root, shoot and leaves was calculated by drying at 72° C in an oven for 72 h Wong et al. (1996)
Statistical analysis: All the samples were analyzed in triplicate (n = 3), and the results were averaged. Statistical analyses were performed by one-way analysis of variance (ANOVA) to evaluate the significant difference between vermireactors for growth and fecundity, physico-chemical and metal composition studies. Tukey’s post t-test was done to identify the homogenous types of vermireactors. The number of seedlings and plants was counted and statistically analyzed using ANOVA (SPSS 16.0).
RESULTS AND DISCUSSION
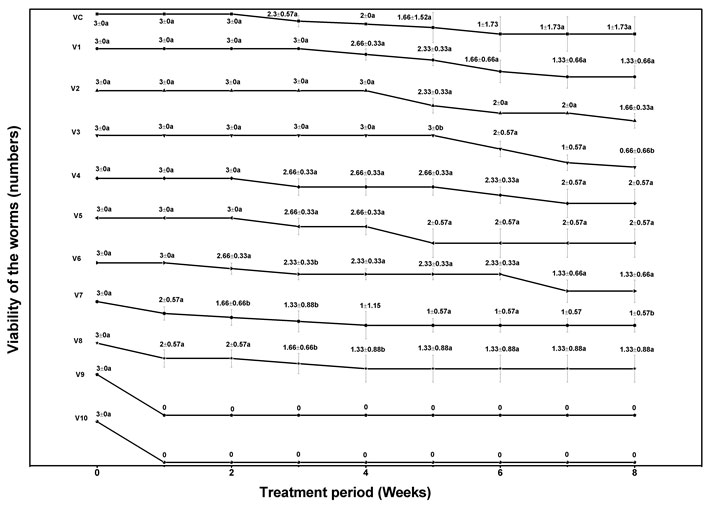
The mean viability of worms was found to be highest in V4 and lowest in V7 of all the vermireactors, and mean viability was greatest at 2nd week of the experimental period Fig. 1. Viability of E. eugeniae was zero in V9 & V10 from 1st to 8th week of the experimental period. The net mortality rate was found to be higher in V7 & V8 and consequently in Vc. Significant changes were observed in V7 at 2nd week, V6, V7 & V8 at 3rd week, V8 at 4th week, V3 at 5th week and V7 & V8 at 8th week when compared with all the other vermireactors in their respective week. The median viability of E. eugeniae was observed in V1 and at 4th week of the experimental period. The viability of the worms was found to be decreasing from 4th week, and thereby, a gradual decrease in viability of worms was monitored till the end of the experiment. Mortality rate was directly proportional to increase in the concentration of polluted soil in the vermireactors. Increased concentration of PS in CD attributed mortality to degradation processes that result in changes in environmental characteristics (Garg and Kaushik. 2005). Addition of at-least 50 % CD in PS was essential for the survival of E. eugeniae. Finally, these results suggested that feed mixtures in V8, V9 & V10 cannot be used as substrate for vermicomposting by E. eugeniae, but must be supplemented with more CD. Similar observations had been reported by (Elvira et al 1998) for paper mill sludge vermicomposting by E. andrei and for textile mill sludge vermicomposting by E. foetida (Kaushik and Garg 2004).
Figure 1: All values are mean (n=3) S.D. Mean viability of the earthworms was compared among all the vermireactors having different concentration of CD+PS, where (a) highly significant and (b) less significant when compared with the control at (One Way ANOVA F ratio =0.988,TukeyTest
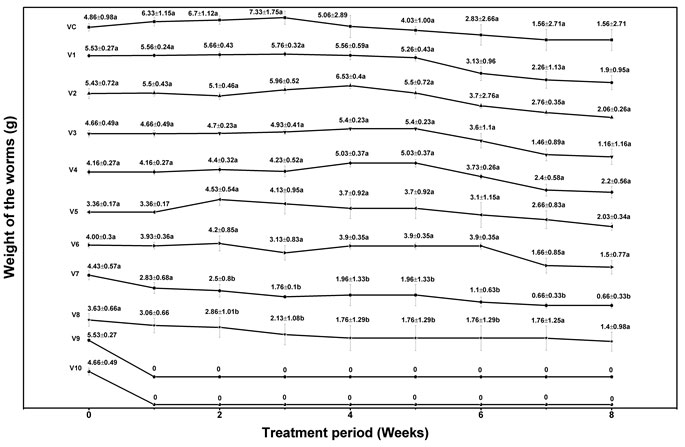
The mean worm weight of earthworm was found to be maximum in V2 and lowest in V10, and the highest mean worm weight was observed at 2nd week of the experimental period Fig. 2. Significant changes were observed when V7 & V8 (except 0th week of V7 and 0th, 1st, 7th and 8th week of V8) were compared with rest of all the vermireactors from 1st week to 8th week of the experimental period. Increasing concentration of PS in vermireactors promoted a decrease in the weight of E. eugeniae, but did not show a regular pattern. The median worm weight was observed in V4 when compared with all the other vermireactors and at 4th week when compared with rest of all the weeks throughout the experimental period. Initial increase in worm weight (till 3rd week in all the vermireactors except V2 in which worm weight increased till 4th week) was followed by stabilization. Later weight loss was observed in all the vermireactors from 4th week except in V2. The loss in worm weight can be attributed to the exhaustion of food (Renuka and Garg, 2007). When E. eugeniae received the food below a maintenance level, it lost weight at a rate which depended upon the quantity and nature of its ingestible substrates. This was in consonance with the study carried out by Renuka et al. 2007 in E. foetida. (Garczynska et al 2020)
Figure 2: All values are insignificantly different (One Way ANOVA: =0.502, Tukey Test) where (a) highly significant and (b) significant when compared with the control
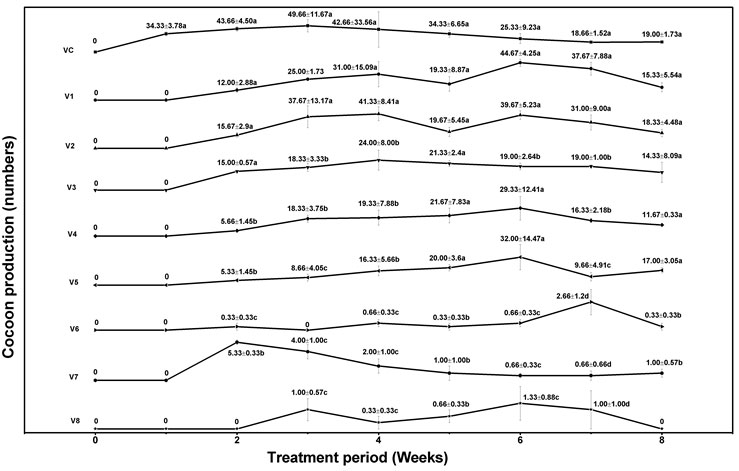
Cocoon production: The net cocoon production peaked in Vc and decreased in V8 and V6 in comparison with all the vermireactors; mean cocoon production increased at 6th week and dropped at 8th week of the experimental period Fig. 3. From 0th to 8th week, no cocoon production was observed in V9 & V10. However, least cocoon production was observed in V8 from 3rd to 7th week. Significant alterations in cocoon production were observed when V6 was compared with V4, V5 and V7 at 2nd week; V8 with V5, V7 ,V3 & V4 at 3rd week; V6, V7 V8 with V3, V4 &V5 at 4th week; V6, V7 &V8 with rest of the vermireactors at 5th week; V6, V7 &V8 with V3 at 6th week; V6, V7 & V8 with V5, V3& V4 at 7th week and finally when V6 & V7 were compared with the remaining vermireactors at 8th week. The differences among rates of cocoon production in different vermireactors could be related to the biochemical quality of the feed mixtures, which is one of the important factors in determining the onset of cocoon production (Edwards et al.1998). The present study reported the maximum cocoon production in V4 and at 5th week during the entire treatment period. This is in consonance with the studies conducted by (Xie et al. 2012) which stated that addition of cow dung with sludge of animal wastewater treatment plant improved the mutual interaction between earthworm and microbes; the maximum proliferation of E. fetida was noted in sludge mixed with 40 % CD and proved to be a suitable growth medium for the fecundity of E. fetida.
Figure 3: All values are mean (n=3) S.D. Mean cocoon production was compared among all vermireactors having different concentration of CD + PS where (a) highly significant, (b) significant, (c) less significant, and (d) least significant when compared with the control at different letters in some column are significantly different (One Way ANOVA: F ratio 4.01, tukey test). V9 and V10 were not plotted in the graph since no cocoon production was observed throughout the experimental period.
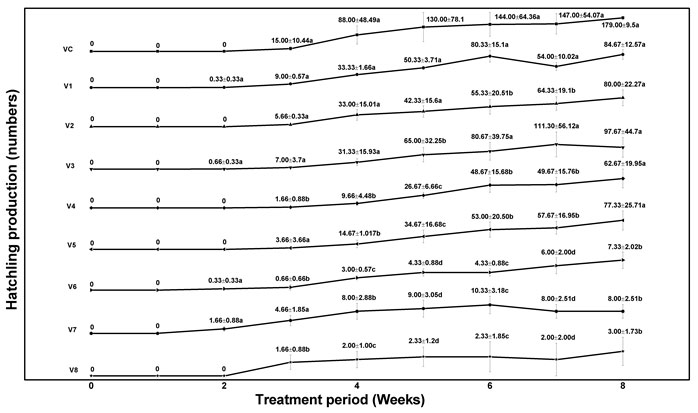
Number of hatchling: The greatest mean number of hatchlings was produced in Vc and diminished in V8. This observation was same as in the case of cocoon production. Dissimilarity in mean number of hatchlings was noted when maximum number of hatchlings peaked at 7th week for all the vermireactors Fig. 4. No significant changes were observed at 2nd week of the treatment period. However, significant variations were examined when V4, V6 &V8 were compared with all the other vermireactors at 3rd week; V6 &V8 with V4, V5 & V7 at 4th week; V6, V7 &V8 compared with V4 &V5 at 5th week; V6, V7 & V8 with V3, V4 & V5 at 6th and 7 th week and V6, V7 & V8 with rest of all the vermireactors at 8th week. The median cocoon production was observed in V4 and at 5th week among the entire treatment period. These data suggested that greater percentage of PS in feed mixtures significantly affected the development of hatchlings per cocoon. The feed, which provide earthworms with sufficient amount of easily metabolizable organic matter and non-assimilated carbohydrates, favors the growth and reproduction of the earthworms (Garg and Kaushik. 2005). The maximum number of hatchlings in V4 was supported by the studies conducted by (Bhat et al. 2015) where maximum number of hatchlings was observed in 60-100% amendment of cow dung with sugar beet mud using E. fetida.
Figure 4: All values are mean (n=3) S.D. Mean hatchling production was compared among all vermireactors having different concentration of CD + PS where (a) highly significant, (b) significant, (c) less significant, and (d) least significant when compared with the control at different letters in some column are significantly different (One Way ANOVA) : P < 0.05, tukey test).
Physico-chemical properties: The physico-chemical characteristics of initial and final feed mixtures of textile effluent are shown in Table 2.Significant difference in pH was not observed in all the vermireactors of the initial feed mixtures. The pH of the initial feed mixtures ranged from 7.52 to 8.89, near neutral to alkaline. But the pH of the final vermicompost was near neutral in all the vermireactors except V9 & V10. The optimum pH was observed in V3 & V6 in the final vermicompost. It has been reported (Ndegwa and Thompson, 2000) that the pH shift is dynamic and substrate dependent. The shift in pH during vermicomposting process could be attributed to the production of metabolic compounds of aerobic digestion of organic stuffs such as CO2, ammonia, NO3– and organic acids (Lopez et al., 2002).
Significant decrease in EC was observed in the final vermicompost except in V9 & V10 when compared with the initial feed mixtures of all the vermireactors. The net EC loss was 42 % in the final vermicompost when compared with the initial feed mixtures. The optimum EC was observed in V4 & V5 of the final vermicompost. Decrease in EC of the final vermicompost may be due to stabilization of mixtures (Singh et al. 2010). They also observed a decline in EC in the vermicompost from the biosludge of a beverage industry.
Total Organic Carbon (TOC): TOC of the final vermicompost was significantly reduced when :compared with the initial feed mixtures. The optimum TOC was observed in V5 of the final vermicompost. There was a net loss of 52 % TOC in the vermireactors at the end of vermicomposting period. This finding was supported by (Kaviraj and Sharma, 2003) who reported 45% loss of carbon during vermicomposting of municipality and industrial wastes. (Suthar, 2006) reported that earthworms promoted microclimatic conditions in the vermireactors that increased the loss of TOC from substrate through microbial respiration (Abbas Esmaeili et al 2020)
Total Kjeldhal Nitrogen (TKN): A significant increase in TKN was recorded in all the vermireactors at the end of the study period. The net TKN of the final vermicompost increased upto 50 % and the nitrogen enhancement rate was optimum in V3. Body secretions of earthworm (excreta, mucus) add nitrogen in substrate if earthworms were inoculated in organic wastes for longer periods. Earthworms also alter the microclimatic conditions of vermireactors which consequently promote microbial populations responsible for nitrogen enrichment (Suthar et al. 2012). Hence in this study, the combination of the organic waste (CD) and polluted soil acted as good energy stuff for nitrogen fixing bacteria enhanced by E. eugeniae.
Carbon Nitrogen ratio (C: N ratio):C: N ratio was found to decrease significantly (75 % net loss) in all the vermireactors of the final vermicompost when compared with initial feed mixtures. The optimal C:N ratio was observed in V5 & V6 of the final vermicompost. Decline in C:N ratio in this study was due to higher loss of carbon through microbial respiration in the form of CO2 along with an increase in nitrogen and stabilization of waste by the action of E. eugeniae. Similar results were observed by (Bhat et al. 2014). Earlier studies have suggested that a C:N ratio below 20 is an indicative of acceptable maturity, while a ratio of 15 or lower is being preferred for agronomic use of composts. The vermicomposts obtained in this study showed C:N ratio within the preferable limits as described by (Morais and Queda, 2003).
Total Phosphorous (TP): Trivial changes were observed in phosphorous content in all the vermireactors of initial feed mixtures. The net P content in vermicomposted material was 118 % higher than in the initial feed mixtures. The optimal P content was observed in V3 of the final vermicompost. Significant changes in phosphorous content were observed in all the vermireactors of the final vermicompost except in V9 & V10. The concentration of phosphorous in vermicomposted material may reflect the amount of organic forms of phosphorous in PS, but its mineralization rate is directly affected by the nature of the amendment material and activities of P-mineralizing microflora in decomposting wastes. (Satchell and Martin 1984) found an increase of 25 % in total P of paper-waste sludge after vermicomposting. In the present study there was 118 % increase in P content. This increase might be due to the release of P in available forms which were partly performed from earthworm gut phosphatases, and further release of P might be attributed to the P-solubilizing microorganisms present in worm casts as suggested by (Suthar et al. 2012). The results clearly suggest that P enrichment is directly related to the quality of material used in the vermireactors.
Total Potassium (TK): High potassium content was observed in the initial feed mixtures, but did not show a regular pattern and started diminishing after V7. Subsequently, significant increase of mean TK content (43%) was observed in the final vermicompost when compared with initial feed mixtures and started diminishing after V8. The optimal K content was observed in V5 & V8. Most of the earlier works on vermicomposting ( Bhargava 2009). ( Hait and Tare 2011) had reported higher K levels at the end of vermicomposting. The increase in K content indicates that when organic waste passes through the gut of earthworm, some fraction of organic materials is converted into more available types of nutrients (i.e. exchangeable forms) due to the action of endogenic and/or exogenic enzymes Suthar ( 2010).
Heavy metal composition: Copper and Zinc (Cu & Zn):Transition metals Cu and Zn increased significantly (P<0.05) over initial feed mixtures in all the vermireactors except V10. Table 2. The mean increase in Cu and Zn content was 148% and 23%, respectively, in the final vermicompost. The optimal Cu and Zn content was observed in V4 and V5, respectively. In the final vermicompost, a little increase in Cu and Zn was noticed, and their contents increased with the increasing proportion of PS in the vermireactors. Increase in Cu and Zn metal contents may be due to decline in the weight and volume of the feed mixtures as suggested by Deolalikar et al. 2005. An increase in the content of transition metals in vermicompost from industrial sludge was also observed by Singh et al. 2010.
Table 2. Initial and final physico-chemical parameters (mean ± SE) different concentration of textile effluent polluted soil with cow dung
| Parameters | VC | V1 | V2 | V3 | V4 | |
| pH | Initial | 8.13±0.05 | 7.77±0.11 | 7.73±0.12 | 7.76±0.12 | 7.63±0.47 |
| Final | 7.86±0.00 | 7.43±0.02 | 7.27±0.02 | 7.58±0.05 | 7.59±0.05 | |
| % change | -5.33 | -4.37 | -5.92 | -2.37 | -0.52 | |
| EC (Ds/m) | Initial | 1.63±0.05 | 1.40±0.02 | 1.30±0.00 | 1.35±0.51 | 1.29±0.00 |
| Final | 0.88±0.00 | 0.56±0.07 | 0.87±0.00 | 0.92±0.00 | 0.80±0.05 | |
| % change | -46.01 | -60 | -21.18 | -20.10 | -42.66 | |
| TOC (k/kg) | Initial | 81.30±0.04 | 63.33±0.57 | 64.46±0.55 | 66.06±0.94 | 61.30±0.10 |
| Final | 25.63±0.36 | 25.50±0.55 | 26.63±0.45 | 27.20±0.17 | 28.46±0.11 | |
| % change | -68.17 | -57.73 | -58.60 | -58.82 | -53.67 | |
| TKN (k/kg) | Initial | 12.33±0.05 | 10.13±0.57 | 11.43±0.57 | 11.23±0.57 | 10.83±0.63 |
| Final | 19.66±0.09 | 15.64±0.45 | 16.33±0.39 | 16.57±0.39 | 17.46±0.11 | |
| % change | 59.44 | 54.33 | 42.86 | 47.55 | 61.21 | |
| C:N ratio | Initial | 6.32±0.29 | 6.25±0.37 | 5.72±0.40 | 5.96±0.11 | 5.34±0.21 |
| Final | 1.36±0.05 | 1.70±0.03 | 1.63±0.03 | 1.62±0.04 | 1.63±0.14 | |
| % change | -78.48 | -72.8 | -71.50 | -72.81 | -69.47 | |
| TP (g/kg) | Initial | 2.30±0.10 | 1.90±0.17 | 1.76±0.57 | 1.63±0.45 | 1.60±0.10 |
| Final | 4.57±0.32 | 3.56±0.11 | 3.70±0.34 | 3.56±0.11 | 4.64±0.45 | |
| % change | 98.69 | 87.36 | 53.40 | 110.22 | 89.29 | |
| TK (g/kg) | Initial | 9.33±0.05 | 13.53±0.20 | 13.56±0.30 | 13.40±0.26 | 13.03±0.11 |
| Final | 15.64±0.36 | 18.66±0.06 | 17.64±0.45 | 18.26±0.11 | 18.73±0.57 | |
| % change | 67.63 | 37.91 | 52.95 | 36.26 | 43.74 | |
| Cu (mg/kg) | Initial | 0.69±0.00 | 0.35±0.06 | 0.30±0.06 | 0.23±0.32 | 0.25±0.12 |
| Final | 0.72±0.01 | 0.79±0.00 | 0.91±0.01 | 0.96±0.01 | 0.82±0.01 | |
| % change | 4.35 | 55.69 | 67.03 | 317.12 | 227.99 | |
| Zn (mg/kg) | Initial | 1.56±0.01 | 1.57±0.12 | 1.71±0.04 | 1.57±0.06 | 2.01±0.07 |
| Final | 2.36±0.00 | 1.77±0.19 | 1.85±0.11 | 1.80±0.19 | 2.08±0.08 | |
| % change | 51.28 | 13.47 | 8.18 | 14.67 | 3.48 | |
| Fe (mg/kg) | Initial | 9.63±0.01 | 16.44±0.02 | 14.36±0.18 | 15.33±0.00 | 15.20±0.00 |
| Final | 9.12±0.00 | 12.68±0.11 | 12.89±0.00 | 11.69±0.00 | 12.58±0.01 | |
| % change | -5.29 | -22.87 | -10.23 | -23.74 | -17.23 | |
| Cr (mg/kg) | Initial | 0.12±0.01 | 0.39±0.00 | 0.48±0.01 | 0.53±0.04 | 0.47±0.01 |
| Final | 0.05±0.00 | 0.04±0.01 | 0.05±0.00 | 0.02±0.00 | 0.06±0.11 | |
| % change | -58.33 | -89.74 | -89.58 | -96.22 | -87.23 |
Significance level was determined by Tukey test p ≤ 0.05 Weight in (g/kg) and (mg/kg)
| Parameters | V5 | V6 | V7 | V8 | V9 | V10 | |
| pH | Initial | 7.62±0.49 | 7.66±0.10 | 7.62±0.42 | 7.52±0.82 | 8.02±0.01 | 8.89±0.01 |
| Final | 7.59±0.05 | 7.58±0.55 | 7.53±0.05 | 7.46±0.05 | 7.94±0.41 | 7.89±0.01 | |
| % change | -0.39 | -1.04 | -1.18 | -0.79 | 0.99 | -12 | |
| EC (Ds/m) | Initial | 1.10±0.07 | 1.17±0.05 | 1.10±0.05 | 1.10±0.01 | 0.59±0.00 | 0.62±0.05 |
| Final | 0.92±0.00 | 0.57±0.05 | 0.87±0.00 | 0.78±0.00 | 0.49±0.00 | 0.32±0.05 | |
| % change | -38.66 | -52.99 | -20.90 | -29.09 | -16.94 | -48.38 | |
| TOC (k/kg) | Initial | 61.10±0.56 | 28.96±0.56 | 21.43±0.15 | 19.16±0.20 | 6.41±0.30 | 5.26±0.12 |
| Final | 25.64±0.45 | 22.23±0.05 | 12.33±0.57 | 10.64±0.45 | 5.63±0.05 | 4.26±0.11 | |
| % change | -59.67 | -23.18 | -42.46 | -44.62 | -12.16 | -19.01 | |
| TKN (k/kg) | Initial | 9.73±0.57 | 10.80±0.60 | 9.43±0.57 | 10.76±0.57 | 8.64±0.45 | 7.64±0.45 |
| Final | 17.23±0.05 | 16.83±0.05 | 16.16±0.05 | 15.54±0.05 | 9.24±0.45 | 8.64±0.45 | |
| % change | 77.08 | 55.83 | 71.36 | 44.42 | 6.94 | 13.08 | |
| C:N ratio | Initial | 4.27±0.46 | 2.43±0.21 | 2.27±0.14 | 1.78±0.08 | 1.10±0.04 | 1.00±0.02 |
| Final | 1.49±0.04 | 1.52±0.34 | 1.27±0.18 | 1.47±0.16 | 1.90±0.00 | 1.89±0.01 | |
| % change | -76.23 | 37.44 | -44.05 | -17.41 | -72.77 | -88.99 | |
| TP (g/kg) | Initial | 2.53±0.15 | 1.76±0.49 | 1.40±0.16 | 1.40±0.17 | 1.31±0.15 | 1.20±0.14 |
| Final | 4.73±0.05 | 3.73±0.11 | 2.16±0.45 | 2.26±0.11 | 1.90±0.15 | 1.25±0.14 | |
| % change | 86.95 | 111.93 | 54.28 | 61.42 | 45.30 | 4.16 | |
| TK (g/kg) | Initial | 12.43±0.11 | 12.56±0.64 | 11.13±0.11 | 11.10±0.10 | 11.11±0.90 | 10.10±0.90 |
| Final | 18.43±0.57 | 19.26±0.11 | 19.26±0.11 | 18.64±0.45 | 13.17±0.90 | 11.85±0.64 | |
| % change | 48.23 | 53.34 | 73.04 | 67.92 | 18.54 | 17.32 | |
| Cu (mg/kg) | Initial | 0.29±0.30 | 0.54±0.26 | 0.42±0.12 | 0.35±0.60 | 0.24±0.60 | 0.14±0.00 |
| Final | 0.84±0.00 | 0.92±0.00 | 0.76±0.01 | 0.62±0.04 | 0.54±0.04 | 0.16±0.64 | |
| % change | 189.65 | 70.37 | 80.95 | 77.14 | 125.00 | 14.28 | |
| Zn (mg/kg) | Initial | 1.84±0.13 | 1.50±0.17 | 1.79±0.71 | 1.85±0.84 | 1.90±0.84 | 1.88±0.06 |
| Final | 2.25±0.95 | 2.36±0.11 | 2.39±0.49 | 2.45±0.00 | 2.32±0.00 | 1.99±0.00 | |
| % change | 22.28 | 57.33 | 33.51 | 32.42 | 22.10 | 5.85 | |
| Fe (mg/kg) | Initial | 16.18±0.05 | 18.24±0.10 | 14.58±0.04 | 15.58±0.01 | 15.01±0.01 | 15.00±0.01 |
| Final | 11.56±0.11 | 11.36±0.00 | 12.65±0.00 | 13.45±0.00 | 13.45±0.00 | 14.11±0.10 | |
| % change | -28.55 | -37.71 | -13.23 | -13.67 | -10.39 | -5.99 | |
| Cr (mg/kg) | Initial | 0.42±0.00 | 0.43±0.04 | 0.52±0.00 | 0.61±0.02 | 0.13±0.00 | 0.16±0.00 |
| Final | 0.04±0.01 | 0.05±0.01 | 0.03±0.01 | 0.02±0.00 | 0.05±0.05 | 0.12±0.21 | |
| % change | -90.47 | -88.37 | -94.23 | -96.77 | -61.53 | -25.00 |
Significance level was determined by Tukey test p ≤ 0.05 Weight in (g/kg) and (mg/kg)
Iron, and Chromium (Fe, and Cr): Significant decrease of Fe and Cr content was observed within and between initial feed mixtures and final vermicompost of all the vermireactors. Table 2. The net decrease in Fe, and Cr content in the final vermicompost was 20 %, 20 % and 86 %, respectively. The optimal Fe content was observed in V4 and optimal . Heavy metal content of Fe, and Cr in this study was found to be decreased in the final vermicompost when compared with initial feed mixtures. Similar observations were made in the studies conducted by Garg and Kaushik, (2005) on vermistabilization of textile mill sludge and by Bhat et al. (2015) on vermistabilization of sugar beet by E. foetida. The decrease in the heavy metal content of Fe, and Cr in the present study suggested that the vermicompost can be used in the fields without any ill effects on soil.
Germination studies and plant growth measurements: Based on the optimal characteristics of almost all the physico-chemical parameters, metal composition, growth and fecundity studies, the final vermicompost of V5 was chosen for amendment with normal soil in germination and plant growth measurements. Seed germination and plant growth were observed in all the amended soils for except the 100% polluted soil (ASC2). Charring of seeds was observed in ASC2. 100 % of the final vermicompost of V5 (ASC2) showed germination of the seeds, but plant growth was absent Table 3. Significant changes were observed when ASC1 and ASC2 were compared with ASC3 and the rest of the treated amended soil (AST1–AST5). As the concentration of biorestored soil in the amended soil increased, plant growth of P. radiatus also increased except in the case of AST5. Vegetative growth parameters of P. radiatus (root, shoot and leaf length) at all tested concentrations of amended soil were similar to normal soil. The maximum root and shoot length were observed in AST3 and maximum leaf length in AST4. Maximum wet biomass of root, shoot and leaves was observed in AST1-AST3, AST4 and all the amended soils except ASC3, respectively. Maximum dry biomass of root, shoot and leaves was observed in AST4, AST1 and all amended soils except ASC3, respectively. The maximum protein content for root was observed in AST4, for shoot in AST5 and for leaves in AST3 Table 3. Similar seed germination and vegetative growth were observed in Phaseolus mungo when 10% distillery sludge was amended with garden soil by Chandra et al. 2008.
Table 3. Effect of different concentration of bio-restored soil from V5 with normal soil on root, shoot, and leaves length and their respective biomass of Phaseolus radiatus
|
Treatment |
No. of grown plants after 4th day | Root length (cm) | Wet biomass of root (g/plant) | Dry biomass of root (g/plant) | Shoot length (cm) | Wet biomass of shoot (g/plant) | Dry biomass of shoot (g/plant) | Length of leaves (cm) | Wet biomass of leaves (g/plant) | Dry biomass of leaves (g/plant) |
| ASC3 | 11.66 ± 0.57 | 9.55 ± 0.32 | 0.020 | 0.0050 | 10.39 ± 0.23 | 0.200 | 0.021 | 1.86 ± 0.23 | 0.027 | 0.0079 |
| AST1 | 11.66 ± 0.57 | 10.23 ± 0.94 | 0.267 | 0.0061 | 12.36 ± 1.34 | 0.247 | 0.022 | 2.03 ± 0.15 | 0.054 | 0.0088 |
| AST2 | 12.66 ± 0.57 | 10.90 ± 1.52 | 0.267 | 0.0056 | 12.50 ± 1.89 | 0.220 | 0.021 | 1.93 ± 0.11 | 0.054 | 0.0088 |
| AST3 | 12.66 ± 1.15 | 9.91 ± 0.43 | 0.267 | 0.0058 | 9.86 ± 0.74 | 0.240 | 0.023 | 2.56 ± 0.20 | 0.054 | 0.0088 |
| AST4 | 13.20 ± 2.64 | 9.86 ± 0.74 | 0.040 | 0.0062 | 11.95 ± 0.80 | 0.250 | 0.021 | 2.46 ± 0.32 | 0.054 | 0.0091 |
| AST5 | 11.33 ± 0.57 | 9.86 ± 0.74 | 0.053 | 0.0059 | 11.95 ± 0.80 | 0.240 | 0.021 | 1.86 ± 0.20 | 0.054 | 0.0088 |
All values are mean (n = 3) ±S.D.
ASC3 : Amended Soil Control 3 (Overall control: 100% garden soil) AST: Amended Soil Treated
AST1 : 198 : 2 g (Garden soil : g)
AST2 : 196 : 4 g
AST3 :194 : 6 g
AST4 : 192 : 8 g
AST5 : 190 : 10 g
CONCLUSION
Restoration of textile effluent polluted soil by environmentally acceptable means has become a great challenge and a major concern of the present decade. This study had demonstrated vermistabilization by E. eugeniae as an appropriate technology for management of textile effluent polluted soil. Growth and fecundity studies of E. eugeniae revealed that a high degree of PS stabilization was achieved in (V4 and V5) (CD40 PS60 and CD50 PC50) at 4th and/or 5th week of the study period. The optimal CD+PS composition for almost all the favorable Physico-chemical parameters and metal concentrations ranged from (V3 to V6 ) (CD70 PS30 to CD40 PS60) when compared with Vc (CD100 PS0 ) (V9 & V10 ) (CD90 PC10) and (PC 100), while (V1 & V2) (CD90, PS10 CD20 and PC80) on the other hand Vc ,(CD100), (V9 and V10) (CD10 PC90 and CD0 PS100) were not found to be suitable for the growth of E. eugeniae. Germination studies and plant growth measurements of Phaseolus radiatus showed that 1-5% amendment of the vermicompost of V5 would serve as a soil conditioner or manure in the agricultural fields. The study revealed the fact that PS could be restored and transformed into good quality manure by vermicomposting when mixed with at least 30-50 % CD.
ACKNOWLEDGEMENTS
The authors would like to acknowledge the TDT Division, Department of Science and Technology (DST), New Delhi, India [Grant No:DST/TDT/WMT/2017/054] and Tamil Nadu State Council for Science and Technology (TNSCST), Tamil Nadu, India [Grant No. TNSCST/S&T projects/VR/ES/2012-2013-200 dated 10.05.2013] for the financial support. The authors are grateful to the Dr. K. Anbarasu, Director of Studies and Shri. K. Ragunathan, the Secretary of National College (Autonomous), Tiruchirappalli, India, for all their constant support and encouragement in the pursuit of this research. The authors are indebted to Mr. K. Raja, Assistant Professor, Department of Mathematics; Dr. M. Murali, Assistant Professor, and Ms. V. Sathya, Assistant Professor, Department of Chemistry, National College (Autonomous), Tiruchirappalli, Tamil Nadu, India, for their help in the use of ORIGIN 8 software.
Conflict of interest: The authors declare that they have no conflict of interest.
REFERENCES
Abbas E Mahdi E Abbas R K Majid G Hadi E (2020) Pistachio waste management using combined composting vermicomposting technique Physico- chemical changes and worm growth analysis Journal of Cleaner Production Vol Page 118523
Baskaran L Sankar G K Chidambaram A L A Sundaramoorthy P (2009) Amelioration of sugar mill effluent polluted soil and its effect of green gram (Vigna radiata L.) Botany Research International Vol.2 Page 131–135
Beesley L Moreno-Jimenez E Gomez-Eyles J L Harris E Robinson B Sizmur T (2011) A review of biochar’s potential role in the remediation revegetation and restoration of contaminated soils Environmental Pollution Vol 159 Page 3269-3282
Bhat S A Singh J Vig A P (2013) Vermiremediation of dyeing sludge from the textile mill with the help of exotic earthworm Eisenia fetida Savigny Environmental Science and Pollution Research Vol 20 No 9 page 5975–5982
Bhat S A Singh J Vig A P (2014) Genotoxic assessment and optimization of pressmud with the help of exotic earthworm Eisenia fetida Savingy Environmental Science and Pollution Research Vol 21 Page 8112-8113
Bhat S A Singh J Vig A P ( 2015) Vermistabilization of sugar beet (Beta vulgaris L) waste produced from sugar factory using earthworm Eisenia fetida: Genotoxic assessment by Allium cepa test. Environmental Science and Pollution Research Vol 22 Page 11236-11236
Bremner J M Mulvaney R G (1982) Nitrogen total In: Page A L Miller R H Keeney DR (Eds.) Method of Soil Analysis Page 575–624 American Society of Agronomy Madison Chandra R Yadav S Mohan D (2008) Effect of distillery sludge on seed germination and growth parameters of green gram (Phaseolus mungo L.). Journal of Hazardous Materials Vol 152 Page 431- 439
Corporate Catalyst (India) Private Limited (2015) A brief report on textile industry in India. (www.cci.in).
David W Carol O M Carl W (2014) Vegetable gardens: Soil management and fertilization, Colorado Master Gardener Program, U.S. Department of Agriculture and Colorado counties cooperating (http://www.ext.xolostate.edu/mg/gardennotes/711.html)
Deolalika AV Mitra A Bhattacharyee S Chakraborty S (2005) Effect of vermicomposting process on metal content of paper mill solid waste Journal of Environmental Science and Engineering Vol 47 Page (81–84)
Edwards C A Dominguez J Neuhauser E F (1998) Growth and reproduction of Parionyx excavates (Perr.) (Megascolecidae) as factors in organic waste management Biology and Fertility of Soils Vol 27 page 155-161
Elvira C Sampedro L Benitez E Nogales R (1998) Vermicomposting of sludges from paper mill and dairy industries with Eisenia andrei: a pilot study Bioresource Technology Vol 63 page 205–211
Fijul Kabir MS Samit C Azizul H Kavita M (2019) Sustainability Assessment of Cotton Based Textile Wet Processing Clean Technologies Vol Page 232-246
Garg V K Priya K (2005) Vermistabilization of textile mill sludge spiked with poultry dropping by an epigeic earthworm Eisenia foetida Bioresource Technology Vol 96 Page 1063–1071.
Ghaly A E Ananthashankar R Alhattab M Ramakrishnan V V (2014) Production characterization and treatment of textile effluents: a critical review Chemical Engineering and Process Technology Vol 5 Page 1-19
Hait S Tare V (2011) Vermistabilization of primary sewage sludge Bioresource Technology Vol 102 Page 2812–2820
Jayanth S N Karthik R Logesh S Srinivas Rao K Vijayanand K (2011) Environmental issues and its impacts associated with the textile processing units in Tirupur Tamil Nadu. 2nd International Conference on Environmental Science and Development IPCBEE Singapore Vol 4 Page 120–124
Kaur A Singh J Vig A P Dhaliwal S S Rup P J (2010 ) Cocomposting with and without Eisenia fetida for conversion of toxic paper mill sludge to a soil conditioner. Bioresource Technology Vol 101 Page 8192–8198
Kaviraj B Sharma S (2003) Municipal solid waste management through vermicomposting employing exotic and local species of earthworms Bioresource Technology Vol 90 page 169-173
Khwairakpam M Bhargava R (2009) Vermitechnology for sewage sludge recycling Journal of Hazardous Materials Vol 161 Page 948–954
Lopez A M Funamizu N Takakuwa T (2002) Characterization of feces for describing the aerobic biodegradation of feces. Journal of Japan Society Engineering Vol 720 Page 99-105
Mariola G Grzegorz P Agnieszka P Anna M P Renata S Kevin R B Joanna Kostecka (2019) Effect of owinema Bio preparation on vermicomposting in earthworm ecological boxes Applied Science Vol 10 Page 456
Morais F M C Queda C A C (2003) Study of storage influence on evolution of stability and maturity properties of MSW composts In Proceeding of the fourth International Conference of ORBIT association on Biological Processing of Organics advantages for a Sustainable Society part II Perth Australia
Ndegwa P M Thompson S A (2000) Effects of stocking density and feeding rate on vermicomposting of biosolids Bioresource Technology Vol 71 Page 5–12
Nelson D W Sommers L E (1982) Total carbon and organic carbon and organic matter In: Page AL, Miller RH, Keeney DR (Eds.) Method of Soil Analysis Page 539–579 American Society of Agronomy Madison
Pattnaik, S. Reddy, M. V .2010. Nutrient status of vermicompost of urban green waste processed by three earthworm species–Eisenia fetida, Eudrilus eugeniae and Perionyx excavatus. Applied and Environmental Soil Science Vol 1 Page 13
Priya K Garg V K (2004) Dynamics of biological and chemical parameters during vermicomposting of solid textile mill sludge mixed with cow dung and agricultural residues Bioresource Technology Vol 94 Page 203-209
Ramu S Varuna K Infancia L Deepa S Senthil Kumar S (2018) Earthworm Aided Biorestoration Of Textile Effluent Polluted Soil (2018) International Journal of Research and Analytical Reviews Vol 5 Issue 04
Ramu S Varuna K Infancia L Deepa S Senthil Kumar S (2019) Bioconversion of textile industry sludge into soil entriching material through vermistabilization Research & Reviews A journal of life science Vol 1 issue 1
Renuka G Garg V K (2007) Stabilization of primary sewage sludge during vermicomposting Journal of Hazardous Materials Vol 153 Page 1023-1030
Sadasivam S K Veeramani A Ramasamy R (2015) Study on the effect of textile effluent on the growth and fecundity of Eudrilus eugeniae International Journal of Environment and Waste Management Vol 16 Page 71–80
Satchell J E Martin K (1984) Phosphate activity in earthworm faeces Soil Biology and Biochemistry Vol 16 Page 191- 194
Singh J Kaur AVig A P Rup P J (2010) Role of Eisenia fetida in rapid recycling of nutrients from biosludge of beverage industry Ecotoxicology and Environmental Safety Vol 73 Page 430–435.
Suthar S (2006) Potential utilization of Guar gum industrial waste in vermicompost production. Bioresource Technology Vol 97 Page 2474-2477
Suthar S (2010) Recycling of agro-industrial sludge through vermitechnology. Ecological Engineering Vol 36 Page 1028–1036
Suthar S Mutiyar K P Singh S (2012) Vermicomposting of milk processing industry sludge spiked with plant waste Bioresource Technology Vol 116 page 214–219
Warman P R Anglopez M J (2010) Vermicompost derived from different feedstocks as a plant growth Medium Bioresource Technology Vol 101 Page 4479–4483
Wong J W C Li G X Wong M H (1996) The growth of Brassica chinensis in heavy metal contaminated sewage sludge compost from Hong-Kong Journal of Hazardous Materials Vol 152 page 309–313
Xie D Xu W Hao X Jiang D Li X Bai L (2015) Vermicomposting of sludge from animal wastewater treatment plant mixed with cow dung or swine manure using Eisenia fetida. Environmental Science and Pollution Research Vol 23 Page 7767–7775

