Mohammed A. Alraawi*1![]() , Sahin Baris2
, Sahin Baris2![]() , Nasser M Al Ahmari3
, Nasser M Al Ahmari3![]() , Abdulkhaliq A Alshadidi4
, Abdulkhaliq A Alshadidi4![]() , Nazim H. Abidi5
, Nazim H. Abidi5![]() , Mohammed M Al Moaleem6
, Mohammed M Al Moaleem6![]()
1Department of Orthodontics, College of Dentistry, University of Hatay Mustafa Kemal, Antakya, Turkey
2Private Clinic, Istanbul, Turkey
3Prosthetic Department, College of Dentistry, King Khalid University, Abha, Saudi Arabia
4Applied Medical Sciences College, King Khalid University, Abha, Saudi Arabia
5Department of Maxillofacial Surgery and Diagnostic Sciences, College of Dentistry, Jazan University, Jazan, KSA
6Department of Prosthetic Dental Science, College of Dentistry, Jazan University, Jazan 45142, Saudi Arabia
Corresponding author email: drsahinbaris@gmail.com
Article Publishing History
Received: 17/04/2020
Accepted After Revision: 13/06/2020
Aims of the study were to assess dental students’ perceptions of educational environment and identify differences in terms of gender, age, type of high school, level of education, total monthly family income, and type of housing. A cross-sectional, descriptive questionnaire was administered in a dental school in Turkey. A total of 185 undergraduate dental students from the third-, fourth-, and fifth-year were personally approached by the investigator to complete the questionnaire. Data were analyzed using the IBM SPSS-22 Türkiye program. Comparisons were performed via ANOVA and t-test to detect the significance between and within the groups. This study gotten a response rate of 96.67%, and the total Dundee ready education environment measure score was more positive than negative (60% and 48%). No significant difference existed between the gender scores at 100.97 ± 22.18 and 100.19 ± 16.77. Other parameters showed no influences the findings. A significant difference was observed in SASP, with a p 0.042 in the graduated school type. The students in the third-, fourth-, and fifth-year levels obtained DREEM scores of 95, 36 ± 18, 67 103, 02 ± 20, 75, and 103, 31 ± 19.31, respectively. Significant differences were observed in SPT and SPA, with p values of 0.029 and 0.035. We concluded that the EE perceptions of students were at the margin of the positive side, with no significant difference in terms of gender, age, monthly family income, and housing type. However, certain weaknesses were identified, particularly in students’ perception of learning and atmosphere.
Dental students; DREEM; Educational environment; Perception, gender
Alraawi M. A, Baris S, Al-Ahmari N. M, Alshadidi A. A, Abidi N. H, Al-Moaleem M. M. Analyzing Students’ Perceptions of Educational Environment in New Dental Colleges, Turkey using DREEM Inventory. Biosc.Biotech.Res.Comm. 2020;13(2).
Alraawi M. A, Baris S, Al-Ahmari N. M, Alshadidi A. A, Abidi N. H, Al-Moaleem M. M. Analyzing Students’ Perceptions of Educational Environment in New Dental Colleges, Turkey using DREEM Inventory. Biosc.Biotech.Res.Comm. 2020;13(2). Available from: https://bit.ly/2ZPYFT6
Copyright © Alraawi et al., This is an open access article distributed under the terms of the Creative Commons Attribution License (CC-BY) https://creativecommns.org/licenses/by/4.0/, which permits unrestricted use distribution and reproduction in any medium, provide the original author and source are credited.
INTRODUCTION
Educational environment (EE) is a broad concept. Here, education encompasses teaching and learning, whereas the environment encompasses everything that surrounds. EE can be described as anything involved with educational institutions (Salam et al, 2014). In 1998, the World Federation of Medical Education highlighted EE as a target for the evaluation of health/dental education programs (WFME 1998). The effects of academic and clinical learning environments on dental students’ attitudes, knowledge, skills, progression, and behaviors are important determinants of education (Roff and McAleer, 2001). Evaluating EE in clinical and academic sites is important for providing of high-quality education and curriculum. The gap between student expectations and their actual experiences must be identified. However, differences exist between students’ experiences at the various levels of dental education (Chandran and Ranjan, 2014 Idon et al, 2015; Jnaneswar et al, 2016; Kang et al, 2017, Batra et al, 2018; Al-Saleh et al, 2018).
Roff et al., (1997) proposed the Dundee ready education environment measure (DREEM), a multidimensional and multicultural instrument that can measure the five separate fundamentals of EE, namely, students’ perceptions of learning (SPL), students’ perceptions of teachers (SPT), students’ perceptions of atmosphere (SPA), students’ academic self-perception (SASP), and students’ social self-perception (SSSP) (Roff et al, 1997). DREEM can be used to highlight the weaknesses and strengths of an educational institution, compare the performance and success of dental schools, and contrast the different levels of study and gender among students (WFME 1998; Roff et al, 2001). In addition, this tool can be used to help amend the curriculum, compare present and past programs, and evaluate the effectiveness of college curriculums (Al-Hazimi et al, 2004a; Bassaw et al, 2008. DREEM can also help health and dental schools distinguish their priorities (Roff et al, 2001; Al-Hazimi et al, 2004a; (Al-Hazimi et al, 2004b; Hammond et al, 2012; Denz-Penhey and Murdoch, 2009), while comparing their performance and productivities against their peers. The results of this comparison can be educationally insightful ((Al-Hazimi et al, 2004b). The use of DREEM is important in providing a consistent method for global comparisons among dental schools, thereby leading to the standardization of educational environments (Hammond et al, 2012). DREEM is successfully used in studies carried out in North America, Africa, Europe, South America, the Middle East, and Asia (Hammond et al, 2012).
The perceptions of students should be monitored in the continuous improvement of EE by defining its strengths and weaknesses (Hammond et al, 2012). Excellent learning is positively correlated with educators’ perceptions of EEs. It influences how, why, and what the students learn (Roff and McAleer, 2001; Mayya and Roff, 2004). Our private dental college was established 10 years ago. Since then, three groups have graduated, and we have plans of modifying the curriculum and studying plan. Thus, this cross-sectional study aimed to assess EE and the climate of undergraduate dental students’ perceptions at the different studying levels of a dental college in Turkey. It also plans to detect the gender differences among students’ perceptions and evaluate the association between EE and age, type of graduated school, level of education, total monthly family income, and type of housing.
MATERIAL AND METHODS
Design and Study Population: A cross-sectional questionnaire-based survey was administered to investigate the perception of students toward the EE of a dental school in Turkey. DREEM is a widely used instrument for collecting evidence about EE in dental schools in developed and developing countries. This tool was first developed at the University of Dundee and is now a global and generic “diagnostic inventory for measuring the quality of educational environment.”
Questionnaire Validation and Pilot Study: Questionnaire validation was performed on 20 students to review and determine if the questionnaire successfully measured as per the method of Bhosale (2015). The answers to each item were reviewed by the authors, and the requisite modifications and deletions were applied to validate the 50 items in the questionnaire. The validation criteria, such as time required to complete the questionnaire (20–30 minutes), appropriateness of questionnaire in collecting data, repetition or inappropriate questions, logical order of questions, clarity of questions, conciseness of questions, easy and meaningful instructions, and specified comments and suggestions on the application guidelines, were evaluated as well (Bhosale 2015; Wilson et al, 2012).
Data Collection: Ethical permission was obtained from the Faculty of Dentistry Board. All dental students from this college enrolled in Years III–V of the BDS program (185 in total) were the target participants. Therefore, universal sampling was used. The subjects were given the DREEM questionnaires and given a period of 20–30 minutes to retrieve and complete the questionnaire. Data were collected between December 2018 and February 2019. The aim of this study was explained, and consent was obtained from each participant.
Students were asked to read each statement carefully and respond using a five-point Likert scale as follows: 4 for strongly agree (SA), 3 for agree (A), 2 for uncertain (U), 1 for disagree (D), and 0 for strongly disagree (SD). Each student regardless of gender must apply his or her own current learning situation in answering the questions. However, 9 out of 50 items (numbers 4, 8, 9, 17, 25, 35, 39, 48, and 50) are negative statements and should be scored as follows: (0 for SA), (1 for A), (2 for U), (3 for D), and (4 for SD). The 50-item DREEM questionnaire has a maximum score of 200, which is the ideal EE, as perceived by the registrar. The minimum score of 0 will cause concern on any dental educator. The approximate guide to interpreting the overall score is presented as follows: (0–50) Very Poor, (51–100) Many Problems (This environment is viewed with considerable ambivalence by the students and thus needs improvement.), (101–150) More Positive than Negative, and (151–200) Excellent (Roff et al., 1997; Roff et al, 2001; Mayya and Roff, 2004; Al-Saleh et al, 2018; Idon et al, 2015; Jnaneswar et al, 2016; Batra et al, 2018; Kang et al, 2017; Ostapczuk et al, 2012).
The DREEM subscales are presented as follows: 1) SPL: 12 items, maximum score of 48; 2) SPT: 11 items, maximum score of 44; 3) SASP: 8 items, maximum score of 32; 4) SPA: 12 items, maximum score of 48; and 5) SSSP: 7 items, maximum score of 28 (Roff et al., 1997; Roff et al, 2001; Al-Saleh et al, 2018; Idon et al, 2015; Jnaneswar et al, 2016; Batra et al, 2018; Kang et al, 2017; Ostapczuk et al, 2012).
Data Statistical Evaluations: We used the IBM SPSS Statistics 22 (IBM SPSS, Türkiye) program for statistical analysis. The parameters were assessed via the Shapiro–Wilks test, and the results showed that the parameters conformed to the normal distribution. During the evaluation of the study data, the comparisons of quantitative data, descriptive statistical methods (mean, standard deviation), and categorical variables were presented in frequencies and percentages. One-way ANOVA was used in the intergroup comparisons of parameters, and Tukey HDS test was used to determine the differences among the group parameters (gender, age, type of graduated secondary school, level of education, monthly income, and type of housing). Student t-test was used in the intergroup comparisons of parameters. The Fisher–Freeman–Halton test was used to compare the qualitative data, and the statistical significance was evaluated at the level of p < 0.05.
RESULTS
A total of 171 completed questionnaires were collected from the students, reflecting a response rate of 96.67%. Demographic data are presented in Table 1. A total of 171 students responded to the questionnaire. The age of participants ranged from 21 to 26 years. As for gender, 92 (53.8%) were male, and 79 (46.2%) were female. The average age is 23.0 ± 1.4. (66.1%) between 21–23 years of age with 33.9% between 24–26 years of age. On the basis of the type of high school, 81.3% and 18.7% of the students graduated from government and private high schools, respectively. The response rates based on their year level in school were 56, 32.7%; 55, 32.2%; and 60, 35.1% for third, fourth, and fifth year students, respectively. On the basis of monthly family income, 20.5%, 56.1%, and 23.4% of the participants were below 3000 Turkish Lira, between 3000–6000 Turkish Lira, and over 6000 Turkish Lira, respectively. The majority of our participants at 74.3% lived with their families, whereas 25.7% resided in dormitories.
Table 1. Demographic profiles of respondents (n = 171)
| N | % | ||
| Gender | Male | 92 | 53,8 |
| Female | 79 | 46,2 | |
| Age | 21–23 | 113 | 66,1 |
| 24–26 | 58 | 33,9 | |
| Type of school | Government | 139 | 81,3 |
| Private | 32 | 18,7 | |
| Educational level | 3 | 56 | 32,7 |
| 4 | 55 | 32,2 | |
| 5 | 60 | 35,1 | |
| Monthly Family Income | Up to 3000 | 35 | 20,5 |
| Between 3000–6000 | 96 | 56,1 | |
| More than 6000 | 40 | 23,4 | |
| Housing | With family | 127 | 74,3 |
| Student housing | 44 | 25,7 |
Table 2 shows the mean and standard deviation (SD) of the DREEM items and subscales. The highest recorded value was 2.91 ± 1.04 for question number 28 (“I seldom feel lonely.”), whereas the minimum registered value was 1.2 ± 1.23 for question number 3 (a good support system was available for registrars who get stressed). Both questions are found in the SSSP subscale. The total mean and SD of the DREEM items was 100.61 ± 19.81, whereas the mean and SD of subscales based on the original values of the DREEM subscales SPL, SPT, SASP, SPA, and SSSP were 23.44 ± 5.57/48; 22.71 ± 4.56/44; 17.49 ± 4.09/32; 22.04 ± 6.67/48; and 14.94 ± 3.56/28, respectively (Table 3).
Table 2. Dental students’ mean item DREEM scores (n = 171)
| Mean ± SD | Median | |||
| SPL | 1 | I am encouraged to participate in teaching sessions. | 2,07 ± 1,09 | 2 |
| 7 | The teaching is often stimulating. | 2,34 ± 1,02 | 3 | |
| 13 | The teaching is registrar-centered. | 1,78 ± 1,01 | 2 | |
| 16 | The teaching helps develop my competence. | 2,21 ± 1,06 | 2 | |
| 20 | The teaching is focused well. | 1,81 ± 1,01 | 2 | |
| 22 | The teaching helps develop my confidence. | 2,11 ± 1,03 | 2 | |
| 24 | The teaching time is put to good use. | 1,73 ± 0,94 | 2 | |
| 25 | The teaching overemphasizes factual learning.* | 1,67 ± 1,01 | 1 | |
| 38 | The learning objectives of the course are clear to me. | 1,97 ± 1,01 | 2 | |
| 44 | The teaching encourages me to be an active learner. | 1,83 ± 1,1 | 2 | |
| 47 | Long-term learning is emphasized over short-term learning. | 2,5 ± 0,98 | 3 | |
| 48 | The teaching is too teacher-centered.* | 1,42 ± 0,88 | 1 | |
| SPT | 2 | The teachers are knowledgeable. | 2,35 ± 0,96 | 3 |
| 6 | The teachers espouse a patient cantered approach to consulting. | 2,35 ± 1,19 | 3 | |
| 8 | The teachers ridicule their registrars.* | 1,5 ± 1,01 | 1 | |
| 9 | The teachers are authoritarian.* | 1,19 ± 0,96 | 1 | |
| 18 | The teachers can effectively communicate with their patients. | 1,99 ± 1,09 | 2 | |
| 29 | The teachers regularly provide feedback to their registrars. | 2,43 ± 1,02 | 2 | |
| 32 | The teachers provide constructive criticism. | 1,94 ± 1,08 | 2 | |
| 37 | The teachers give clear examples. | 2,06 ± 1,01 | 2 | |
| 39 | The teachers get angry during teaching sessions.* | 2,09 ± 0,95 | 2 | |
| 40 | The teachers come to class prepared. | 2,14 ± 0,99 | 2 | |
| 50 | The registrars irritate the course organizers.* | 2,66 ± 1,11 | 3 | |
| SASP | 5 | The learning strategies that used to work for me are still effective until now. | 2,32 ± 0,92 | 2 |
| 10 | I am confident about passing this year. | 2,08 ± 1,08 | 2 | |
| 21 | I feel that I am being well prepared for my profession. | 2,15 ± 0,98 | 2 | |
| 26 | Last year’s work was good preparation for this year’s work. | 2,05 ± 0,97 | 2 | |
| 27 | I can memorize the important facts. | 1,7 ± 1,07 | 2 | |
| 31 | I learned a lot about empathy in my profession. | 2,5 ± 1,05 | 3 | |
| 41 | My problem-solving skills are developed well in this school. | 2,26 ± 0,91 | 2 | |
| 45 | The majority of my lessons are relevant to a career in healthcare. | 2,43 ± 0,99 | 3 | |
| SPA | 11 | The atmosphere is relaxed during consultations. | 1,98 ± 1,07 | 2 |
| 12 | The course is well timetabled. | 1,57 ± 1,16 | 1 | |
| 17 | Cheating is a problem in this course.* | 2,06 ± 1,19 | 2 | |
| 23 | The atmosphere is relaxed during lectures. | 1,84 ± 1,06 | 2 | |
| 30 | There are opportunities for me to develop interpersonal skills. | 1,68 ± 1,1 | 2 | |
| 33 | I feel socially comfortable during teaching sessions. | 1,85 ± 1,02 | 2 | |
| 34 | The atmosphere is relaxed during seminars/tutorials. | 1,9 ± 1,04 | 2 | |
| 35 | I find the experience disappointing.* | 1,63 ± 0,99 | 1 | |
| 36 | I can concentrate well. | 2,2 ± 1,06 | 2 | |
| 42 | The enjoyment outweighs the stress of studying medicine. | 1,59 ± 1,17 | 2 | |
| 43 | The atmosphere motivates me as a learner. | 1,87 ± 1,06 | 2 | |
| 49 | I feel that I can ask all the questions I want. | 1,88 ± 1,1 | 2 | |
| SSSP | 3 | There is a good support system for registrars who get stressed. | 1,2 ± 1,23 | 1 |
| 4 | I am too tired to enjoy this course. | 1,51 ± 1,07 | 1 | |
| 14 | I am rarely bored with this course.* | 2,05 ± 1,17 | 2 | |
| 15 | I have good friends in this course/school. | 2,61 ± 1,1 | 3 | |
| 19 | I have a good social life. | 2,16 ± 1,17 | 2 | |
| 28 | I seldom feel lonely. | 2,91 ± 1,04 | 3 | |
| 46 | I have a pleasant accommodation. | 2,51 ± 1 | 3 |
*Negative statements are scored in reverse.
Table 3. Mean scores of the total DREEM and its subscales
| Min–Max | Mean ± SD | Percentage of the maximum score | |
| Total DREEM | 43–153 | 100,61 ± 19,81 | 65,76% |
| SPL | 5–38 | 23,44 ± 5,57 | 61,68% |
| SPT | 11–34 | 22,71 ± 4,56 | 66,79% |
| SASP | 6–27 | 17,49 ± 4,09 | 64,78% |
| SPA | 6–39 | 22,04 ± 6,67 | 56,51% |
| SSSP | 6–23 | 14,94 ± 3,56 | 64,96% |
The results of the Student t-test showed that the total mean of DREEM items and subscales SPL, SPT, SASP, SPA, and SSSP scores were insignificantly different in terms of gender (male and female), age groups (21–23 and 24–26), and accommodation types (with family and student housing), and the p-values were greater than 0.05. Moreover, no statistically significant difference was observed between the total mean of DREEM items and subscale scores of SPL, SPT, SPA, and SSSP in relation to the type of graduated high school with p > 0.05). The SASP average scores of private high school students are significantly higher than those of government high school students (p = 0.042).
According to the level of education, the results of the ANOVA test showed that the total mean score of DREEM items was nearly significant at p = 0.053. No statistically significant difference existed among the total scores of subscales SPL, SASP, and SSSP in all the student levels with p > 0.05. However, a significant difference was observed between the classes in terms of SPT scores with p = 0.029. Post hoc comparisons were conducted to determine the origin of significance. The SPT scores of fourth level students were significantly higher than those of third level students with a p-value of 0.035. Furthermore, a statistically significant difference existed between the classes in terms of SPA scores (p = 0.035; p < 0.05). The SPA scores of fourth level students were significantly higher than those of third level students with a p-value of 0.038 (Table 4). Finally, the results of the ANOVA test showed that no significant difference was observed among the monthly income groups in terms of the DREEM total score and subscales SPL, SPT, SASP, SPA, and SSSP scores (p > 0.05).
Table 4. Mean Score of DREEM based on the Demographic and Education characteristics of Dental Students (n = 171)
| Total DREEM | SPL | SPT | SASP | SPA | SSSP | ||
| Mean ± SD | Mean ± SD | Mean ± SD | Mean ± SD | Mean ± SD | Mean ± SD | ||
| Gender | Male | 100,97 ± 22,18 | 23,52 ± 5,85 | 22,78 ± 4,67 | 17,73 ± 4,43 | 22,14 ± 7,51 | 14,79 ± 3,72 |
| Female | 100,19 ± 16,77 | 23,34 ± 5,25 | 22,63 ± 4,46 | 17,2 ± 3,67 | 21,91 ± 5,59 | 15,1 ± 3,39 | |
| 1p | 0,795 | 0,834 | 0,831 | 0,404 | 0,819 | 0,575 | |
| Age | 21–23 | 99,64 ± 20,27 | 23,24 ± 5,71 | 22,58 ± 4,43 | 17,31 ± 4,22 | 21,55 ± 6,56 | 14,96 ± 3,7 |
| 24–26 | 102,5 ± 18,93 | 23,83 ± 5,31 | 22,97 ± 4,84 | 17,83 ± 3,85 | 22,98 ± 6,84 | 14,9 ± 3,31 | |
| 1p | 0,373 | 0,514 | 0,606 | 0,435 | 0,184 | 0,918 | |
| Type of school | Government | 99,37 ± 20,05 | 23,14 ± 5,54 | 22,6 ± 4,67 | 17,18 ± 4,21 | 21,68 ± 6,66 | 14,77 ± 3,52 |
| Private | 105,97 ± 18,08 | 24,75 ± 5,57 | 23,19 ± 4,08 | 18,81 ± 3,28 | 23,56 ± 6,61 | 15,66 ± 3,7 | |
| 1p | 0,090 | 0,140 | 0,516 | 0,042* | 0,151 | 0,206 | |
| Educational level | 3 | 95,36 ± 18,67 | 22,05 ± 5,82 | 21,41 ± 4,22 | 16,79 ± 3,98 | 20,2 ± 5,9 | 14,91 ± 3,44 |
| 4 | 103,02 ± 20,75 | 23,91 ± 5,53 | 23,55 ± 4,65 | 17,82 ± 4,3 | 23,29 ± 6,7 | 14,45 ± 3,91 | |
| 5 | 103,3 ± 19,31 | 24,3 ± 5,2 | 23,17 ± 4,59 | 17,83 ± 4 | 22,6 ± 7,05 | 15,4 ± 3,34 | |
| 2p | 0,053 | 0,070 | 0,029* | 0,298 | 0,035* | 0,366 | |
| Monthly Family Income | Below 3000 | 99,26 ± 17,64 | 23,6 ± 4,49 | 22,2 ± 4,93 | 17,2 ± 3,72 | 21,83 ± 5,96 | 14,43 ± 3,14 |
| Between 3-6000 | 101,7 ± 20,45 | 23,36 ± 5,71 | 23,13 ± 4,54 | 17,72 ± 4,36 | 22,64 ± 6,68 | 14,85 ± 3,66 | |
| More than 6000 | 99,18 ± 20,35 | 23,48 ± 6,17 | 22,18 ± 4,29 | 17,18 ± 3,79 | 20,78 ± 7,19 | 15,58 ± 3,69 | |
| 2p | 0,720 | 0,977 | 0,412 | 0,703 | 0,328 | 0,362 | |
| Housing | With family | 100,94 ± 19,27 | 23,39 ± 5,38 | 22,8 ± 4,59 | 17,58 ± 3,91 | 22,2 ± 6,5 | 14,98 ± 3,49 |
| Student housing | 99,66 ± 21,52 | 23,59 ± 6,14 | 22,48 ± 4,51 | 17,2 ± 4,62 | 21,57 ± 7,21 | 14,82 ± 3,8 | |
| 1p | 0,714 | 0,834 | 0,691 | 0,599 | 0,592 | 0,801 |
1Student t test 2One-way ANOVA Test *p < 0.05
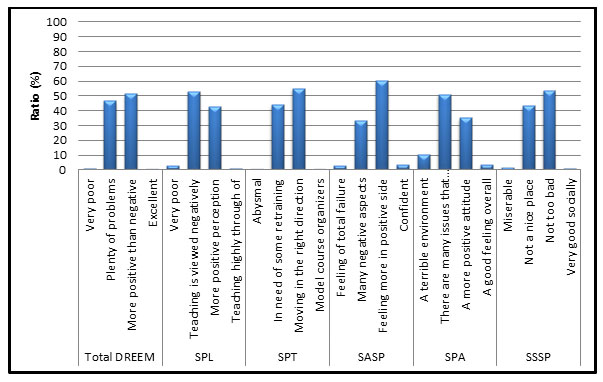
No statistically significant difference was observed between genders in terms of total DREEM score and all the subscale scores of the SPL, SPT, SASP, SPA, and SSSP distributions (p > 0.05) (Table 5 and Figure 1).
Table 5. Summary of association between gender and educational characteristics [DOMINE] with the mean score of DREEM and subscale of dental students (n = 171)
| Level of score based on domain | Gender n (%) | P value | ||
| Male | Female | Overall | ||
| Total DREEM | ||||
| Very poor | 2 (2,2%) | 0 (0%) | 2 (1,2%) | 0,585 |
| Many problems | 44 (47,8%) | 36 (45,6%) | 80 (46,8%) | |
| More positive than negative | 45 (48,9%) | 43 (54,4%) | 88 (51,5%) | |
| Excellent | 1 (1,1%) | 0 (0%) | 1 (0,6%) | |
| SPL | ||||
| Very poor | 4 (4,3%) | 1 (1,3%) | 5 (2,9%) | 0,358 |
| Teaching is viewed negatively | 50 (54,3%) | 41 (51,9%) | 91 (53,2%) | |
| More positive perception | 36 (39,1%) | 37 (46,8%) | 73 (42,7%) | |
| Teaching highly through of | 2 (2,2%) | 0 (0%) | 2 (1,2%) | |
| SPT | ||||
| Abysmal | 1 (1,1%) | 0 (0%) | 1 (0,6%) | 0,745 |
| In need of some retraining | 42 (45,7%) | 33 (41,8%) | 75 (43,9%) | |
| Moving in the right direction | 48 (52,2%) | 46 (58,2%) | 94 (55%) | |
| Model course organizers | 1 (1,1%) | 0 (0%) | 1 (0,6%) | |
| SASP | ||||
| Feeling of total failure | 3 (3,3%) | 2 (2,5%) | 5 (2,9%) | 0,466 |
| Many negative aspects | 26 28,3%) | 31 (39,2%) | 57 (33,3%) | |
| Feeling more in positive side | 59 (64,1%) | 44 (55,7%) | 103 (60,2%) | |
| Confident | 4 (4,3%) | 2 (2,5%) | 6 (3,5%) | |
| SPA | ||||
| A terrible environment | 11 (12%) | 7 (8,9%) | 18 (10,5%) | 0,463 |
| There are many issues that need changing | 45 (48,9%) | 42 (53,2%) | 87 (50,9%) | |
| A more positive attitude | 31 (33,7%) | 29 (36,7%) | 60 (35,1%) | |
| A good feeling overall | 5 (5,4%) | 1 (1,3%) | 6 (3,5%) | |
| SSSP | ||||
| Miserable | 3 (3,3%) | 0 (0%) | 3 (1,8%) | 0,531 |
| Not a nice place | 39 (42,4%) | 35 (44,3%) | 74 (43,3%) | |
| Not too bad | 49 (53,3%) | 43 (54,4%) | 92 (53,8%) | |
| Very good socially | 1 (1,1%) | 1 (1,3%) | 2 (1,2%) | |
Fishe– Freeman–Halton test
Figure 1: Percentages of the total score of DREEM and subscales
DISCUSSION
Roff and McAleer, 2001; Roff et al, 1997; Roff et al, 2001), developed and validated the DREEM scales using the standard methodologies of ground theory and Delphi panel of nearly 110 educators in the medical heath profession from different countries worldwide. Owing to the limited studies on dental colleges in Turkey, we conducted this study to assess gender differences in dental students’ perceptions of EE by using DREEM and investigate the relation among EE and age, type of graduated school, level of education, total monthly family income, and type of housing among the participants.
A traditional curriculum is teacher centered and discipline based without optional modules or electives. Teaching is primarily dependent on gathering information, with the teacher as the main source of information. Teaching methods consist of lectures, preclinical classes, and clinical sessions without or with limited problem-based sessions. In general, students view learning as something “done to them” by the teacher and the curriculum as an aggregate of separate subjects (Al-Hazimi et al., 2004a ; Al-Hazimi et al., 2004b). Previous dental studies used the DREEM items and showed that EE is positively correlated with academic success and satisfaction with the educational curriculum ( Thomas et al., 2009; Ostapczuk et al, 2012; Kossioni et al., 2012; Babar et al., 2015 Idon et al, 2015; Jnaneswar et al, 2016 Kang et al, 2017; Al-Saleh et al, 2018 Batra et al, 2018 ).
In the current study, the response rate was 96.67%, which was significantly higher than some of the earlier studies conducted in different dental schools worldwide in (Saudi Arabia, Riyadh 60.73%; Croatia, Nibal, & India 26.9%; and Greece 64%) (Al-Saleh et al, 2018; Batra et al, 2018; Kossioni et al., 2012). However, similar results were obtained in the studies from Bhubaneswar City (88.14%) and Odisha (92.68%) in India, Nigeria (95%), and New Zealand (82%–94%) (Idon et al, 2015; Jnaneswar et al, 2017; Kang et al, 2017). The percentage of male to female participants in this study was 53,8%/46,2%, which was similar to that in Al Saleh et al., 2018 in Riyadh (44%/56%) and Kang et al., 2017 in New Zeland (50%/50%) but higher than that in Idon et al., 2015 (38%/62%) and Jnaneswar et al., (2017) (66.4%/33.6%) in India.
In the overall DREEM score (Table 3), the recorded/obtained score was 100,61 ± 19,81, which indicates a “more positive than negative perception” and “many problems.” These findings were partially consistent with the scores obtained in Germany for the first level (81) and among interns in SA (105 ± 21.3), Al-Saleh et al, 2018; Ostapczuk et al., 2012, but inconsistent with those in India (119.65 ± 19.68, 124) and New Zealand (127.7/200, 145) for the fifth year, Nigeria (145.6/200) for the second year, Germany (122.95 ± 15.52), and Riyadh (118.36 ± 15.8) for SA (Jnaneswar et al., 2016; Kang et al., 2017; Idon et al., 2015; Ostapczuk et al., 2012; Al-Saleh et al., 2018).
The recorded scores for the DREEM subscales are presented in Table 2. SPL, SPT, SASP, SPA, and SSSP obtained the scores of 23,44 ± 5,57/48; 22,71 ± 4,56/44; 17,49 ± 4,09/32; 22,04 ± 6,67/48; and 14,94 ± 3,56/28, respectively. The majority of the scores clearly obtained at least 50% of the original score in the DREEM subscales, except SPL and SPA. This finding shows students’ perception of learning and atmosphere. These scores are significantly less than those of subscales of dental studies conducted in each of the following countries such as India (Chandran and Ranjan., 2014; Jnaneswar et al., 2016), in Nigeria, Germany, Greece (Idon et al., 2015; Ostapczuk et al., 2012; Kossioni et al., 2012), and a single study conducted in India, Croatia, and Nepal (Batra et al., 2018). Our results were similar to the scores in (Al-Saleh et al., 2018), in Riyadh SA, which recorded the scores of 25.30/48, 24.42/44, 19.80/32, 25.16/48, and 14.47/28, for SPL, SPT, SASP, SPA, and SSSP, respectively. İn addition, no significant difference was detected among the five DREEM subscales, and this finding is consistent with those studies Thomas et al., 2009,Chandran and Ranjan., 2014; Al-Saleh et al., 2018; Jnaneswar et al., 2016).
The different demographic parameters of our participants and their relation to the total DREEM items and subscales are presented in Tables 1 and 4. No significant difference existed in terms of gender, age, monthly family income, and housing. This finding is consistent with those of previous studies. However, significant differences (p = 0.042) were observed between high school-graduate students in SASP likely because most of the students graduated from the government schools (81.3%). Moreover, significant differences were detected between the different student levels in the overall total DREEM and SPT and SPA. A similar finding was detected in Jnaneswar et al., (2015) in the SPT subscale. Gender did not significantly affect the EE of students’ self-perceptions in this Turkish college. Similar findings were obtained among dental students in SA (Al-Saleh et al., 2018), in Greece (Kossioni et al., 2012), and New Zealand (Kang et al., 2017). However, gender differences were recorded in other DREEM studies conducted in India (Chandran and Ranjan., 2014 and Jnaneswar et al., 2015).
Regarding the registered DREEM score in the different levels, fourth- and fifth-year students recorded higher scores (103,02 ± 20,75 and 103,3 ± 19,31) than third-year students (95,36 ± 18,67). These values were entirely different from the DREEM score obtained by the second-year students in studies by Chandran and Ranjan., 2014; Bhosale U., 2015; Al-Saleh et al., 2018. These studies determined that second year students obtained the highest DREEM scores due to the total number of participants in their studies.
More than a quarter of the students who spent almost 2–3 years in this college scored in the problem areas. Hence, additional investigations must be conducted. The subscales were mainly observed in the learning and atmosphere subscales (SPL and SPA), whereas the lowest scores were obtained in 50 DREEM items, which indicated that the teaching was excessively teacher-centered, a good support system was available for stressed students, and students who were too tired to enjoy the course (Table 2). İn this study, many DREEM items obtained scores of less than 2, but question numbers 3, 4, and 48 achieved the lowest scores. This finding is consistent with Idon et al., 2015 and Thomas et al., 2009, but inconsistent with those of Ostapczuk et al., 2012 and Kossioni et al., 2012, likely due to the number of changes and improvements in their study plans and the number of service years in the institute, which is only 10 years in our institute compared with other studies that have more years in academic service (Table 1).
The overall results of this study were consistent with those conducted in India (Chandran and Ranjan., 2014; Jnaneswar et al., 2016; Thomas et al., 2009), SA (Riyadh), Nigeria, New Zealand, and Greece (Al-Saleh et al., 2018; Idon et al., 2015; Kang et al., 2017; Kossioni et al., 2012), but inconsistent with those in Babar et al., 2015 in Malaysia, which concluded that stress was a major factor affecting their dental students because the items in their DREEM scale failed to monitor if the students were feeling stressed in relation to the different levels of studying, gender, monthly family income, housing, or graduated high school types.
The limitation of the DREEM scale and its subscales in relation to dental EEs is the exclusion of questions related to the dental educational program, including clinical requirements of students, such as filling of carious teeth, removable and fixed prostheses, extraction of badly broken down teeth, and root canal treatments, and a community program of services, including preventive programs of oral hygiene. These factors were ignored in the design of DREEM items and subscales.
CONCLUSIONS
The total DREEM mean score indicated a more positive than negative perception (50%) and many problems (48%), and the DREEM scores for the third, fourth, and fifth year students were 95,36 ± 18,67, 103,02 ± 20,75, and 103,31 ± 19.31, respectively. Gender, age, monthly family income, and housing types had no significant differences and did not influence the findings. However, a significant difference existed in SASP at p = 0.042 in the graduated school type and the different levels of education in SPT and SPA. Among the DREEM items, question number 28 (“I seldom feel lonely.”) obtained the highest recorded value at 2.91 ± 1,04, whereas question number 3 (“A good support system is available for registrars who feel stressed.”) obtained the minimum value at 1.2 ± 1,23. Both questions were found in the SSSP subscale.
REFERENCES
Al-Hazimi A, Al-Hyiani A, Roff S (2004a). Perceptions of the educational environment of the medical school in King Abdul Aziz University, Saudi Arabia. Med Teach; 26(6):570–573.
Al-Hazimi A, Zaini R, Al-Hyiani A, et al (2004b). Educational environment in traditional and innovative medical schools: a study in four undergraduate medical schools. Educ Health (Abingdon); 17(2):192–203.
Al-Saleh S, Al-Madi EM, AlMufleh B, Al-Degheishem Al (2018). Educational environment as perceived by dental students at King Saud University. Saudi Dent J; 30: 240–49.
Babar MG, Hasan SS, Ooi YG, Ahmed SI, Wong PS, Ahmad SF, MNM-Rosdy NM, Malik NM (2015). Perceived sources of stress among Malaysian dental students. Int J Med Educ; 6:56-61.
Bassaw B, Roff S, McAleer S, et al (2003). Students’ perspectives on the educational environment, Faculty of Medical Sciences, Trinidad. Med Teach; 25(5):522–526.
Batra M, Malčić AI, Shah AF, Sagtani RA, Mikić IM, Knežević PT, et al (2018). Self-Assessment of Dental students’ Perception of Learning Environment in Croatia, India and Nepal. Acta stomatol Croat; 52(4):275-285.
Bhosale U (2015). Medical Students’ Perception about the Educational Environment in Western Maharashtra in Medical College using DREEM Scal. J Clinical Diagnostic Research; 9(11): JC01-JC04.
Chandran CR, Ranjan R (2014). Students’ perceptions of educational climate in a new dental college using the DREEM tool. Adv Med Educ Prac; 5:177–184.
Denz-Penhey H, Murdoch JC (2009). A comparison between findings from the DREEM questionnaire and that from qualitative interviews. Med Teach;31(10):e449–e453.
Hammond SM, O’Rourke M, Kelly M, Bennett D, O’Flynn S (2012). A psychometric appraisal of the DREEM. BMC Med Educ; 12:2-6.
Idon PI, Suleiman IK, Olasoji HO (2015). Students’ Perceptions of the Educational Environment in a New Dental School in Northern Nigeria. J Educ Practice; 6(8): 139-147.
Jnaneswar A, Suresan V, Jha K, Das D (2016), Subramaniam GB, Kumar G. Students’ perceptions of the educational environment measured using the Dundee Ready Education Environment Measure inventory in a dental school of Bhubaneswar city, Odisha. J Indian Assoc Public Health Dent; 14: 182-7.
Kang I, Foster LA, Anderson VA, Thomson WM, Broadbent JM (2017). Changes in students’ perceptions of their dental education environment. 2. Euro J Dent Education ISSN 1396-5883.
Kossioni AE, Varela R, Ekonomu I, Lyrakos G, Dimoliatis IDK (2012). Students’ perceptions of the educational environment in a Greek Dental School, as measured by DREEM. Eur J Dent Educ; 16: e73–e78.
Mayya S, Roff S (2004). Students’ perceptions of educational environment: a comparison of academic achievers and under-achievers at Kasturba Medical College, India. Educ Health (Abingdon); 17(3): 280–291.
Ostapczuk MS, Hugger A, de Bruin J, Ritz-Timme S, Rotthoff T (2012). Students’ perceptions of the educational environment in a German dental school as measured by the Dundee Ready Education Environment Measure. Eur J Dent Educ; 16(2): 67-77.
Roff S, McAleer S (2001). What is educational climate? Med Teach; 23(3): 333–334.
Roff S, McAleer S, Harden RM, et al (1997). Development and validation of the Dundee Ready Education Environment Measure (DREEM). Med Teach; 19(4):295–299.5
Roff S, McAleer S, Ifere OS, Bhattachar S (2001). A global diagnostic tool for measuring educational environment: comparing Nigeria and Nepal. Med Teach; 23(4):378–382.
Salam A, Akram A, Bujang AM, et al (2014). Educational environment in a multicultural society to meet the challenges of diversity. J App Pharm Sci; 4(09):110–113.
The Executive Council of WFME (1998). International standards in medical education, assessment and accreditation of medical schools’- educational programs. A WFME position paper. Med Educ; 32(5): 549–558.
Thomas BS, Abraham RR Alexander M, Ramnarayan K (2009). Students’ perceptions regarding educational environment in an Indian dental school. Medical Teacher; 31: e185–e188.
Wilson FR, Pan W, Schumsky DA (2012). Recalculation of the critical values for Lawshe’s content validity ratio. Measurement and Evaluation in Counseling and Development MEC; 45:197-210.

