Master of Plant Breeding, Istanbul, Turkey.
Corresponding author email: icnfsci@gmail.com
Article Publishing History
Received: 05/04/2021
Accepted After Revision: 13/06/2021
This research aimed was to establish an indoor amount of environmental tobacco smoke (ETS) by calculating particulate matter less than 2,5 μm (PM 2,5) as the predictor of the ETS in hospitalities across the environment of the college. . We established smoking conditions in business establishments and analyzed internal quantities of PM 2.5 at 20 internet cafes, 38 pubs, and 20 billiard rooms employing a sidepak am510 direct-reading handheld real-time display from October 2014 to December 2015. In 65% of internet coffee shops and 85% of billiard shelters in 2015, cigarettes were found. The incidence in pubs that had been officially banned from smoking declined from 33,3 percent in 2014 to 10 percent in 2015.
The total 2015 concentration of PM 2.5 in Internet cafes, bars, and pool sheds was 98.6 μg/ m3, 29.6 μg/ m3, and 135.4 μg/ m3, respectively. PM 2.5 levels in online coffee shops and billiard rooms were 2 to 2.7 times higher than the 24-hour intake level (50 μg/m3) for outside PM 2.5 established by the Korean Ministry of Environment. While a prohibition on smoking was placed on internet cafes and bars, smoking was already occurring in those areas. For the effectiveness of law-based efforts to protect employers and employers’ wellbeing from second-hand exposure to smoke, more strict compliance is essential. A cigarette prohibition should be enforced in billiards rooms as soon as possible.
Analysis, Smoking of Cigarettes, Environmental Tobacco
Karasakal A . Analysis of an Indoor Amount of Environmental Tobacco Smoke (ETS) by Calculating Particulate Matter. Biosc.Biotech.Res.Comm. 2021;14(2).
Karasakal A . Analysis of an Indoor Amount of Environmental Tobacco Smoke (ETS) by Calculating Particulate Matter. Biosc.Biotech.Res.Comm. 2021;14(2). Available from: <a href=”https://bit.ly/3vkW6Fj“>https://bit.ly/3vkW6Fj</a>
Copyright © Karasakal This is an open access article distributed under the terms of the Creative Commons Attribution License (CC-BY) https://creativecommns.org/licenses/by/4.0/, which permits unrestricted use distribution and reproduction in any medium, provide the original author and source are credited.
INTRODUCTION
Smoking of cigarettes, cigars, tobacco piping, etc., which resulting in second-hand smoke-exposure is created by environmental tobacco smokers (ETS). It consists of mainstream smoke(s) and sidestream smoke (SS) emitted after an artificial tobacco product dissipated by cigar smoke. The empirical confirmation of passive smoking has contributed to many human illnesses, conditions, and fatalities. ETS is significant as it is one of the primary contaminants determining indoor environmental quality. It includes approximately 60 forms of compounds reported or believed to be human carcinogens, namely nitrosamines, benzopyrenes, beta naphthylamine, and polonium 210. Approximate 30% of deaths from cancer are induced by smoking, and second-hand smoke has led to several health consequences, including lung cancer, cardiac failure, and allergies (Muhibbu-din, 2020, Omrani and Fataei, 2018, Zaeimdar et al., 2019, Aletor, 2021).
This is why ETS is listed as a category of (known) cancerous agents as recommended by the Environmental Protection Agency (EPA) and from the data of various studies conducted on plants as well. ,(Barth, 2021). ETS has since been classified as a carcinogenic material of the same classification as asbestos or benzene by the US National Institute of Occupational Health and Safety. Moreover, cigarette smoke can quickly disperse and is impossible to eliminate such that it is exposed to a vast number of individuals, regardless of the smoker’s purpose. General banning on the smoking of crowded locations, including the workstations, restaurants, and pubs, is followed by using centers for disease prevention (CDCs) according to these threats as evidenced by several; studies like that of Khayatnezhad and Gholamin, (2020a).
Many experiments on indicator materials have been conducted (Jia et al., 2020) to quantify and test airborne ETS quantities, including around 6,000 chemical substances (Khayatnezhad and Gholamin, 2020b, Hewitt, 2021). A sense with optimal circumstances that physically and chemically alter due to the development of ETS is hard to characterize (Si et al., 2020, Huma et al., 2021). The usage of nicotine by young people with a comparatively high prevalence of smoking under the auspice of the WHO-funded framework convention on tobacco control (FCTC) is to be minimized in a realistic regulative attempt. This bans smoking in some public indoor-atmosphere places, including schools, internet cafes, and restaurants, through national health enforcement acts throughout these places (Gholamin and Khayatnezhad, 2020a, Kabir et al., 2021).
A smoking ban is increasingly being extended in leisure areas, including billiards as small sporting venues. In Korea’s smoking, 39.4% of male adults (age 19 and older) are estimated to decrease steadily, according to national health and nutrition surveys (2015).In comparison, this study recorded a smoking prevalence rate of 42.3% for males and 5.6% for females in the 10–19 age category, the third-highest average (Korea center for illness control and avoidance) (Fataei, 2017, Ghomi Avili and Makaremi, 2020, Radmanesh, 2021). Youngsters, i.e., people aged 19 to 24 years, were 2.45 (95% CI: 1.60, 3.73) times more possibly to smoking than those aged 60 years and over (Karasakal et al., 2020a, Gholamin and Khayatnezhad, 2021).
Excellent health behaviors between younger people are extremely significant since these patterns are sustained throughout the period and can significantly influence individual wellbeing. Besides, there is a need to maintain the smoking ban program’s efficacy in the banquet centers. Throughout this report, we measured the extent of second-hand smoke emission by calculating PM 2.5 as an ETS measure in online cafes, pubs, and billiards, both places where younger people consume a substantial level of time in the 20s, in the vicinity of a university campus in Changwon, South Korea. We have also surveyed the rate of enforcement of the prohibition of smoking in online cafes and pubs that are listed as non-smoking places under the National Health Promotion Act and also examine the need to quit smoking in billiard rooms not yet set down for non-smoking.
MATERIAL AND METHODS
This research included 78 interior rooms, comprising 20 online cafes, 38 pubs (18 before and 20 after), and 20 billiard facilities throughout 3 km of the college campus for three months (among October and December) in 2014 (before regulation, 18 pubs) and the same three months in 2015 (following principles, n=60). In the context of the bar, the same locations were preferred before and following the rules.
Evaluation of airborne : ETS sensitivity properties were studied through screening PM 2.5, a marker of airborne ETS volumes. The atmospheric PM 2.5 quantities in the internal air were calculated at a stream rate of 1.7 L/min employing a sidepak real-time aerosol sensor (version AM510, TSI Inc., Shoreview, mn 55126, USA), which is a light-emitting-type direct-reading instrument that measures mass level by spreading light with a wavelength of 670 nm. Because the light-emitting procedure calculates mass quantities as a function of particle size and refractive indicator, the second-hand smoking intensity was determined by adding a conversion factor of 0.295 to the specified values ( Gholamin and Khayatnezhad, 2020d, Li et al., 2021, Sun et al., 2021).
To concentrate on particulate substance with a diameter of 2.5 μm or greater, a PM 2.5 impactor was mounted to the sidepak, and zero adjustment was conducted employing a HEPA (high-efficiency particulate air) detector until the screening. On the weekdays between 7:00 pm and 11:00 pm, and 5 minutes before and after the implementation of the internal inspections outside of the houses, the field investigator examined the hostel sites and assessed the concentration of PM 2.5. The concentration of the internal PM 2.5 was considered for around 40 minutes by putting the lateral pack on a table or seat was not influenced explicitly by PM 2.5 origins, including doors, windows, or ventilation. Over 1-min periods the samples were drawn. The amount of the interior room, the percentage of smokers, and the air-conditioning were also reported during the measurement, impacting the concentration dispersion.
Estimation and computation of smoking density (SD): During the measurement phase, smoking cigarettes and the number of fans mounted at the ventilation site was recorded. DLR130 assessed the internal venue volume (Robert bosch tool corp., mt. prospect, Malaysia)
RESULTS AND DISCUSSION
As seen in Table 1, the incidence of smoking in the three forms of acceptance areas across the university, namely cafes, bars, and billiards, was 65%, 15.8 %, and 85%. For bars and internet cafés, smoking was still present on the spot, while a national health promotion act appointed smoke-free areas as from 1 January 2015. The smoking incidence throughout pubs was lowered in 2015 by implementing the regulation from 33.3% (6/18) to 10% (2/20).
Kim et al. registered a 42 percent smoking rate in bars before the regulation on the smoking prohibition. Nevertheless, Billiards are not identified as smoke-free places, with three installations showing the maximum smoking incidence. Eight bars and thirteen online cafes have reported smoking, and the indoor prohibition must be strictly implemented to enhance indoor air characteristics. For the three forms of wellness centers, the range of the PM 2,5 levels in the interior air was the log-normal according to the W-test (p<0,01).
The distribution of PM 2,5 concentrations across the three forms of installations was statistically significantly different (p<0,001). The PM 2.5 values were spread about 4.4 times greater in billiard facilities than the bars (p<0.001), and a gap between the maximum and minimum was about 48.9 fold. There was a gap in disseminating PM 2,5 both prior and following the smoking control legislation between online cafes and billiard rooms.
Correlation analyzes were conducted to evaluate the association between SD and PM 2.5 in accommodation locations. As seen in Fig. 2, the association rate was 0.58. Previous experiments have documented the connection between internal concentrations of PM 2.5 and SDs in guest rooms. In the United States, PM 2.5 tended to have an excellent relationship to SD in 10 accommodation sites, like restaurants and bars (Arjaghi et al., 2021, Esmaeilzadeh et al., 2020). The associations among SD and PM 2.5 amounts were found in the above analysis (r=0.576, p<0.005). The frequency of PM 2,5 is more associated than the number of tourists or the filtering method, which is most definitely attributed to the smoking’s relation to internal PM 2.5 dissemination.
According to earlier reports, passive smoking represents about 90% to 96% of breathable suspended matter in accommodation sites (casinos, pubs, billiard rooms) ( Rodríguez, 2021). The PM 2.5 content was determined better to represent the smoking state of the replacement material. The median level of PM 2.5 throughout online cafes authorized to smoke (13 of 20) was 127.8 μg/ m3, which was substantially greater (p<0.05) than online cafes where cigarettes were banned (44.5 μg/ m3). The PM 2.5 levels were around three times greater in smoking spaces than non-smoking spaces in billiard facilities. The magnitude of the statistical disparity may, nevertheless, not be verified in the context of breweries.
According to WHO’s FCTC (Huang et al., 2021), due to tightening the legislation on the banning of cigarettes, the rates of smoking in Korea have been steadily declining. In South Korea, the Korea Centre for Disease Control and Prevention (Gholamin and Khayatnezhad, 2020b) announced that the incidence of sensitivity to second-hand smoking between non-smokers decreased to 57.9% in 2013, 52.1% in 2014 35.4% in 2015 following the public-sector anti-smoking legislation. Billard facilities, though, have been listed as entertainment rather than as public rooms, and the smoking ban has concentrated only on billard corridors that have greater than 1,000 capacities. In most billiard rooms, the number of people is much lower. Therefore, much of the billard corridors have not yet been regulated and display the maximum PM 2.5 level.
Inhalation of second-hand smoke is extremely probable. Thus, similar training and public access must be improved, and the smoking prohibition program expanded to Small Sports Centres to reduce the dangers posed by second-hand tobacco. The smoking ban law, if successful, is extremely effective in increasing the consistency of indoor air and alleviating quantities of the internal PM 2.5 , Wan, 2021). Throughout sustainable smoking prohibitions, stringent compliance and frequent surveillance are essential factors. One solution to minimize second-hand smoking is enforcing strict punishments for smokers in public areas.
Assessment of air modality employing AOI: To estimate the extent of environmental pollution, the US EPA has introduced an air quality index (AQI) utilizing the PM 2.5 levels (Alayi et al., 2020). This AQI has measured internal air competence for accommodation facilities. The mean unsafe values considering 24 hours of intake in PM 2.5 concentrations of indoor air have been calculated using billiard corridors (135.4 μg/ m3) and online cafes (98.6 μg/ m3). One online cafe and one billiard room were also rated as attaining the dangerous stage, which implied urgent upgrading of the internal air. In previous research, elevated PM 2.5 was also recorded when smoking was permitted in accommodation locations. The average of PM 2.5 (n = 62) values was 161μg/m (4.6 times greater than our air quality index) for smoking restaurants and Kentucky bars throughout the United States (Khayatnezhad and Gholamin, 2021a, Karasakal et al., 2020b).
The study’s drawbacks are as follows: Initially, PM 2.5, the measure provided for ETS, could be influenced by a broad range of causes apart from cigarette smoke, like interior and exterior burning, indoor games, preparation, washing, etc. Second, only breweries were chosen for study settings surrounded by a college campus, so only those bars can be described. Therefore, the bars were chosen for the prevalence of smoking and other internal setting considerations without any preliminary details. Third, about the transmission of the particulates, the effectiveness of the ventilation system and the internal air-conditioning were not calculated ( Fataei et al., 2018).
The form and theory of air ventilation system, the rate of air-conditioning, and the operational process are essential since ventilation rate is a determining factor of indoor air quality. Fourth, since the monitoring duration overlaps with the duration for end-term learners’ tests, which decreases the number of consumers in the locations, a sampling outcome could be a downgrading. The sample calculation time and the number of specimens should be regarded to correctly evaluate and validate each accommodation site’s reference value. The control of second-hand smoke exposure at these multi-use sites, the clarification of the compliance levels of the smoking truce program, and the improvement of the applicable legislation would in the future be crucial to increase public safety.
Table 1. Overview of smoking practices and sample findings for PM 2.5 levels across three forms of accommodation facilities in 2014–2015.
Table 1. Summary of smoking conditions and sampling results
| Year | Smoking status | No. Venues | Average of fans | Average of volume | Average smoking | Arithemetic Mean | GM | Range |
| Internet Cafes | 20 | 10.5 | 441.6 | – | 98.6 | 91.5 | 9.5 | |
| 13 | 10.5 | 539.4 | 0.036 | 127.8 | 100.9 | 233 | ||
| 7 | 10.6 | 259.9 | – | 44.5 | 29.2 | 9.5 | ||
| PUBS Total | 38 | 4.4 | 352.4 | – | 30.8 | 26.8 | 6.1 | |
| 20 | 4.4 | 635.2 | 0.006 | 30.3 | 30.2 | 28.1 | ||
| 2 | 8 | 313 | – | 29.5 | 24.1 | 6.1 | ||
| 18 | 4 | 360.4 | – | 32.2 | 29.3 | 9.4 | ||
| 18 | 4.3 | 404.9 | 0.005 | 41 | 39.9 | 25.7 | ||
| 6 | 6 | 338.1 | – | 27.9 | 25.2 | 9.4 | ||
| 12 | 3.5 | 451.2 | – | 135.4 | 121.8 | 10.9 | ||
| Biliard Hals | 20 | 5.9 | 437.7 | 0.021 | 150.8 | 143.1 | 90.1 | |
| 17 | 6.7 | 527.5 | – | 47.6 | 32.9 | 10.9 | ||
| 3 | 1 |
Figure 1: Evaluation of combined chance diagrams of PM 2.5 levels for three forms of accommodation sites.
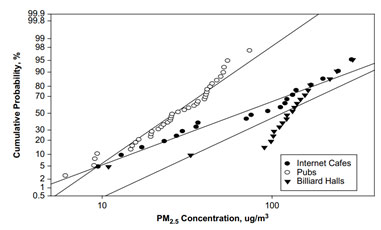
Figure 2: Regression evaluation of PM 2.5 amounts and smoking intensities within smoking areas (y = 85.6 + 1,621.1x, r = 0.58).
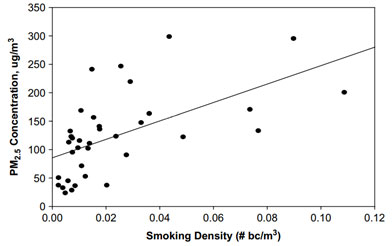
Figure 3: Estimating indoor air quality relies on PM 2.5 levels in online cafes, bars, and billiard facilities, utilizing six EPA AQI types.
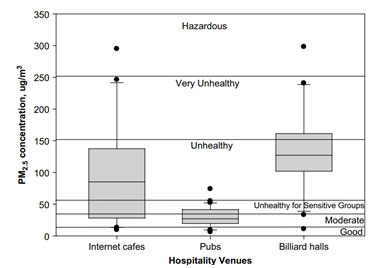
The columns’ central rows are the average values; the columns’ lower and higher limits are the 25th and 75th percentiles, respectively; the whiskers are the maximum data points inside the 10th and 90th percentiles, respectively; the actual data sets are outliers.
CONCLUSION
The research findings have been as follows. Firstly, throughout the billion rooms where the smoking ban legislation was not enforced, smoking was most substantial in specific accommodation locations near the university. Despite the enforced legislation (alcohol prohibition), smoking always took place in online cafes or bars. For both online cafes and bars, tighter smoking ban enforcement is mandatory. Secondly, in the range of billiard facilities, online cafes, and bars, the PM 2.5 as a marker used for cigarette ambient smoke was more incredible.
AQI assessments reveal that the standard of air in bars is reasonable; however, most online cafes and billiard shops are health dangers. Thirdly, the PM 2.5 levels of smoking locations were statistically more significant in online cafes and bars than in particular areas where smoking was banned (p < 0.05). The smoking ban incidence is rising according to mandatory standards, and the frequency of indoor air PM 2.5 is also diminishing. Fourth, the National Health Promotion Act’s application must be expanded to the billiard facilities, where ETS quantities are most remarkable, to stop the guests and staff from passively smoking and preserve public health.
REFERENCES
Alayi, R., Sobhani, E. & Najafi, A. 2020. Analysis Of Environmental Impacts On The Characteristics Of Gas Released From Biomass. Anthropogenic Pollution Journal, 4, 1-14.
Aletor, S. 2021. Environmentally Induced Alternative Livelihood Strategies Among The Artisanal Fishers Of The Kainji Lake Basin, Nigeria. Water And Environmental Sustainability, 1, 1-7.
Arjaghi, S. K., Alasl, M. K., Sajjadi, N., Fataei, E. & Rajaei, G. E. 2021. Retraction Note To: Green Synthesis Of Iron Oxide Nanoparticles By Rs Lichen Extract And Its Application In Removing Heavy Metals Of Lead And Cadmium. Biological Trace Element Research, 1-1.
Barth, O. 2021. The Effect Of Supplemental Instruction On Educational Accomplishments And Behaviors Of Organic Chemistry Scholars. Water And Environmental Sustainability, 1, 30-36.
Esmaeilzadeh, H., Fataei, E. & Saadati, H. 2020. Nh3 Removal From Sour Water By Clinoptilolite Zeolite: A Case Study Of Tabriz Refinery. Chemical Methodologies, 4, 754-773.
Fataei, E. 2017. Soil Carbon, Nitrogen And Phosphorus Pools Under Exotic Tree Plantations In The Degraded Grasslands Of Iran. Agricultural & Biological Research, 33, 113-127.
Fataei, E., Varamesh, S. & Seiied Safavian, S. T. 2018. Effects Of Afforestation On Carbon Stocks In Fandoghloo Forest Area. Pakistan Journal Of Agricultural Sciences, 55.
Gholamin, R. & Khayatnezhad, M. 2020a. Assessment Of The Correlation Between Chlorophyll Content And Drought Resistance In Corn Cultivars (Zea mays). Helix, 10, 93-97.
Gholamin, R. & Khayatnezhad, M. 2020b. The Effect Of Dry Season Stretch On Chlorophyll Content And Rwc Of Wheat Genotypes (Triticum durum L.). Bioscience Biotechnology Research Communications, 13, 1833-1829.
Gholamin, R. & Khayatnezhad, M. 2020d. The Study Of Path Analysis For Durum Wheat (Triticum Durum Desf.) Yield Components. Bioscience Biotechnology Research Communications, 13, 2139-2144.
Ghomi Avili, F. & Makaremi, M. 2020. Predicting Model Of Arsenic Transport And Transformation In Soil Columns And Ground Water Contamination (Case Study: Gorgan Plain, Iran). Anthropogenic Pollution Journal, 4, 57-64.
Hewitt, E. 2021. Ecological Plunging And Wireless Filming For Science Education: A New Zealand Pilot Experimeent. Water And Environmental Sustainability, 1, 24-29.
Huang, D., Wang, J. & Khayatnezhad, M. 2021. Estimation Of Actual Evapotranspiration Using Soil Moisture Balance And Remote Sensing. Iranian Journal Of Science And Technology, Transactions Of Civil Engineering, 1-8.
Huma, Z., Lin, G. & Hyder, S. L. 2021. Promoting Resilience And Health Of Urban Citizen Through Urban Green Space. Water And Environmental Sustainability, 1, 37-43.
Jia, Y., Khayatnezhad, M. & Mehri, S. 2020. Population Differentiation And Gene Flow In Rrodium Cicutarium: A Potential Medicinal Plant. Genetika, 52, 1127-1144.
Kabir, K., Arefin, S. M. A. & Hosain, M. T. 2021. Analysis Of Momentary Variations In The Quality Of Water On Specific Criteria In Cole Mere. Water And Environmental Sustainability, 1, 8-12.
Karasakal, A., Khayatnezhad, M. & Gholamin, R. 2020a. The Durum Wheat Gene Sequence Response Assessment Of Triticum Durum For Dehydration Situations Utilizing Different Indicators Of Water Deficiency. Bioscience Biotechnology Research Communications, 13, 2050-2057.
Karasakal, A., Khayatnezhad, M. & Gholamin, R. 2020b. The Effect Of Saline, Drought, And Presowing Salt Stress On Nitrate Reductase Activity In Varieties Of Eleusine Coracana (Gaertn). Bioscience Biotechnology Research Communications, 13, 2087-2091.
Khayatnezhad, M. & Gholamin, R. 2020a. A Modern Equation For Determining The Dry-Spell Resistance Of Crops To Identify Suitable Seeds For The Breeding Program Using Modified Stress Tolerance Index (Msti). Bioscience Biotechnology Research Communications, 13, 2114-2117.
Khayatnezhad, M. & Gholamin, R. 2020b. Study Of Durum Wheat Genotypes’ Response To Drought Stress Conditions. Helix, 10, 98-103.
Khayatnezhad, M. & Gholamin, R. 2021b. Impacts Of Drought Stress On Corn Cultivars (Zea Mays L.) At The Germination Stage. Bioscience Research, 18, 409-414.
Khayatnezhad, M. & Nasehi, F. 2021. Industrial Pesticides And A Methods Assessment For The Reduction Of Associated Risks: A Review. Advancements In Life Sciences, 8, 202-210.
Li, A., Mu, X., Zhao, X., Xu, J., Khayatnezhad, M. & Lalehzari, R. 2021. Developing The Non‐Dimensional Framework For Water Distribution Formulation To Evaluate Sprinkler Irrigation. Irrigation And Drainage.
Muhibbu-Din, I. 2020. Investigation Of Ambient Aromatic Volatile Organic Compounds In Mosimi Petroleum Products Depot, Sagamu, Nigeria. Anthropogenic Pollution Journal, 4, 65-78.
Omrani, M. & Fataei, E. 2018. Synthesizing Colloidal Zinc Oxide Nanoparticles For Effective Disinfection; Impact On The Inhibitory Growth Of Pseudomonas Aeruginosa On The Surface Of An Infectious Unit. Polish Journal Of Environmental Studies, 27.
Radmanesh, M. 2021. Evaluation Of The Efficient Management Of Greenhouses For Healthy Items In The Province Of Alborz. Water And Environmental Sustainability, 1, 20-23.
Ren, J. & Khayatnezhad, M. 2021. Evaluating The Stormwater Management Model To Improve Urban Water Allocation System In Drought Conditions. Water Supply.
Rodríguez, R. 2021. The Study Of Enzyme-Water Mutualism Theory. Water And Environmental Sustainability, 1, 44-49.
Si, X., Gao, L., Song, Y., Khayatnezhad, M. & Minaeifar, A. A. 2020. Understanding Population Differentiation Using Geographical, Morphological And Genetic Characterization In Erodium Cicunium. Indian J. Genet, 80, 459-467.
Sun, Q., Lin, D., Khayatnezhad, M. & Taghavi, M. 2021. Investigation Of Phosphoric Acid Fuel Cell, Linear Fresnel Solar Reflector And Organic Rankine Cycle Polygeneration Energy System In Different Climatic Conditions. Process Safety And Environmental Protection, 147, 993-1008.
Wan, G. 2021. Discussing Climate Change: Pathways, Origins, Significant Subjects And Developed Guidlines According To Research Taken Place In China. Water And Environmental Sustainability, 1, 13-19.
Zaeimdar, M., Tavakoli, F. & Lahijanian, A. 2019. The Impact Of Environmental Education On The Environmental Behavior Of Elementary School Students (Case Study: Students In Tehran). Anthropogenic Pollution Journal, 3, 37-42.

