Department of Computer Science, Avinashilingam Institute for Home Science and Higher Education for Women,
Coimbatore, Tamil Nadu, India.
Corresponding author email: radhasrimail@gmail.com
Article Publishing History
Received: 01/10/2020
Accepted After Revision: 25/11/2020
Pancreatic cancer causes the fourth most cancer-related death in humans worldwide. Early detection of this cancer will improve patient’s survival rate considerably. In this paper, we propose an image processing and machine learning system for the exact recognition of pancreatic cancer using PET/CT scan images. The proposed system implicates 5 main elements, i.e., pre processing, segmentation, feature extraction, feature selection (optimization) and classification. Removal of noises in the image is the major step for the exact identification of tumor, if noises persist; it will provide an in-accurate result. Pre-processing is done as an initial step in removing the noises followed by segmentation in identifying the tumor location; here a novel approach of saliency-based k-means clustering algorithm is utilized to isolate the object from background. Since the features extracted from segmented images consist of irrelevant features, it reduces the classification accuracy in disease recognition. So, efficient feature selection method is introduced in this research work to improve the classification performance.
To improve feature selection results, initially, image segmentation is carried out by using saliency-based k-means clustering segmentation, and then feature extraction is done by using First Order and Second Order Statistical features by GLCM and GLRM. Feature selection methods such as PSO and whale optimization methods are utilized. The results obtained by these methods indicate the potential advantages of using feature selection techniques to improve the classification accuracy with a smaller number of feature subset. From the result, one can conclude that the performance of whale is superior to PSO method for classification. Machine Learning Techniques are widely used for the cancer classification. The machine learning classifiers such as DT, KNN, SVM and AdaBoost with ensemble KNN – SVM classifier are utilized to classify the tumor as normal or abnormal. Finally, the proposed framework achieves a classification accuracy of 98.3%.
Adaboost, Ensemble, Pancreatic Cancer, Pet/Ct, Whale Optimization Algorithm (WAO).
Sindhu A, Radha V. An Optimal Feature Selection with Whale Algorithm and Adaboost Ensemble Model for Pancreatic Cancer Classification in PET/CT Images. Biosc.Biotech.Res.Comm. 2020;13(4).
Sindhu A, Radha V. An Optimal Feature Selection with Whale Algorithm and Adaboost Ensemble Model for Pancreatic Cancer Classification in PET/CT Images. Biosc.Biotech.Res.Comm. 2020;13(4). Available from: https://bit.ly/36a2eoA
Copyright © Sindhu and Radha This is an Open Access Article distributed under the Terms of the Creative Commons Attribution License (CC-BY) https://creativecommons.org/licenses/by/4.0/, which permits unrestricted use distribution and reproduction in any medium, provide the original author and source are credited.
INTRODUCTION
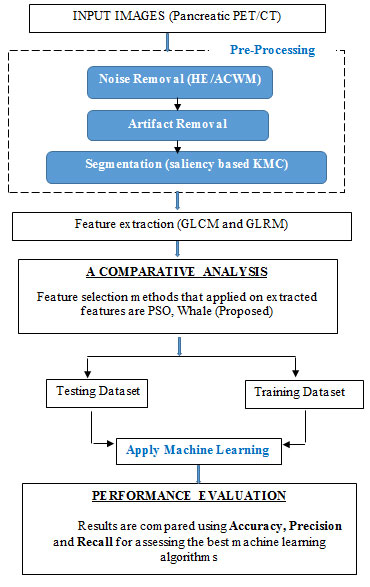
Pancreatic cancer is the 9th typical cancer in women then the 10th typical cancer in men and 4th most cancer related death worldwide. It reasons for ‘7%’of all cancer deaths. There are currently no strategies for preventing pancreatic cancer, so early recognition of this syndrome is a major aspect and plays an important role in reducing death rate. Interpreting the PET/CT scan image is the finest approach to assess early on the existence of pancreatic cancer. However, various studies have shown that in addition of having high rates of false positives, physicians can miss the recognition of a substantial part of abnormalities. Feature extraction plays a significant role in classifying the disease in pancreatic cancer detection. Transformation of the segmented image into a set of features are called Feature Extraction. The block diagram for the proposed experimentation is shown below (Shah et al., 2015).
Pre-processing stage in this system is to eliminate the noise and artifact present in the image. Next, K-Means Clustering based on saliency is used to segment the tumor area that is situated on a non-uniform basis. GLCM and GLRM perform feature extraction technique after the segmentation. A Whale Optimization Algorithm (WAO) technique was then proposed for selecting the best features and is compared with particle Swarm optimization (PSO) for selecting the features. Finally, Using the Adaboost with Ensemble KNN-SVM classifier, all the extracted features are classified as normal tumor or abnormal tumor. This section highlights the various techniques applied to identify the pancreatic tumor.
Pancreatic cancer can be identified at an early stage by preprocessing the CT images using median filter and classified by minimum distance classifier and achieved the accuracy of 65% as stated by (Shah et al., 2015). Sheelakeshvan et al., (2017) suggested that 60% accuracy can be achieved during classification. In the early stages from CT scans, pancreatic cancer can be diagnosed by using different filters such as Median, Gaussian filters with Image segmentation and Artificial Neural Network (ANN) classifiers (Akhtar, Gupta and Ekbal, 2017).
Balakrishna et al., (2018) proposed the computer aided diagnostic model for pancreatic tumor in CT scan images. Median, Gaussian and Wiener noise filtering methods are applied on CT images for preprocessing. Comparing other filters, Wiener provides best results based on certain metrics such as PSNR (Peak Signal Noise Ratio), SNR (Signal Noise Ratio) and MSE (Mean Square Error). SFTA (Segmentation-based Fractal Texture Analysis) approach utilized for extracting the features from objects. For classification system, several machine-learning algorithms are applied but SVM classifier produces results that are more relevant. Li and Jiang (2019) proposed a CAD model, in which simple linear iterative clustering (SLIC) is performed for segmentation, PCA (Principal Component Analysis), is developed for feature selection, and finally (HFB-SVM-RF) approach is aimed to identify the normal and abnormal pancreatic cancer and achieved the accuracy of 96 % (Sarangi, Samal and Sarangi, 2019).
MATERIAL AND METHODS
The research work is implemented on MATLAB software tool and utilized as a user-friendly interface. For the experimental tests, the PET/CT image dataset is used in this framework. The architecture proposed consists of models of pre-processing, removal of artifacts, segmentation, Feature Extraction (FE), Feature Selection (FS) and Classification (Balakrishna and Anandan, 2018). It is described in the below figure.
Figure 1: System Overview
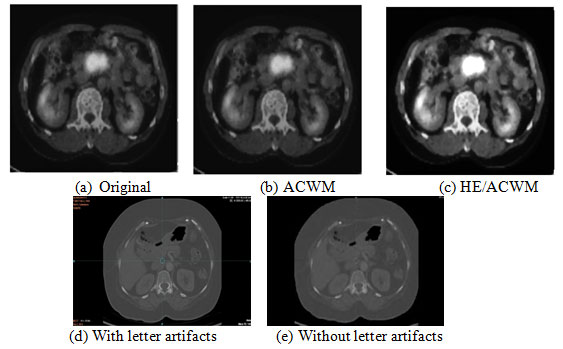
This Model is designed to help the radiologist reliably in identifying the abnormalities in pancreatic cancer. For preprocessing, in a digital image, a pixel’s brightness characteristics have an effect on background noise and therefore image pre-processing becomes necessary. Improving the image quality and making it ready for further processing by eliminating the unnecessary noises and artifacts in the PET/CT context is the main goal of image pre-processing system. Figure 2, shows the pre-processing stage, where the Median based filter that is a ‘ nonlinear’ noise filter type is applied to minimize the input image noise effects without blurring the edges (Shah and Surve, 2015).
The process of this filter is to arrange the pixel values in any order (ascending or descending) and then to calculate the center weighted median value and to replace the noisy pixel with that value. In addition, HE (Histogram Equalization) that is an Image Processing technique utilized for enhance the image contrast. The Image enhancement consists of creating the visual illusion, that the image is more realistic for machine vision applications. Hence, noise are removed by Histogram Equalization/ Adaptive Center Weighted Median filter (HE/ACWM) and removing the letter artifacts by Combination of Standard Deviation and Computational Geometry Technique (Ali et al., 2020).
Figure 2: Image pre-processing steps.
Image segmentation is the partitioning of an image into many components. The goal is to simplify and transform the representation of an image in to something more concrete and easier to analyze. The key goal is to acquire the location of the apprehensive area to aid in identifying and classifying the anomalies as cancerous tissue, benign or malignant. The saliency-based KMC (K-Means Clustering) technique is used for the segmentation in our system.
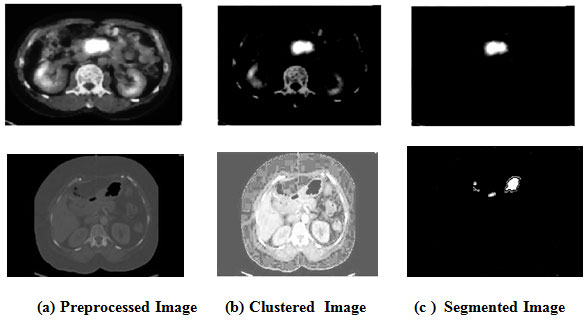
In clustering algorithms, the medical image is commonly over segmented. Salient objects recognition can provide valuable data to enhance the segmentation performance. Segmenting the salient vectors with ‘ k- means clustering ‘ is a powerful methodology. Saliency technique extents the feature element channels of pixels into the histogram instance to ascertain the spatial difference variation just as assess the saliency of the pixel concerning various pixels in the entire image. In any case, the assessed feature assignments using histogram are discontinuities at the holder edges. Subsequently, the proposed strategy utilizes clustering to dodge the discontinuities at the compartment edges just as in this K–means is used. Below figure demonstrates the segmentation results of pancreatic cancer in PET/CT images (Huang, Zhan and Liang, 2020).
Figure 3: Segmented Images
Feature Extraction (FE) is the process involved in analyzing the image texture. The results give a better understanding of texture and object manners determination. When the algorithm has more input data set, it should to be converted in to a smaller dimension for better handling. Converting input image into a normal set of features is termed as FE. By employing FE procedure on the segmented images, pixel group was converted in to a numerical data by the process of feature extraction. The features considered in this effort are mainly GLCM (Grey Level Co-occurrence Matrix) for extracting the statistical features and GRLM (Gray-Level Run-Length Matrix) for extracting the run length features and its procedures are given below.
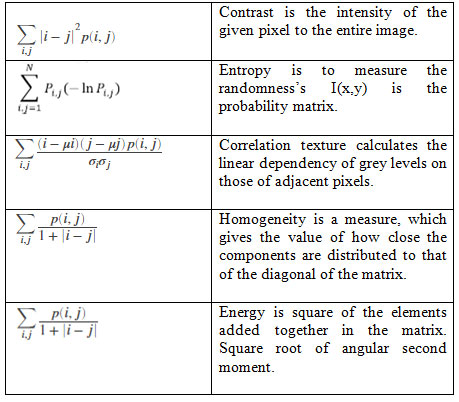
GLCM method extracts ‘texture features’ and maintains a relationship among pixels by calculating the ‘grey level co-occurrence’ values. This method is calculated on the ‘conditional probability density’ functions ‘p (i, j | d, ș) ‘ and on selected direction of ‘ș = 0, 45, 90, 135°’, etc., and on distances, d varying from 1 to 5. The function p (i, j | d, ș) is the probability between two pixels, that are located with an inter sample distance ’d’ and a direction ‘ș’, with gray level ‘i’ and ‘j’ and this distance is termed as spatial relationship [9]. The significant features of GLCM are Contrast, Correlation, Energy, Entropy and Homogeneity (Sheelakeshvan, Anandan and Balakrishna, 2017).
Table 1. GLCM Features
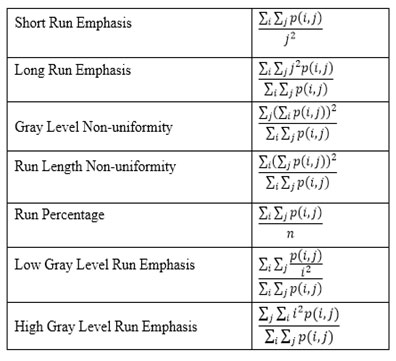
GRLM is represented in the form of a matrix for geometrical features. It gives a measure of the intensity of the pixels along the given direction mentioned as Run length. It has two dimensions. Here, each element is represented as the number of components ‘j’ with the intensity ‘i’, in the specified directions. In that direction, the ‘run-length matrix’ estimates for every gray level value how many times the run occur. Whether 2 successive pixels have the same intensity value, next time it takes for 3 pixels and compares it and next it goes for 4 and so on. The length of the run is the number of pixel points in the run (Sindhu and Radha, 2019). Features extracted by GLRM were
Table 2. GLRM Features
Table 3. Sample Features (GLCM and GLRM)
| GLN | HGRE | LGRE | LRE | RLN | RP | SRE | Entropy | Contrast | Correlation | Energy | Homogeneity |
| 1.88E+02 | 1.88E+02 | 18.90997 | 8.92E+03 | 19.70096 | 0.014204 | 0.202363 | 0.019676 | 0.977205 | 0.439465 | 0.990878 | 0.392195 |
| 1.73E+02 | 1.73E+02 | 24.80303 | 9.29E+03 | 22.38788 | 0.014323 | 0.230632 | 0.017115 | 0.983738 | 0.399594 | 0.991884 | 0.362678 |
| 1.69E+02 | 1.69E+02 | 43.92917 | 6.26E+03 | 54.20417 | 0.018676 | 0.34041 | 0.017303 | 0.981196 | 0.425729 | 0.991839 | 0.341882 |
| 1.43E+02 | 1.43E+02 | 45.60367 | 4.78E+03 | 1.10E+02 | 0.023758 | 0.456583 | 0.019706 | 0.981333 | 0.415898 | 0.991073 | 0.393606 |
| 1.45E+02 | 1.45E+02 | 70.64591 | 2.09E+03 | 3.27E+02 | 0.047098 | 0.557324 | 0.007082 | 0.991682 | 0.424758 | 0.996459 | 0.323678 |
| 1.75E+02 | 1.75E+02 | 49.05833 | 5.91E+03 | 1.22E+02 | 0.020947 | 0.458996 | 0.007059 | 0.991407 | 0.433409 | 0.996471 | 0.364919 |
| 1.57E+02 | 1.57E+02 | 68.42647 | 4.53E+03 | 1.38E+02 | 0.026993 | 0.464515 | 0.003504 | 0.99447 | 0.478787 | 0.998248 | 0.240268 |
| 1.68E+02 | 1.68E+02 | 65.75422 | 5.37E+03 | 81.96811 | 0.021158 | 0.401881 | 0.008093 | 0.990455 | 0.417807 | 0.995954 | 0.261234 |
| 8.86E+03 | 8.86E+03 | 1.10E+02 | 8.93E+03 | 2.82E+02 | 0.066261 | 0.087273 | 0.008063 | 0.990115 | 0.426659 | 0.995968 | 0.269861 |
| 8.09E+03 | 8.09E+03 | 1.09E+02 | 9.94E+03 | 2.11E+02 | 0.060265 | 0.077951 | 0.007877 | 0.99094 | 0.419566 | 0.996061 | 0.270785 |
| 7.58E+03 | 7.58E+03 | 1.07E+02 | 1.09E+04 | 1.80E+02 | 0.056244 | 0.071496 | 0.007462 | 0.991163 | 0.426729 | 0.996269 | 0.278193 |
| 7.74E+03 | 7.74E+03 | 1.08E+02 | 1.09E+04 | 1.97E+02 | 0.05751 | 0.070797 | 0.016464 | 0.979329 | 0.441869 | 0.992265 | 0.312901 |
| 8.06E+03 | 8.06E+03 | 1.08E+02 | 1.02E+04 | 2.03E+02 | 0.060005 | 0.073954 | 0.011021 | 0.985145 | 0.447876 | 0.994717 | 0.368355 |
| 1.45E+04 | 1.45E+04 | 1.18E+02 | 5.58E+03 | 1.30E+03 | 0.110004 | 0.182276 | 0.017171 | 0.976331 | 0.489616 | 0.992137 | 0.297284 |
| 8.69E+03 | 8.69E+03 | 1.10E+02 | 9.91E+03 | 2.51E+02 | 0.064957 | 0.076918 | 0.016008 | 0.98073 | 0.428192 | 0.992723 | 0.348569 |
| 9.65E+03 | 9.65E+03 | 1.12E+02 | 8.64E+03 | 3.69E+02 | 0.07238 | 0.091151 | 0.023718 | 0.975637 | 0.402358 | 0.988865 | 0.255592 |
| 8.20E+03 | 8.20E+03 | 1.09E+02 | 1.08E+04 | 2.47E+02 | 0.061073 | 0.08131 | 0.026104 | 0.975176 | 0.385267 | 0.98792 | 0.247635 |
| 8.67E+03 | 8.67E+03 | 1.10E+02 | 9.94E+03 | 3.10E+02 | 0.064804 | 0.094248 | 0.016256 | 0.980206 | 0.443261 | 0.992374 | 0.452256 |
| 1.20E+04 | 1.20E+04 | 1.15E+02 | 6.79E+03 | 6.70E+02 | 0.090691 | 0.126116 | 0.015332 | 0.984463 | 0.402466 | 0.992685 | 0.243327 |
Where ‘Pi’j represents the total number of runs with intensity ‘i’ also length ‘j’. The GLRM features which acquired are utilized for the machine learning algorithms for improving the accuracy in terms of classification as well as detection. Sample features are listed below.
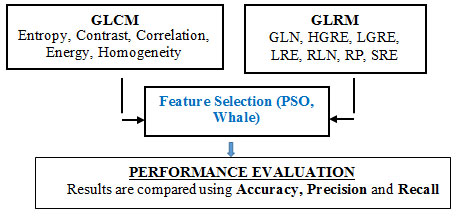
Feature selection section deals with the optimizers for an effective feature selection. To discuss the working mechanism of the proposed optimizer, the preliminary background of PSO and whale optimization algorithms are presented here.
Figure 4: Feature Selection system
Feature selection is to be converted in to a more reliable and suitable form for the classifier to classify the cancer cell category. This paper introduced the Whale optimized features for machine learning algorithms to classify the normal and abnormal tumors in PET/CT images of pancreas. Meanwhile, the proposed algorithm has been compared with PSO algorithm in terms of accuracy, precision and recall with the machine-learning algorithm (Sindhu and Radha, 2019).
Particle Swarm Optimization (PSO) is a randomly determined optimization technique copied from herds of birds or else schools of fish. The flock of birds (swarm) has learnt a co-operative method to discover food and every bird in the swarm, changes the hunt model according to their learning knowledge. The concept of PSO algorithm is related to evolutionary algorithm and swarm artificial life systems. The particles in the swarm (Birds) openly fly over the multidimensional search space. Through the trip, every particle creates its individual velocity along with location. By updating of each particle, the entire population is updated (Sindhu and Radha, 2020). The swarm arrangement drives itself, to move toward the point of upper target function value and in the end the particles assemble around this point
The steps of particle swarm optimization are as follows:
Step 1: Initialization – The swarm particles lie within the pre-defined ranges of velocity and position.
Step 2: Velocity Updating – At every cycle the speeds of the swarm particles are calculated.
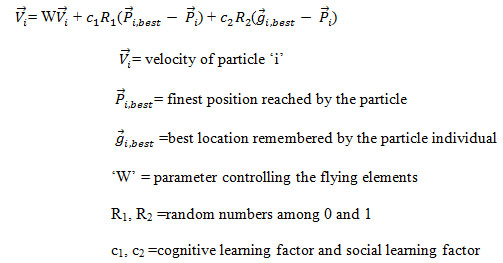
The inclusion of variables of each particle gives the PSO, the facility of correctness in searching. The weighing aspects c1, c2 avoid collision among the particles (individuals). After updating particle, I, velocity v and random number r is verified also protected in a range indicated, to evade collision.
Step 3: Updating of position – There is an interval among succeeding iterations and hence the positions of the particles undergo change as in below equation.

After refreshing, ![]() must be verified and in the allowable range.
must be verified and in the allowable range.
Step 4: Updating of memory – Update ![]() using the formula as in below equations,
using the formula as in below equations,

Step 5: Destination Checking – The technique iterates steps 2 to 4 until definite end states are reached, for a specified number of iterations, when ended. The estimation of ![]() and
and ![]() give the result.
give the result.
The fitness values are not considered in PSO algorithms. This is a big computational advantage over other algorithms, when the population is huge. Arithmetic operation of real numbers is used for calculation of velocity and position. The disadvantages as seen in PSO are non-optimal tuning of input features and PSO is one-way information sharing mechanism. In PSO ![]() gives information to others (Sindhu and Radha, 2020).
gives information to others (Sindhu and Radha, 2020).
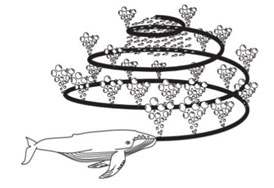
For WHALE Optimization Algorithm (WOA), lately there has been developing enthusiasm for WOA, which was proposed. This hunt and advancement calculation is a scientific reenactment of the conduct and development of humpback whales as they continued looking for food and arrangements. WOA has motivated by the Bubble-net assaulting system, where the whales begin focusing on fish by making winding formed air pockets around their fish down to 12 meters deep from the surface, and afterward, they swim back up to trap and catch their focused-on fish.
In light of the general places of whales, in this calculation, the investigation procedure is spoken to by the irregular pursuit of food, which can be scientifically interpreted by refreshing the old arrangements as opposed to picking the best ones through haphazardly choosing different arrangements. Notwithstanding this intriguing conduct, WOA is quite recognized from other improvement calculations, since it just needs to modify two parameters. These parameters make it conceivable to change easily between both the abuse and investigation forms (Sindhu and Radha, 2020).
Figure 5: Encircling Attack Prey Searching Methodology for Hump Back Whales
In the following section, we will describe the mathematical model of encircling prey, searching for prey, and spiral bubble-net foraging man oeuvre.
For the encircling prey, by the rising total number of iterations from start to an extreme number, humpback whales encircle the prey also update their location in the direction of the finest search agent. We can mathematically formulate this behavior as: If (p<0.5 and mod (U) <1)
Then the position of the candidate position X (t+1) is updated in the subsequent equations
D= mod {(C.X)-X (t)} X (t+1) = [X (t) – {U.D}]
Anywhere p =0.1 (constant) X (t+1) is the best position in the current situation. U and D are calculated by the following equations U= mod {2.a.r-a} C=2.r
Where a is linearly decreases from 2 to 0 and r is the randomly selected vector
In prey searching mechanism, X is replaced with the random variables Xrandom and mathematical equation are given as follows
D= mod {(C.Xrandom)-X(t)} X(t+1) = [Xrandom (t) – {U.D}]
The encircling the prey and spiral updating of the prey has been done during the exploration phase of whale optimization algorithm. The mathematical expression for updating of new position during the spiral process is given in the below equation
X(t+1) =Dl.ebl.cos(2πl) + X*(t)
Where D is the distance between the new position and updated position in new generation, b is the constant, which varies from 0 to 1.For ML Algorithms for Classification, the majority of classification system uses supervised learning. All the data are labelled and the algorithms learn to predict the output from the training data. This research applies some ML classification techniques such as DT, KNN, SVM then AdaBoost with Ensemble KNN-SVM and demonstrates all classification algorithm’s performance on selected features.
Decision tree (DT): DT is a decision care tool, which utilizes a tree like graph of decisions to classify the data.K-Nearest Neighbor (KNN): Which assigns a class based on the most frequent class among the patterns in the neighborhood. Support Vector Machines (SVM): Classifies the data based on the concept of decision planes. AdaBoost with Ensemble KNN-SVM algorithm: In classification algorithms, each one has its own advantage and disadvantage. So, AdaBoost with Ensemble SVM-KNN algorithm is compared with above mentioned algorithms to achieve the highest accuracy then others. The working mechanism of proposed algorithm is explained in the below section. In proposed technique, KNN technique discovers the distance among test sample and training sample.
A significant job of KNN is to catch out the neighbors first and it has been classifying the request sample on the mainstream class of its nearest neighbors. The proposed ensemble (KNN-SVM) classification method can be utilized powerfully for pancreatic cancer classification with less computational complexity in the training as well as detection stage. The lesser computational energy is acquired from KNN method, which does not essential building of a feature space. KNN technique has been utilized in the proposed hybrid approach KNN-SVM as the first step in the pancreatic tumor classification then the SVM technique is established in the 2nd phase as a classification machine of this ensemble model (Sindhu and Radha, 2018).
Adaboost is an iterative approach for improving the classification of the poor classifiers. Algorithm based on Adaboost allocates variant weights to any observation at the primary stage. The weight imposed on the misclassified results will increase after a few iterations, and vice versa, the correctly classified will have fewer weights. The weights on the observations are the measures of the class to which the observation belongs, thereby minimizing the misclassification of the observation while at the same time significantly improving the efficiency of the classifiers. That’s mostly aimed at reducing variance, boosting is a technique consisting of fitting sequentially multiple poor learners in a very adaptive manner, each model in the sequence is equipped to give more importance to observations in the dataset that were treated badly in the sequence by previous model (Siqi and Hyian, 2019).
Algorithm: AdaBoost with Ensemble KNN – SVM classifier
Input: PET/CT Pancreatic images with class label (benign or malignant) i.e. (X1, C1),(X2, C2)… (Xn, Cn);
Feature pool F= {fm, m=1… n}; Number of iterations = R
Initialization: Weight of each features
![]()
For r = 1 to R do:
- Generate a training set by sampling with {wi(r)}
(b) Train base classifier hr ((Proposed Ensemble Classifier)) by this training set
- Apply SVM classifier on PET/CT data set with K-fold cross-validation and K=10.
- Update the weights.
- According to Wolfe dual form, weight minimization is

- Predict the test PET/CT class using the cross validated model with minimum weight.
- Develop weighted KNN Classifier with number of nearest neighbors K=10 on PET/CT data set.
- Apply K-fold cross validation with K=10.
- Weight contribution of each k neighbor
- Set initial weights of KNN = updated minimum weights of SVM.
- Xt is test PET/CT image

- Predict the test PET/CT class using the cross validated model with minimum weight.
- Take weighted average of predictions from both the models.
(c) Compute the training error of hr:

In the above equation, I ∈ (-1, 1), IA is indicator of A; we assume (∈<0.5) Set:

(We have αr > 0) Update the weights by:
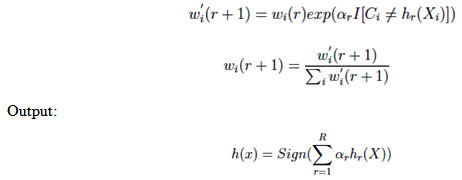
AdaBoost with ensemble KNN-SVM as component classifier for pancreatic cancer classification. Proposed scheme gives classification accuracy of 98.3% for pancreatic PET/CT classification. Results reveal that proposed AdaBoost with ensemble KNN-SVM outperforms other methods.
RESULTS AND DISCUSSION
In order to test and assess the proposed system, totally 119 PET/CT pancreatic images of 50 to 71-year-old patients confined from 2016 to 2018 are taken as an input images, going to the two types such as benign and then malignant (Sindhu and Radha, 2019).
Performance Evaluation: The PSO and WAO features, which are extracted from the datasets, are utilized for training as well as testing system. For valuation, 80% of data were taken for training and then 20% of data were taken for testing. The assessment is accepted for the different algorithms with the below parameters.

Where TP, TN, FP and FN denote ‘True Positive’, ‘True Negative’, ‘False Positive’ and ‘False Negative’ values and ‘DR’ and ‘TNI’ Represents total Number of ‘Detected Results’ and ‘Total number of Iterations’ [10]. The performance of the proposed algorithms has been assessed by various cases which are shown in the below table,
Table 4. Comparison of Optimization Techniques with ML
| Description | Algorithm used | Accuracy | Precision | Recall |
| Machine Learning Algorithms | SVM | 80.7% | 92 | 86 |
| DT | 89.9% | 90 | 78 | |
| KNN | 90.8% | 96 | 92 | |
| Adaboost ensemble | 95.8% | 96 | 93 | |
| Optimization
Technique |
PSO-
Adaboost ensemble |
96.6% | 94 | 100 |
| Whale-
Adaboost ensemble |
98.3% | 97 | 100 |
In the evaluation scenario, pancreatic tumor is considered for the classification and different comparative analysis are shown in above table.
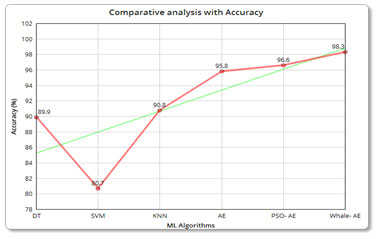
Accuracy analysis: The below figure clearly shows accuracy of the Whale based optimization has a maximum accuracy when compared with the other techniques.
Figure 6: (a) Comparative analysis with Accuracy
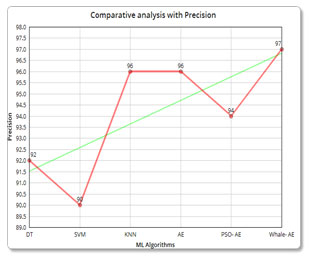
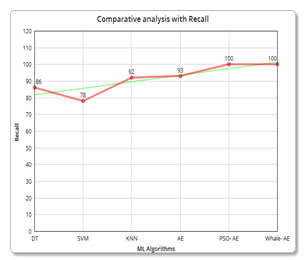
Precision and Recall analysis: Again, the precision and recall has been calculated and compared with the other algorithms in which the whale-based technique outperforms the other algorithms.
Figure 7: (b) Comparative analysis with Precision
Figure 8: (c) Comparative analysis with Recall
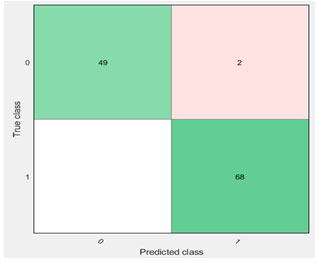
The above diagram clearly shows that whale optimization technique based on Ensemble algorithm gives the best results when compared with others. The feature selection and ML algorithm provided by the MATLAB machine-learning toolbox is utilized for assessing the effort of the proposed methodology and calculates the number of normal and abnormal cancer present in the testing dataset. 119 data were taken for analysis. Among that, 20% has been taken as testing data and the 80% has been taken as training data. With this the accuracy percentage of Whale-Adaboost ensemble algorithm has been reached with 98.3%. According to that, 1.7% of data comes under misclassification scenario.
Figure 9: Confusion Matrix Whale-Adaboost Ensemble
Whale-Adaboost ensemble algorithm reached the maximum accuracy when compared with other algorithms. According to the confusion matrix, 49 cases has been classified under normal and 68 cases has been classified under ab-normal. The remaining two (misclassification) cases may be normal or ab-normal cases (Sindhu and Radha, 2020).
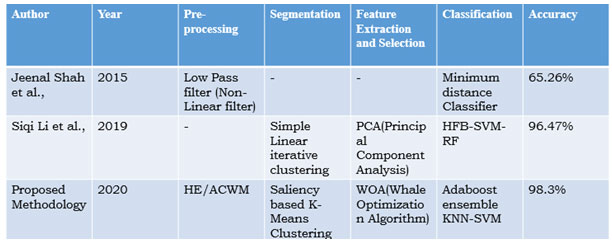
Table 5. Comparison of Previous Work
Many imaging modalities are used for the diagnosis of pancreatic cancer. Jeenal Shah et al., utilized a minimum distance classifier to detect the pancreatic cancer in PET/CT image and they found out to be 65.26% accuracy at the year of 2015[4]. Then, Siqi Li et al., designed a hybrid feedback-support vector machine-random forest (HFB-SVM-RF) model to identify normal pancreas or pancreas cancer and they achieve 96.47% accuracy in the year of 2019[12]. Compared to both systems, our proposed model obtained 98.3% accuracy with the Adaboost ensemble KNN-SVM technique for pancreas tumour classification (Udhav and Deshmukh, 2018).
CONCLUSION
This research paper proposes a novel CAD system for pancreas cancer on PET/CT scan images, comprising pre-processing, pancreatic segmentation, feature Extraction, selection, and classification respectively. Noise and artifact removal is performed using the filters, the segmentation is performed using the novel method of saliency, and features are extracted using GLCM and GLRM, then a feature selection is applied based on WAO and the finally with regards to WAO – Adaboost ensemble KNN-SVM algorithm, for detecting and classifying the pancreatic cancer. We perform the identification task for 119 PET/CT images. The implementation outcomes and evaluations with the related work demonstrates that our proposed system can reach better classification performance than others system.
REFERENCES
Akhtar MS, Gupta D, and Ekbal A (2017) Feature selection and ensemble construction: A two-step method for aspect based sentiment analysis Knowl.-Based Syst., vol. 125, pp. 116-135.
Ali KH, Entesar B, Nadra TJ, and Alsaad (2020) Texture Features Analysis using Gray level Co-occurrence Matrix for a Spine MRI Images International Journal of Computer Science and Information Security, 14(6).
Balakrishna R, and Anandan R (2018) Soft Computing Analysis for Detection of Pancreatic Cancer Using MATLAB International Journal of Pure and Applied Mathematics, Volume 119 No. 18 pp 379-392 ISSN: 1314-3395.
Guo H, Li B, and Zhang YY (2020) Recognition Based on the Feature Extraction of Gabor Filter and Linear Discriminant Analysis and Improved Local Coupled Extreme Learning Machine, Hindawi Mathematical Problems in Engineering.
Huang M, Zhan X, and Liang X (2020) Improvement of Whale Algorithm and Application, January, IEEE, 978-1-7281-3299-0.
Sarangi A, Samal S and Sarangi SK (2019) Comparative Analysis of Cauchy Mutation and Gaussian Mutation in Crazy PSO, 3rd International Conference on Computing and Communications Technologies (ICCCT), IEEE.
Shah J and Surve S (2015) Pancreatic Tumor Detection Using Image Processing International Conference on Advances in Computing, Communication and Control (ICAC3’15) Elseivier 49.
Sheelakeshvan P, Anandan R, and Balakrishna (2017) Segmentation of Pancreatic Tumor Using Region Based Active Contour, Journal of Advanced Research in Dynamical and Control Systems Spl. Issue (04).
Sindhu A and Radha V (2019) A Novel Histogram Equalization Based Adaptive Center Weighted Median Filter for De-noising Positron Emission Tomography (PET) Scan Images IEEE Conference, International Conference on Communication and Electronic Systems (ICCES) ISBN: 978-1-5386-4765-3.
Sindhu A and Radha V (2019). Pancreatic Tumor Segmentation Based on Optimized K-Means Clustering and Saliency Map Model International Journal of Recent Technology and Engineering (IJRTE) ISSN: 2277-3878.
Sindhu A and Radha V (2020) Performance Estimation of ML Techniques for Pancreatic tumor Classification in PET/CT Images Journal of SN Applied Science (Web of Science) – Accepted.
Sindhu A and Radha V (2020). A Method for Removing PET Imaging Artifact Using Combination of Standard Deviation and Computational Geometry Technique Elsevier Science Direct https://doi.org/10.1016/j.procs.2020.03.396.
Sindhu A, and Radha V (2018). An Analysis of techniques in image processing for detecting pancreatic tumuor – A review Journal of Advanced Research in Dynamical and control Systems.
Siqi L, and Hyian J (2019). An Effective computer aided diagnosis model for pancreas cancer on PET/CT images Computer methods and Programs in Biomedicine 165 pp205-214.
Udhav B and J Deshmukh (2018). Mammogram classification using AdaBoost with RBFSVM and Hybrid KNN–RBFSVM as base estimator by adaptively adjusting c and C value’ Springer.

