Nematode Biodiversity and Genomics Research Laboratory, Department of Zoology,
Baba Ghulam Shah Badshah University, Rajouri, Jammu and Kashmir, India
Corresponding author email: aashah@bgsbu.ac.in
Article Publishing History
Received: 25/09/2021
Accepted After Revision: 15/11/2021
Diversity of Nematode communities in Pir Panjal range of Jammu and Kashmir along with nematodes’ driven indices were studied. Himalayan mountainous areas of district Rajouri were selected. Community composition and trophic structure (feeding types) were assessed and were analyzed at various altitudes and across varied habitats, which differ significantly on moving from low elevation to high elevation areas. A total of 47 genera were recorded across mountain clines. In terms of taxonomic groups, in higher elevations, the order Dorylaimids represent 55.18%, followed by Tylenchida 28.85%, Mononchida 2.38%, Rhabditida 2.18%, and Aphelenchida 2.05%, whereas in the lower reaches, the order Rhabditida represent 30.18%, followed by Dorylaimids 28.75%, Tylenchida 15.85%, Mononchida 10.05% and Aphelenchida 1.05%. In terms of trophic groups, in the upper reaches, omnivores (56.6%) predominate, representing highest number, followed by plant parasitic (33.4%), bacterivore (4.2%), predatory (3.2%) and fungivore (2.60%). In the lower reaches, Bacterivores (38.08%) predominates, followed by omnivores (29.85%), plant parasitic (18.5%), predatory (12.5%) and fungivores (1.07%).
The total nematode abundance and diversity were found increasing with elevation This pattern applied to most genera and feeding types. Across the regions, nematode diversity and community composition increases positively with elevations and richer habitats as given by Simpson index and Shannon-Weaver index. We conclude that nematode assemblages are potentially good bioindicators of climate change. They reacted sensitively and predictably to the changing environment. Thus, nematodes have suitability for long-term monitoring of biodiversity and community changes. Sampling techniques are well standardized and inexpensive. Furthermore, feeding types of nematodes can be determined with minimal taxonomic skills.
Biodiversity, Community Composition, Ecosystem Functioning, Soil Nematodes.
Kouser Y, Shah A. A. A Comparative Diversity Analysis of Soil Nematodes of Rajouri, Jammu and Kashmir, India. Biosc.Biotech.Res.Comm. 2021;14(4).
Kouser Y, Shah A. A. A Comparative Diversity Analysis of Soil Nematodes of Rajouri, Jammu and Kashmir, India. Biosc.Biotech.Res.Comm. 2021;14(4). Available from: <a href=”https://bit.ly/3I2SO0r“>https://bit.ly/3I2SO0r</a>
Copyright © Kouser and Shah This is an open access article distributed under the terms of the Creative Commons Attribution License (CC-BY) https://creativecommns.org/licenses/by/4.0/, which permits unrestricted use distribution and reproduction in any medium, provide the original author and source are credited.
INTRODUCTION
It has been established that 25% of the biodiversity of world sustains in the soils of terrestrial ecosystems. Nematodes are one of the most successful organisms and placed in a lower position in the taxonomic hierarchy. They are quite abundant and probably the most diverse organisms on the earth. Based on tropic grouping, nematodes may be bacterivores, predators, fungivores, omnivores and plant parasities, (Yeates et al. 1993; Bach et al. 2020).
Abundance, diversity and effects on soil processes of nematodes make their way to the usefulness of indices of nematodes assemblage as potential bio-indicators of ecosystem functioning. Most nematodes are beneficial in terms of maintaining earth’s nutrients’ cycle and enhancing the diversity of natural ecosystem (Freckman 1982; Freckman 1988; Beare et al. 1992). Nematodes belonging to various species inhabiting in a pristine or a disturbed environment constitutes the nematode community of that particular area and are very much sensitive to changes in different soil parameters like pH, salinity, soil moisture, conductivity, food supply etc. (Yeates 1987).
Nowadays, nematodes are considered as bio-indicators owing to their suitability for long-term monitoring of biodiversity and community changes. Soil inhabiting communities particularly nematodes inhabiting in high elevations are largely unknown, they are good indicators of the changing ecosystem diversity because they themselves are very diverse in soils (Overgaard, 1949; Procter 1984; Yeates and Bongers 1999; Yeates 2003). Biodiversity in the highest elevations especially of nematodes in terms of species richness, abundance and biomass is greater as compared to the low latitudes, as hypothesized in previous studies (Procter 1990).
Any disturbance in the niche of nematodes affects their population dynamics. The change in the factors like soil quality, soil characteristics, habitat stability, climate change and environment pollution is strongly reflected by nematodes and therefore they constitute an important part of the soil biota (Bongers 1990; Crawford, Neilson and Boag 1991; Goede and Bongers 1994; Ruess 1995; Ruess, Michelsen and Jonasson 1999; Sohlenius and Bostrom 1999; Bach et al. 2020).
Soil nematodes contribute and inform on the changes in ecosystem functioning across contrasted landscapes. Nematodes amassed around and in food sources and composed of various taxa of soil food web of various trophic levels (Yeates 2010). High altitude habitats represent a unique bio-region primarily because of its varied topography and habitat heterogeneity along a wide elevational range. In soil ecosystem, various functional trophic guilds can be assigned to nematodes and thus can be seen having wide range of ecological adaptations, from colonizer (r-strategists) to persister (K-strategists) along a cp (colonizer-persister) scale (Bongers 1990).
Studying the species abundance and distribution of the high-altitude summits, their causes and consequences gives an insight into the community assembly and ecosystem functioning (Gaston 2000; Doherty, Callaway and Zedler 2011; Oliver et al. 2015; Wilschut et al. 2019) Of the total number of nematode species that exist on earth, only about 27,000 are known so far (Hugot, Baujard and Morand, 2001). The soil conditions differ with the changing habitat and elevation and are indeed important determinants of the composition of soil nematode communities.
The vegetation of Pir Panjal Range represents appreciably diverse types, mainly because of the diversity of habitat. Forest cover of the Pir Panjal in the lower reaches comprise usually of conifers, like Blue Pine (Pinus wallichiana), Silver Fir (Abies pindrow), Himalayan Deodar (Cedrus deodara), The Himalayan Yew (Taxus wallichiana) and spruce (Picea smithiana) along with some associated shrubs and broad-leaved trees (Wu et al. 2011; Nielsen et al. 2014; Song et al. 2017; Li et al. 2020).
In the mid reaches, the Silver Fir assumes dominance, whereas natural stands of Birch (Betula utilis) occur in the upper forest reaches, forming the timberline in Himalaya. Beyond the tree line, alpine scrub vegetation, comprising mainly the species of Salix, Lonicera, Juniperus, Cotoneaster and Rhododendron, is quite common. The mountains at higher altitudes are dotted with the lush green meadows (‘Dhoks’) with characteristic herbaceous elements, such as species of Gentiana, Ranunculus, Aconitum, Aquilegia, Iris and Potentilla. Nematodes are also associated with these plant varieties as herbivores or plant-parasitic nematodes.
Studies on the diversity of soil nematode communities of Pir Panjal Range of district Rajouri are very meagre. The aim of this study is to unravel nematode fauna for a better understanding of their population structure. Standard techniques were used to isolate nematodes. Moreover, identification and counting on generic level was done in the laboratory. Various Ecological indices were used to assess the diversity of different nematodes like Shannon-Weaner Index (H’), Simpson index (D) and Inverse Simpson index (Dar and Khuroo 2013; Li et al. 2020).
MATERIAL AND METHODS:
The current study was conducted in Rajouri district of Jammu and Kashmir, India which varies in topography, geological formations, climatic conditions and the altitudinal range. Nematodes were sampled between May 2018 to June 2020. Soil samples from various locations were collected in air tight bags labelled with information like sample type, habitat, associated plant, collection date, elevation, collection site, etc. The nematodes were extracted by Cobb’s sieving and decantation and modified Baermann’s funnel techniques. Alongside, the extracted nematodes were killed and fixed using hot fixative in the ratio 4:1, followed by dehydration in glycerin–alcohol (5 parts glycerin + 95 parts 30% alcohol) and then mounted in anhydrous glycerin on glass slides using wax ring technique and then identified under Olympus BX51 DIC microscope using literature of (Seinhorst 1959; Andrássy 1983; Jairajpuri and Ahmad 1992).
Nematodes were counted to genus level under the Olympus Stereo-zoom SZX16 microscope and assigned a functional guild based on their life histories and trophic groups (Yeates et al. 1993). The following parameters were calculated to determine the diversity of soil-inhabiting nematodes (Tomar, Baniyamuddin and Ahmad 2006).
- Frequency (N) is frequency of nematode genus (the number of samples in which the genus was present).
- Absolute Frequency (AF %) is frequency of genus X 100/ total number of samples counted.
- Mean Density (MD) is the number of nematode specimens of the genus counted in all samples / total number of the samples collected.
- Relative density (RD %) is the mean density of the genus X 100/ sum of mean density of all nematode’s genera. (Tomar, Baniyamuddin and Ahmad, 2006).
- The following indices were calculated.
- Shannon-Weaver Index (H’) = -∑Pi, In Pi (Shannon and Weaver, 1949).
- Simpson index (D) = -∑ Pi2
- Inverse Simpson index (Hill’s reciprocal) N2= 1/D.
In these indices, Pi = proportion of individual of taxon i in the total population
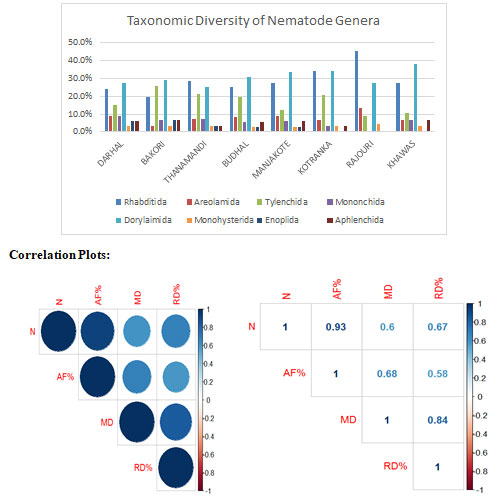
Statistical analyses were performed using R software, R version 4.0.3 (2020-10-10). Copyright (C) 2020 The R Foundation for Statistical Computing. In order to describe nematode communities across various locations, Correlation analysis was performed.
RESULTS AND DISCUSSION
There are 47 nematode genera found in Eight Major Areas of district Rajouri of Pir Panjal.
Nematode community analyses in Manjakote Area: A total of 34 genera were recorded from the Manjakote area, with Dorylaimida (33.3%), representing the highest percentage followed by Rhabditida (27%), Tylenchida (12.12%), Araeolaimida (9.09%), Mononchida and Aphelenchida (6.06%), Monhysterida (3%) and Enoplida (3%), (Figure 1). On assigning the 34 genera to trophic groupings, the bacterivores represented the highest percentage (48%), followed by omnivores (18.18%) and fungivores (15.5%) and then plant parasites (9.09%) and predators (9.09%), (Table I). Mesorhabditis and Acrobeles were the most dominant genera with the highest frequency of occurrence (100%) and (83.3%), respectively; whereas the genera Teratocephalus and Heterocephalobus were the least common, with frequency of occurrence (16.6%).
Frequency: Among predators, the genus Mylonchulus was the most prevalent, with absolute frequency (AF) of 50%, whereas the least frequent genera were Discolaimus and Mononchus, with AF of 16.7% and 33.3%, respectively. Mesorhabditis and Acrobeles were the most frequent genera among the bacterivores with AF of 100% and 83.3%, respectively; whereas the least frequent genus was Teratocephalus with AF of 16.6%. Among Fungivores, Aphelenchus was the most dominant genus with AF of 33.3% and Diptherophora was the least dominant with AF 16%. Among omnivores, Eudorylaimus was the most frequent genus with AF of 66%, and the least frequent genus was Dorylaimus with AF of 33.3%. Among plant parasitic, genus Helicotylenchus was the most frequent with AF of 33%, whereas Pratylenchus was the least frequent genus with AF of 16%.
Mean density: Mylonchulus was the most dominant genus with MD= 7.3 among predators, with relative density (RD) of 2.7%. The least dominant genus was Discolaimus with MD=2 and RD=0.7%. Among the bacterivores, Mesorhabditis was the most dominant genus with MD=35.6% and RD=13.2% and least dominant genus was Heterocephalobus MD= 2% with RD=0.7%. Among Fungivores, dominant genera were Aphelenchus with MD=2.67 and RD=0.9%. and Diptherophora having least MD=0.5 and RD=0.1%. The genus Eudorylaimus MD=16 was the most dominant genus among the omnivores with relative density (RD) of 6%. The least dominant genus was Dorylaimus, MD=3.8 with relative density of 1.4%. Among the plant parasites, Helicotylenchus was the most dominant genus MD=11.8 with RD=4.4%; whereas the least dominant genus was Pratylenchus, with MD=3.3 and RD=1.2% each.
Nematode community analyses in Darhal Area: A total of 33 genera were recorded from the Darhal area, with Dorylaimida (27.2%), representing the highest percentage followed by Rhabditida (24.2%), Tylenchida (15.1%), Araeolaimida (9.09%), Mononchida (9.09%), Aphelenchida (6.06%), Monhysterida (3%) and Enoplida (6%), (Figure 1). On assigning the 33 genera to trophic groupings, the bacterivores represented the highest percentage (42%), followed by predators, fungivores and plant parasites each (15%) and omnivores (12%), (Table II) Teratocephalus and Monhystera were the most dominant genera with the highest frequency of occurrence (100%); whereas the genera Eucephalobus and Wilsonema were the least common, with frequency of occurrence (25%).
Frequency: Among predators, the genus Mylonchulus was the most prevalent, with absolute frequency (AF) of 50%, whereas the least frequent genera were Clarkus and Paravulvus, with AF of 25% each. Teratocephalus and Monhystera were the most frequent genera among the bacterivores with AF of 100%; whereas the least frequent genus was Eucephalobus with AF of 25%. Among Fungivores, Tylencholaimus was the most dominant genus with AF of 75% and Diptherophora, Aphelenchus and Aphelenchoides were the least dominant genera with AF 25%. Among omnivores, Eudorylaimus, Mesodorylaimus, Prodorylaimus and Epidorylaimus were the most frequent genera with AF of 100%. Among plant parasitic, Helicotylenchus, Paratylenchus, Pratylenchus and Rotylenchus were the most frequent genera with AF of 100%, whereas Nagelus was the least frequent with AF of 50%.
Mean density: Mylonchulus was the most dominant genus with MD= 12 among predators, with relative density (RD) of 1.4%. The least dominant genus was Clarkus with MD=1.5 and RD=0.1%. Among the bacterivores, Alaimus was the most dominant genus with MD=33% and RD=4.0% and least dominant genus was Eucephalobus MD= 3% with RD=0.3%. Among Fungivores, dominant genus was Tylencholaimus with MD=12.2 and RD=1.5%. and Diptherophora having least MD=1 and RD=0.1%. The genus Eudorylaimus MD=98.7 was the most dominant genus among the omnivores with relative density (RD) of 12.1%. The least dominant genus was Mesodorylaimus, MD=48.5 with relative density of 5.9%. Among the plant parasites, Paratylenchus was the most dominant genus MD=96.5 with RD=11.8%; whereas the least dominant genus was Nagelus, with MD=6.5 and RD=0.7%.
Nematode community analyses in Kotranka Area: A total of 29 genera was recorded from the Kotranka area, with Dorylaimida (34.3%), representing the highest percentage followed by Rhabditida (34%), Tylenchida (20%), Araeolaimida (6.8%), Mononchida, Aphelenchida and Monhysterida (3%) each, (Figure 1). On assigning the 29 genera to trophic groupings, the bacterivores represented the highest percentage (44%), followed by omnivores and plant parasites (17.2%) each, fungivores (13.7%) and predators (6.8%), (Table III).
Frequency: Among predators, the genus Mylonchulus was the most prevalent, with absolute frequency (AF) of 33%, whereas the least frequent genus was Discolaimus with AF of 16.7%. Wilsonema and Pelodera were the most frequent genera among the bacterivores with AF of 100% and 83.3%, respectively; whereas the least frequent genus was Eucephalobus with AF of 16.6%. Among Fungivores, Aphelenchus and Diptherophora were the most dominant genera with AF of 33.3% each and Tylencholaimus and Leptonchus were the least dominant genera with AF 16% each. Among omnivores, Eudorylaimus, Heterodorus, Allodorylaimus, Prodorylaimus and Dorylaimus were the most frequent genera with AF of 16% each. Among plant parasitic, genus Helicotylenchus, Nagelus, Pratylenchus, Longidorella and Tylenchorhynchus were the most frequent with AF of 16.7% each.
Mean density: Mylonchulus was the most dominant genus with MD= 3 among predators, with relative density (RD) of 1.3%. The least dominant genus was Discolaimus with MD=2.8 and RD=1.3%. Among the bacterivores, Wilsonema was the most dominant genus with MD=28 and RD=12% and least dominant genus was Eucephalobus MD= 1% with RD=0.4%. Among Fungivores, dominant genus was Aphelenchus with MD=5 and RD=2.3%. and Tylencholaimus having least MD=1 and RD=0.4%. The genus Dorylaimus MD=6.6 was the most dominant genus among the omnivores with relative density (RD) of 3.0%. The least dominant genus was Heterodorus, MD=1.3 with relative density of 0.6%. Among the plant parasites, Pratylenchus was the most dominant genus MD=4.3 with RD=2%; whereas the least dominant genera were Helicotylenchus and Tylenchorhynchus with MD=1.3 and RD=0.6% each.
Nematode community analyses in Bakori Area: A total of 31 genera were recorded from the Bakori area, with Dorylaimida (29%), representing the highest percentage followed by Tylenchida (25.8%), Rhabditida (19%), Mononchida, Enoplida and Aphelenchida (6.06%) each, Araeolaimida and Monhysterida (3.2%) each, (Figure 1). On assigning the 31 genera to trophic groupings, the bacterivores represented the highest percentage (32%), followed by plant parasitic (22%), omnivores and fungivores (16%) and then predators (12%), (Table IV).
Frequency: Among predators, the genera Mylonchulus, Tripyla, Clarkus and Paravulvus were the most prevalent, with absolute frequency (AF) of 25%. Teratocephalus and Prismatolaimus were the most frequent genera among the bacterivores with AF of 100% each; whereas the least frequent genera were Acrobeles, Diploscapter and Eucephalobus with AF of 25%. Among Fungivores, Tylencholaimus was the most dominant genus with AF of 100% and Aphelenchus was the least dominant with AF 25%. Among omnivores, Dorylaimus was the most frequent genus with AF of 100%, and the least frequent genus was Eudorylaimus with AF of 50%. Among plant parasitic, genus Helicotylenchus was the most frequent with AF of 100%, whereas Nagelus and Longidorellawere the least frequent genera with AF of 25%.
Mean density: Tripyla was the most dominant genus with MD= 4 among predators, with relative density (RD) of 0.7%. The least dominant genus was Clarkus with MD=2 and RD=0.3%. Among the bacterivores, Teratocephalus was the most dominant genus with MD=24.25 and RD=4.8% and least dominant genus was Diploscapter MD= 2% with RD=0.3%. Among Fungivores, dominant genus was Tylencholaimus with MD=13.7 and RD=2.7% and Aphelenchus having least MD=3.5 and RD=0.6%. The genus Dorylaimus MD=69.7 was the most dominant genus among the omnivores with relative density (RD) of 13.9%. The least dominant genus was Eudorylaimus, MD=8.2 with relative density of 1.6%. Among the plant parasitic nematodes, Helicotylenchus was the most dominant genus MD=28 with RD=5.5%; whereas the least dominant genus was Nagelus, with MD=2.7 and RD=0.5% each.
Nematode community analyses in Rajouri Area: A total of 22 genera were recorded from the Rajouri area, with Rhabditida (45.4%), representing the highest percentage followed by Dorylaimida (27.2%), Araeolaimida (13.6%), Tylenchida (9%), and Monhysterida (4.5%), (Figure 1). On assigning the 22 genera to trophic groupings, the bacterivores represented the highest percentage (68%), followed by omnivores (13.6%) and fungivores (9%) and then plant parasites and predators (4.5%) each, (Table V).
Frequency: Among predators, the genus Discolaimus was the most prevalent, with absolute frequency (AF) of 17%. Mesorhabditis and Pelodera were the most frequent genera among the bacterivores with AF of 83% and 67%, respectively; whereas the least frequent genus was Teratocephalus with AF of 17%. Among Fungivores, Diptherophora was the most dominant genus with AF of 50% and Leptonchus was the least dominant with AF 17%. Among omnivores, Eudorylaimus was the most frequent genus with AF of 50%, and the least frequent genus was Mesodorylaimus with AF of 16.9%. Among plant parasiticnematodes, genus Tylenchorhynchus was the most frequent with AF of 17%.
Mean density: Discolaimus was the most dominant genus with MD= 2 among predators, with relative density (RD) of 0.7%. Among the bacterivores, Pelodera was the most dominant genus with MD=50% and RD=25% and least dominant genus was Teratocephalus MD= 1% with RD=0.5%. Among Fungivores, dominant genus was Diptherophora with MD=8 and RD=3.7%. and Leptonchus having least MD=2 and RD=0.7%. The genus Eudorylaimus MD=20 was the most dominant genus among the omnivores with relative density (RD) of 10.1%. The least dominant genus was Mesodorylaimus, MD=3 with relative density of 1.5%. Among the plant parasitic nematodes, Tylenchorhynchus was the most dominant genus with MD=2 with RD=0.8%.
Nematode community analyses in Thanamandi Area: A total of 28 genera were recorded from the Thanamandi area, with Rhabditida (28%), representing the highest percentage followed by Dorylaimida (25%), Tylenchida (21%), Araeolaimida and Mononchida (7.1%) each, Aphelenchida, Monhysterida and Enoplida (3.5%) each, (Figure 1). On assigning the recorded28 genera to trophic groupings, the bacterivores represented the highest percentage (46.4%), followed by plant parasites (21.4%), and then omnivores, fungivores and predators (10.7%) each, (Table VI).
Frequency: Among predators, the genera Mylonchulus, Mononchus and Paravulvus were the most prevalent, with absolute frequency (AF) of 25% each. Teratocephalus and Ceratoplectus were the most frequent genera among the bacterivores with AF of 100% and 75%, respectively; whereas the least frequent genera were Pelodera and Monhystera with AF of 25% each. Among Fungivores, Aphelenchus, Tylencholaimus and Tylencholaimellus were the most dominant genera with AF of 75% each. Among omnivores, Eudorylaimus was the most frequent genus with AF of 100%, and the least frequent genus was Mesodorylaimus with AF of 50%. Among plant parasitic nematodes, genus Nagelus was the most frequent genus with AF of 100%, whereas Pratylenchus was the least frequent genus with AF of 50%.
Mean density: Mylonchulus was the most dominant genus with MD= 7.5 among predators, with relative density (RD) of 1.6%. The least dominant genus was Paravulvus with MD=1.5 and RD=0.3%. Among the bacterivores, Plectus was the most dominant genus with MD=28.5% and RD=6.1% and least dominant genus was Pelodera MD= 0.8% with RD=0.1%. Among Fungivores, dominant genera were Tylencholaimellus with MD=11 and RD=2.3%. and Tylencholaimus having least MD=4 and RD=0.8%. The genus Eudorylaimus MD=121 was the most dominant genus among the omnivores with relative density (RD) of 25.9%. The least dominant genus was Mesodorylaimus, MD=8.5 with relative density of 1.8%. Among the plant parasites, Helicotylenchus was the most dominant genus MD=11.5 with RD=2.4%; whereas the least dominant genus was Dorylaimellus, with MD=2.8 and RD=0.5%.
Nematode community analyses in Khawas Area: A total of 29 genera were recorded from the Khawas area, with Dorylaimida (37.9%), representing the highest percentage followed by Rhabditida (27.5%), Tylenchida (10%), Araeolaimida, Mononchida and Aphelenchida (6.8%) each and Monhysterida (3.4%), (Figure 1). On assigning the 29 genera to trophic groupings, the bacterivores represented the highest percentage (41.3%), followed by omnivores (24.1%) and fungivores (17.2%), predators (10%) and then plant parasites (6.8%), (Table VII).
Frequency: Among predators, the genera Mylonchulus, Enchodelus and Clarkus were the most prevalent, with absolute frequency (AF) of 16.7% each. Wilsonema and Pelodera were the most frequent genera among the bacterivores with AF of 100% and 66.7%, respectively; whereas the least frequent genus was Teratocephalus with AF of 16.6%. Among Fungivores, Aphelenchus and Diptherophora were the most dominant genera with AF of 50% each and Leptonchus and Tylencholaimus were the least dominant genera with AF 16% each. Among omnivores, Pungentus was the most frequent genus with AF of 50%, and the least frequent genus was Heterodorus with AF of 16%. Among plant parasitic nematodes, genus Rotylenchus was the most frequent with AF of 50%, whereas Helicotylenchus was the least frequent with AF of 16%.
Mean density: Clarkus was the most dominant genus with MD= 2.5 among predators, with relative density (RD) of 1.1%. The least dominant genus was Enchodelus with MD=1.6 and RD=0.7. Among the bacterivores, Wilsonema was the most dominant genus with MD=30% and RD=14.6% and least dominant genus was Teratocephalus MD= 0.6% with RD=0.3%. Among Fungivores, dominant genera were Diptherophora with MD=5.5 and RD=2.6%. and Leptonchus having least MD=2 and RD=0.9%. The genus Pungentus with MD=15.6 was the most dominant genus among the omnivores with relative density (RD) of 7.5%. The least dominant genus was Heterodorus, MD=2.5 with relative density of 1.1%. Among the plant parasitic nematodes, Rotylenchus was the most dominant genus MD=9.1 with RD=4.3%; whereas the least dominant genus was Helicotylenchus, with MD=3.5 and RD=1.6%.
Nematode community analyses in Budhal Area: A total of 36 genera were recorded from the Budhal area, with Dorylaimida (30.5%), representing the highest percentage followed by Rhabditida (25%), Tylenchida (19.4%), Araeolaimida (8.3%), Mononchida and Aphelenchida (5.5%), Monhysterida (2.7%) and Enoplida (2.7%), (Figure 1). On assigning the 36 genera to trophic groupings, the bacterivores represented the highest percentage (41.6%), followed by omnivores (19.4%), then plant parasites (16.6%) and fungivores (11%) and predators (11.1%), (Table VIII).
Frequency: Among predators, the genus Enchodelus was the most prevalent, with absolute frequency (AF) of 75%, whereas the least frequent genus was Mononchus, with AF of 25%. Mesorhabditis and Teratocephalus were the most frequent genera among the bacterivores with AF of 75% each; whereas the least frequent genus was Heterocephalus with AF of 25%. Among Fungivores, Tylencholaimellus was the most dominant genus with AF of 100% and Aphelenchus was the least dominant genus with AF 25%. Among omnivores, Eudorylaimus, Epidorylaimus, Allodorylaimus and Heterodorus were the most frequent genera with AF of 100%, and the least frequent genus was Prodorylaimus with AF of 50%. Among plant parasitic, genera Tylenchorhynchus and Paratylenchus were the most frequent with AF of 100%, whereas Rotylenchus was the least frequent with AF of 25%.
Mean density: Enchodelus was the most dominant genus with MD= 18.5 among predators, with relative density (RD) of 2.8%. The least dominant genus was Paravulvus with MD=6.2 and RD=0.9%. Among the bacterivores, Acrobeles was the most dominant genus with MD=28.7% and RD=4.4% and least dominant genus was Heterocephalobus MD= 1% with RD=0.1%. Among Fungivores, dominant genus was Leptonchus with MD=12.2 and RD=1.8%. and genus Aphelenchus having least MD=3.5 and RD=0.5%. The genus Allodorylaimus MD=101.2 was the most dominant genus among the omnivores with relative density (RD) of 15.6%. The least dominant genus was Prodorylaimus, MD=7 with relative density of 1.0%. Among the plant parasitic nematodes, Helicotylenchus was the most dominant genus MD=34.7 with RD=5.3%; whereas the least dominant genus was Rotylenchus, with MD=1.2 and RD=0.1%.
Table I. Population structure of soil dwelling nematodes of Manjakote Area of district Rajouri
| Feeding Habits | MANJAKOTE AREA | ||||
|
BACTERIVORES
|
Genera | N | AF% | MD | RD% |
| Anaplectus | 3 | 50.00 | 5.00 | 1.860 | |
| Mesorhabditis | 6 | 100.00 | 35.67 | 13.267 | |
| Pelodera | 4 | 66.67 | 25.67 | 9.548 | |
| Acrobeles | 5 | 83.33 | 22.33 | 8.308 | |
| Cuticularia | 2 | 33.33 | 5.33 | 1.984 | |
| Wilsonema | 3 | 50.00 | 11.67 | 4.340 | |
| Alaimus | 1 | 16.67 | 2.00 | 0.744 | |
| Diploscapter | 3 | 50.00 | 16.83 | 6.262 | |
| Teratocephalus | 1 | 16.67 | 1.83 | 0.682 | |
| Rhabditis | 4 | 66.67 | 12.67 | 4.712 | |
| Plectus | 2 | 33.33 | 22.67 | 8.432 | |
| Heterocephalobus | 1 | 16.67 | 2.00 | 0.744 | |
| Monhystera | 2 | 33.33 | 7.83 | 2.914 | |
| Ceratoplectus | 1 | 16.67 | 5.83 | 2.170 | |
| Prismatolaimus | 1 | 16.67 | 2.33 | 0.868 | |
| Eucephalobus | 1 | 16.67 | 3.67 | 1.364 | |
| FUNGIVORES | Tylencholaimus | 1 | 16.67 | 1.17 | 0.434 |
| Aphelenchoides | 1 | 16.67 | 0.83 | 0.310 | |
| Leptonchus | 1 | 16.67 | 1.00 | 0.372 | |
| Aphelenchus | 2 | 33.33 | 2.67 | 0.992 | |
| Diphtherophora | 1 | 16.67 | 0.50 | 0.186 | |
| HERBIVORES | Paratylenchus | 2 | 33.33 | 7.83 | 2.914 |
| Helicotylenchus | 2 | 33.33 | 11.83 | 4.402 | |
| Pratylenchus | 1 | 16.67 | 3.33 | 1.240 | |
|
PREDATORS
|
Mylonchulus | 3 | 50.00 | 7.33 | 2.728 |
| Discolaimus | 1 | 16.67 | 2.00 | 0.744 | |
| Mononchus | 2 | 33.33 | 2.50 | 0.930 | |
| OMNIVORES | Eudorylaimus | 4 | 66.67 | 16.17 | 6.014 |
| Epidorylaimus | 2 | 33.33 | 5.83 | 2.170 | |
| Prodorylaimus | 2 | 33.33 | 6.67 | 2.480 | |
| Mesodorylaimus | 3 | 50.00 | 7.50 | 2.790 | |
| Dorylaimus | 2 | 33.33 | 3.83 | 1.426 | |
| Pungentus | 2 | 33.33 | 4.50 | 1.674 | |
Table II. Population structure of soil dwelling nematodes of Darhal Area of district Rajouri:
| Feeding types | DARHAL AREA | ||||
|
BACTERIVORES
|
Genera | N | AF% | MD | RD |
| Mesorhabditis | 2 | 50 | 4.75 | 0.583 | |
| Pelodera | 1 | 25 | 3.5 | 0.429 | |
| Curviditis | 1 | 25 | 5 | 0.613 | |
| Wilsonema | 1 | 25 | 11 | 1.349 | |
| Alaimus | 3 | 75 | 33.25 | 4.079 | |
| Diploscapter | 1 | 25 | 5 | 0.613 | |
| Teratocephalus | 4 | 100 | 30.25 | 3.711 | |
| Rhabditis | 1 | 25 | 5.5 | 0.675 | |
| Plectus | 2 | 50 | 35 | 4.293 | |
| Monhystera | 4 | 100 | 26.5 | 3.251 | |
| Ceratoplectus | 3 | 75 | 25.25 | 3.097 | |
| Prismatolaimus | 2 | 50 | 10 | 1.227 | |
| Panagrolaimus | 3 | 75 | 21.25 | 2.607 | |
| Eucephalobus | 1 | 25 | 3 | 0.368 | |
|
FUNGIVORES |
Tylencholaimus | 3 | 75 | 12.25 | 1.503 |
| Aphelenchoides | 1 | 25 | 3.5 | 0.429 | |
| Aphelenchus | 1 | 25 | 3.25 | 0.399 | |
| Diphtherophora | 1 | 25 | 1 | 0.123 | |
| Tylencholaimellus | 2 | 50 | 6.25 | 0.767 | |
|
HERBIVORES |
Paratylenchus | 4 | 100 | 96.5 | 11.837 |
| Helicotylenchus | 4 | 100 | 67.5 | 8.280 | |
| Nagelus | 2 | 50 | 6.5 | 0.797 | |
| Pratylenchus | 4 | 100 | 41.25 | 5.060 | |
| Rotylenchus | 4 | 100 | 47 | 5.765 | |
|
PREDATORS |
Mylonchulus | 2 | 50 | 12 | 1.472 |
| Mononchus | 2 | 50 | 8.5 | 1.043 | |
| Tripyla | 2 | 50 | 7.25 | 0.889 | |
| Clarkus | 1 | 25 | 1.5 | 0.184 | |
| Paravulvus | 1 | 25 | 3.25 | 0.399 | |
|
OMNIVORES |
Eudorylaimus | 4 | 100 | 98.75 | 12.113 |
| Epidorylaimus | 4 | 100 | 57.75 | 7.084 | |
| Prodorylaimus | 4 | 100 | 73.5 | 9.016 | |
| Mesodorylaimus | 4 | 100 | 48.5 | 5.949 | |
Table III. Population structure of soil dwelling nematodes of Kotranka Area:
| Feeding types | KOTRANKA AREA | ||||
|
BACTERIVORES |
Genera | N | AF% | MD | RD% |
| Anaplectus | 3 | 50.00 | 10.83 | 5.000 | |
| Mesorhabditis | 4 | 66.67 | 18.67 | 8.615 | |
| Pelodera | 5 | 83.33 | 18.83 | 8.692 | |
| Acrobeles | 5 | 83.33 | 25.17 | 11.615 | |
| Cuticularia | 1 | 16.67 | 4.17 | 1.923 | |
| Wilsonema | 6 | 100.00 | 28.00 | 12.923 | |
| Alaimus | 1 | 16.67 | 9.17 | 4.231 | |
| Diploscapter | 5 | 83.33 | 27.00 | 12.461 | |
| Rhabditis | 3 | 50.00 | 16.00 | 7.385 | |
| Plectus | 2 | 33.33 | 7.17 | 3.308 | |
| Heterocephalobus | 1 | 16.67 | 1.83 | 0.846 | |
| Monhystera | 2 | 33.33 | 6.33 | 2.923 | |
| Eucephalobus | 1 | 16.67 | 1.00 | 0.462 | |
|
FUNGIVORES |
Tylencholaimus | 1 | 16.67 | 1.00 | 0.462 |
| Leptonchus | 1 | 16.67 | 2.50 | 1.154 | |
| Aphelenchus | 2 | 33.33 | 5.00 | 2.308 | |
| Diphtherophora | 2 | 33.33 | 2.00 | 0.923 | |
|
HERBIVORES |
Helicotylenchus | 1 | 16.67 | 1.33 | 0.615 |
| Nagelus | 1 | 16.67 | 1.67 | 0.769 | |
| Pratylenchus | 1 | 16.67 | 4.33 | 2.000 | |
| Longidorella | 1 | 16.67 | 4.17 | 1.923 | |
| Tylenchorhynchus | 1 | 16.67 | 1.33 | 0.615 | |
|
PREDATORS |
Discolaimus | 1 | 16.67 | 2.83 | 1.308 |
| Mylonchulus | 2 | 33.33 | 3.00 | 1.385 | |
|
OMNIVORES
|
Eudorylaimus | 1 | 16.67 | 1.67 | 0.769 |
| Heterodorus | 1 | 16.67 | 1.33 | 0.615 | |
| Allodorylaimus | 1 | 16.67 | 2.00 | 0.923 | |
| Prodorylaimus | 1 | 16.67 | 1.67 | 0.769 | |
| Dorylaimus | 1 | 16.67 | 6.67 | 3.077 | |
Table IV. Population structure of soil dwelling nematodes of Bakori Area:
| Feeding types | BAKORI
AREA |
||||
| Genera | N | AF% | MD | RD% | |
|
BACTERIVORES |
Mesorhabditis | 2 | 50 | 4.5 | 0.897 |
| Acrobeles | 1 | 25 | 5.25 | 1.047 | |
| Alaimus | 3 | 75 | 15.75 | 3.141 | |
| Diploscapter | 1 | 25 | 2 | 0.399 | |
| Teratocephalus | 4 | 100 | 24.25 | 4.835 | |
| Plectus | 2 | 50 | 14.25 | 2.841 | |
| Monhystera | 3 | 75 | 10.5 | 2.094 | |
| Prismatolaimus | 4 | 100 | 14 | 2.792 | |
| Panagrolaimus | 3 | 75 | 11 | 2.193 | |
| Eucephalobus | 1 | 25 | 6.25 | 1.246 | |
|
FUNGIVORES |
Tylencholaimus | 4 | 100 | 13.75 | 2.742 |
| Aphelenchoides | 3 | 75 | 7 | 1.396 | |
| Deladenus | 2 | 50 | 10.75 | 2.144 | |
| Aphelenchus | 1 | 25 | 3.5 | 0.698 | |
| Tylencholaimellus | 3 | 75 | 6 | 1.196 | |
|
HERBIVORES |
Paratylenchus | 4 | 100 | 24 | 4.786 |
| Helicotylenchus | 4 | 100 | 28 | 5.583 | |
| Nagelus | 1 | 25 | 2.75 | 0.548 | |
| Pratylenchus | 4 | 100 | 43 | 8.574 | |
| Longidorella | 1 | 25 | 7.5 | 1.496 | |
| Tylenchorhynchus | 2 | 50 | 9 | 1.795 | |
| Dorylaimellus | 3 | 75 | 7.75 | 1.545 | |
|
PREDATORS |
Mylonchulus | 1 | 25 | 1.75 | 0.349 |
| Tripyla | 1 | 25 | 4 | 0.798 | |
| Clarkus | 1 | 25 | 2 | 0.399 | |
| Paravulvus | 1 | 25 | 2.5 | 0.499 | |
|
OMNIVORES |
Eudorylaimus | 2 | 50 | 8.25 | 1.645 |
| Heterodorus | 4 | 100 | 52.75 | 10.518 | |
| Allodorylaimus | 4 | 100 | 64.5 | 12.861 | |
| Prodorylaimus | 3 | 75 | 25.25 | 5.035 | |
| Dorylaimus | 4 | 100 | 69.75 | 13.908 | |
Table V. Population structure of soil dwelling nematodes of Rajouri Area:
| Feeding types | RAJOURI AREA | ||||
|
BACTERIVORES |
Genera | N | AF% | MD | RD% |
| Anaplectus | 3 | 50 | 7 | 3.328 | |
| Mesorhabditis | 5 | 83 | 16 | 7.904 | |
| Pelodera | 4 | 67 | 50 | 25.042 | |
| Acrobeles | 3 | 50 | 13 | 6.489 | |
| Cuticularia | 2 | 33 | 5 | 2.329 | |
| Curviditis | 1 | 17 | 4 | 2.163 | |
| Wilsonema | 3 | 50 | 6 | 3.161 | |
| Alaimus | 1 | 17 | 3 | 1.248 | |
| Diploscapter | 3 | 50 | 12 | 6.157 | |
| Teratocephalus | 1 | 17 | 1 | 0.582 | |
| Rhabditis | 3 | 50 | 8 | 4.077 | |
| Plectus | 3 | 50 | 17 | 8.569 | |
| Heterocephalobus | 4 | 67 | 6 | 2.995 | |
| Monhystera | 2 | 33 | 6 | 3.161 | |
| Ceratoplectus | 1 | 17 | 6 | 2.829 | |
|
FUNGIVORES |
Leptonchus | 1 | 17 | 2 | 0.749 |
| Diphtherophora | 3 | 50 | 8 | 3.744 | |
|
HERBIVORES |
Tylenchorhynchus | 1 | 17 | 2 | 0.832 |
|
PREDATORS |
Discolaimus | 1 | 17 | 2 | 0.749 |
|
OMNIVORES |
Eudorylaimus | 3 | 50 | 20 | 10.150 |
| Prodorylaimus | 1 | 17 | 4 | 2.163 | |
| Mesodorylaimus | 1 | 17 | 3 | 1.581 | |
Table VI. Population structure of soil dwelling nematodes of Thanamandi Area:
| Feeding types | THANAMANDI
AREA |
||||
|
BACTERIVORES
|
Genera | N | AF% | MD | RD% |
| Mesorhabditis | 2 | 50.0 | 3.8 | 0.803 | |
| Pelodera | 1 | 25.0 | 0.8 | 0.161 | |
| Acrobeles | 1 | 25.0 | 20.0 | 4.283 | |
| Alaimus | 3 | 75.0 | 15.3 | 3.266 | |
| Diploscapter | 2 | 50.0 | 12.5 | 2.677 | |
| Teratocephalus | 4 | 100.0 | 16.3 | 3.480 | |
| Rhabditis | 2 | 50.0 | 8.0 | 1.713 | |
| Plectus | 2 | 50.0 | 28.5 | 6.103 | |
| Monhystera | 1 | 25.0 | 4.0 | 0.857 | |
| Ceratoplectus | 3 | 75.0 | 11.8 | 2.516 | |
| Prismatolaimus | 2 | 50.0 | 7.5 | 1.606 | |
| Panagrolaimus | 2 | 50.0 | 9.5 | 2.034 | |
| Eucephalobus | 2 | 50.0 | 5.5 | 1.178 | |
|
FUNGIVORES |
Tylencholaimus | 3 | 75.0 | 4.0 | 0.857 |
| Aphelenchus | 3 | 75.0 | 8.5 | 1.820 | |
| Tylencholaimellus | 3 | 75.0 | 11.0 | 2.355 | |
|
HERBIVORES |
Paratylenchus | 3 | 75.0 | 11.0 | 2.355 |
| Helicotylenchus | 3 | 75.0 | 11.5 | 2.463 | |
| Nagelus | 4 | 100.0 | 6.8 | 1.445 | |
| Pratylenchus | 2 | 50.0 | 5.0 | 1.071 | |
| Tylenchorhynchus | 3 | 75.0 | 7.5 | 1.606 | |
| Dorylaimellus | 2 | 50.0 | 2.8 | 0.589 | |
|
PREDATORS |
Mylonchulus | 1 | 25.0 | 7.5 | 1.606 |
| Mononchus | 1 | 25.0 | 4.5 | 0.964 | |
| Paravulvus | 1 | 25.0 | 1.5 | 0.321 | |
|
OMNIVORES |
Eudorylaimus | 4 | 100.0 | 121.3 | 25.964 |
| Prodorylaimus | 4 | 100.0 | 112.5 | 24.090 | |
| Mesodorylaimus | 2 | 50.0 | 8.5 | 1.820 | |
Table VII. Population structure of soil dwelling nematodes of Khawas Area:
| Feeding types | KHAWAS AREA | ||||
|
BACTERIVORES |
Genera | N | AF% | MD | RD% |
| Anaplectus | 2 | 33.33 | 3.33 | 1.596 | |
| Mesorhabditis | 3 | 50.00 | 7.33 | 3.512 | |
| Pelodera | 4 | 66.67 | 10.50 | 5.028 | |
| Acrobeles | 3 | 50.00 | 14.83 | 7.103 | |
| Wilsonema | 6 | 100.00 | 30.50 | 14.605 | |
| Alaimus | 1 | 16.67 | 5.83 | 2.793 | |
| Diploscapter | 4 | 66.67 | 14.33 | 6.864 | |
| Teratocephalus | 1 | 16.67 | 0.67 | 0.319 | |
| Rhabditis | 3 | 50.00 | 11.50 | 5.507 | |
| Plectus | 2 | 33.33 | 10.17 | 4.868 | |
| Heterocephalobus | 2 | 33.33 | 5.83 | 2.793 | |
| Monhystera | 1 | 16.67 | 1.33 | 0.638 | |
|
FUNGIVORES |
Tylencholaimus | 1 | 16.67 | 1.83 | 0.878 |
| Aphelenchoides | 2 | 33.33 | 3.17 | 1.516 | |
| Leptonchus | 1 | 16.67 | 2.00 | 0.958 | |
| Aphelenchus | 3 | 50.00 | 3.83 | 1.836 | |
| Diphtherophora | 3 | 50.00 | 5.50 | 2.634 | |
|
HERBIVORES |
Helicotylenchus | 1 | 16.67 | 3.50 | 1.676 |
| Rotylenchus | 3 | 50.00 | 9.17 | 4.390 | |
|
PREDATORS
|
Mylonchulus | 1 | 16.67 | 2.00 | 0.958 |
| Enchodelus | 1 | 16.67 | 1.67 | 0.798 | |
| Clarkus | 1 | 16.67 | 2.50 | 1.197 | |
|
OMNIVORES |
Eudorylaimus | 1 | 16.67 | 3.83 | 1.836 |
| Epidorylaimus | 1 | 16.67 | 14.33 | 6.864 | |
| Heterodorus | 1 | 16.67 | 2.50 | 1.197 | |
| Allodorylaimus | 2 | 33.33 | 8.33 | 3.990 | |
| Mesodorylaimus | 2 | 33.33 | 3.67 | 1.756 | |
| Dorylaimus | 2 | 33.33 | 9.17 | 4.390 | |
| Pungentus | 3 | 50.00 | 15.67 | 7.502 | |
Table VIII. Population structure of soil dwelling nematodes of Budhal Area:
| Feeding types | BUDHAL
AREA |
||||
|
BACTERIVORES |
Genera | N | AF% | MD | RD% |
| Mesorhabditis | 3 | 75.0 | 3.25 | 0.502 | |
| Pelodera | 1 | 25.0 | 2.25 | 0.348 | |
| Acrobeles | 2 | 50.0 | 28.75 | 4.444 | |
| Wilsonema | 2 | 50.0 | 2 | 0.309 | |
| Alaimus | 2 | 50.0 | 25.5 | 3.941 | |
| Diploscapter | 2 | 50.0 | 8 | 1.236 | |
| Teratocephalus | 3 | 75.0 | 6.5 | 1.005 | |
| Rhabditis | 2 | 50.0 | 3.75 | 0.580 | |
| Plectus | 1 | 25.0 | 11.5 | 1.777 | |
| Heterocephalobus | 1 | 25.0 | 1 | 0.155 | |
| Monhystera | 2 | 50.0 | 6 | 0.927 | |
| Ceratoplectus | 2 | 50.0 | 9.5 | 1.468 | |
| Prismatolaimus | 2 | 50.0 | 11.25 | 1.739 | |
| Panagrolaimus | 3 | 75.0 | 15 | 2.318 | |
| Eucephalobus | 3 | 75.0 | 12.25 | 1.893 | |
|
FUNGIVORES |
Aphelenchoides | 1 | 25.0 | 4.25 | 0.657 |
| Leptonchus | 2 | 50.0 | 12.25 | 1.893 | |
| Aphelenchus | 1 | 25.0 | 3.5 | 0.541 | |
| Tylencholaimellus | 4 | 100.0 | 7 | 1.082 | |
|
HERBIVORES |
Paratylenchus | 4 | 100.0 | 18.5 | 2.859 |
| Helicotylenchus | 3 | 75.0 | 34.75 | 5.371 | |
| Pratylenchus | 3 | 75.0 | 7.25 | 1.121 | |
| Rotylenchus | 1 | 25.0 | 1.25 | 0.193 | |
| Longidorella | 2 | 50.0 | 12 | 1.855 | |
| Tylenchorhynchus | 4 | 100.0 | 18.5 | 2.859 | |
|
PREDATORS |
Mylonchulus | 1 | 25.0 | 11 | 1.700 |
| Mononchus | 1 | 25.0 | 7 | 1.082 | |
| Enchodelus | 3 | 75.0 | 18.5 | 2.859 | |
| Paravulvus | 1 | 25.0 | 6.25 | 0.966 | |
|
OMNIVORES |
Eudorylaimus | 4 | 100.0 | 34.25 | 5.294 |
| Epidorylaimus | 4 | 100.0 | 84.25 | 13.022 | |
| Heterodorus | 4 | 100.0 | 43.75 | 6.762 | |
| Allodorylaimus | 4 | 100.0 | 101.25 | 15.649 | |
| Prodorylaimus | 2 | 50.0 | 7 | 1.082 | |
| Mesodorylaimus | 3 | 75.0 | 26.75 | 4.134 | |
| Pungentus | 4 | 100.0 | 41.25 | 6.376 | |
N= Frequency; c) AF= absolute frequency; d) MD = mean density; e) RD= relative density
Table X: Summary of nematode diversity indices of Major areas of district Rajouri:
| Ecological indices | Manjakote | Kotranka | Rajouri | Khawas |
| Simpson index (D) | 0.64 | 0.61 | 0.49 | 0.71 |
| Shannon-Weaver Index (H’) | 2.8 | 2.8 | 2.5 | 3.04 |
| Inverse Simpson index (Hill’s Reciprocal) | 1.5 | 1.63 | 2.04 | 1.40 |
| Ecological indices | Darhal | Bakori | Thanamandi | Budhal |
| Simpson index (D) | 0.78 | 0.75 | 0.51 | 0.84 |
| Shannon-Weaver Index (H’) | 3.07 | 2.9 | 2.6 | 4.07 |
| Inverse Simpson index (Hill’s Reciprocal) | 1.27 | 1.3 | 1.96 | 1.19 |
Figure 1: Taxonomic diversity of soil-inhabiting nematodes of various areas of district Rajouri.
Nematodes form a large and diverse group in the animal kingdom and are important ecologically as well economically. Their varied life cycles and the ways of life presence in almost all habitats are features unmatched by other groups of animals. Nematodes play an extremely important role in the soil ecology and biology. They occupy all levels of the food chain from bacterivores secondary degradation to predators (primary consumers). Because of the varied mode of feeding and their sensitivity to ecological and toxicological factors nematodes have become extremely important as ecological and biological indicators.
Numerous soil nematode species have significant economic implications as well. As parasites of plants (both ecto- and endoparasites) they cause substantial damage. As parasites of insects, they are capable of destroying many insect pests and parasites and thereby play an important role in biocontrol program. As bacterial and fungal feeders they indicate the primary decomposition pathways of the soil, whether fungal dependent or bacterial dependent. An analysis of the community structures of these and other groups of nematodes would provide good indices on the state and fertility of soil as well (Hoogen et al. 2019; Hoogen et al. 2020).
The belowground group of nematodes are key components of the soil ecosystem. The nematode communities become more abundant and richer going from lower areas to higher reaches. The total number of nematodes were presented as number of individuals per 100g of dry soil sample and the diversity is calculated as Simpson index(D). Moreover, both nematode abundance and nematode diversity increases at higher altitudes. Increase in the Simpson index, Shannon Weiner index indicates increase in the diversity of soil dwelling nematodes at respective sites. Inverse Simpson index shows the same (Table X). Nematodes dwell in every ecosystem, they have the ability to colonize the harsh environments such as extreme temperatures in the alpine zones. (Yeates, 2010). The increase in the diversity of high elevation zones was also given by (Hoschitz and Kaufmann, 2004) in which high densities of nematodes and high diversity within the communities of nematodes were recorded (Hoogen et al. 2019; Hoogen et al. 2020).
However, study of taxonomic diversity can inform on biodiversity changes along various ecological gradients, the functional characterization of nematodes being major players in the community are necessary to link biodiversity to ecosystem functioning (Wall and Lynch 2000; Tilman 2001). Studies on taxonomic diversity along with functional diversity specially in the previous decade, are mostly focused on analyzing the basic mechanisms of ecosystem functioning (Thebault and Loreau 2006; Reiss et al. 2009; Montoya, Yallop and Memmott 2015). Moreover, these newly described trophic functional guilds gives a more vivid picture of nematode assemblage and thus better understanding of ecosystem functioning (Hoogen et al. 2019; Hoogen et al. 2020).
The dominant nematode communities are mostly formed by taxa like: Eudorylaimus, Pratylenchus, Paratylenchus and Teratocephalus. Among them Eudorylaimus and Teratocephalus have a worldwide distribution and known to colonize arctic or other extreme temperature habitats (Loof 1971; Ruess, Michelsen and Jonasson 1999; Hoschitz and Kaufmann 2004). Pratylenchus is also known to have wide host range that can be the reason of its high abundance in the upper regions (Jones and Fosu-Nyarko 2014). However, in lower reaches, nematode dominant communities are mostly bacterivores like Acrobeles, Pelodera, Plectus and Cephalobus, probably because of the required temperature for carrying out bacterial processes like decomposition which is otherwise little bit difficult on the upper zones.
Thus, we can say, areas with high elevations, mostly have taxa which are more sensitive to environmental disturbances are found with high cp values showing a persistent mode of life history, adopting k-strategists, having longer life cycles and sensitive to soil perturbation marking their way as good bioindicators. They have all the attributes to be recognized as efficient bioindicators (McGeoch 1998; Ritz and Trudgill 1999; Hilty and Merenlender 2000; Hoogen et al. 2020).
CONCLUSION
The present work was planned to study the nematodes to ascertain their relationship with the environment. Very few disturbances, indicates the progression of sensitive genera of nematodes towards the hilly areas, whereas in the lower areas, the genera found in abundance are less sensitive to disturbances. Thus, crucial for bio-monitoring of the environment. The diversity indices representing the diversity pattern of nematodes of various areas selected. Since nematodes play a well-defined role as bio-indicators, a thorough study of the dominance and distribution of nematodes will be highly significant in the bio-monitoring of the ecological changes in the areas.
ACKNOWLEDGEMENTS
This work was financially supported by the Council of Scientific and Industrial Research (CSIR, India, File number 380 09/1172(0002)/EMR-2018), which granted a research fellowship to YK.
Conflict of Interests: Authors declare no conflict of interest to disclose.
References:
Andrássy, I. (1983). A taxonomic review of the suborder Rhabditina (Nematoda: Secernentia). A taxonomic review of the suborder Rhabditina (Nematoda: Secernentia).
Bach, E. et al. (2020). Soil Biodiversity Integrates Solutions for a Sustainable Future, Sustainability, 12, p. 2662. doi:10.3390/su12072662.
Beare, M.H. et al. (1992) Microbial and faunal interactions and effects on litter nitrogen and decomposition in agroecosystems, Ecological Monographs, 62(4), pp. 569–591.
Bongers, T. (1990). The maturity index: an ecological measure of environmental disturbance based on nematode species composition, Oecologia, 83(1), pp. 14–19. doi:10.1007/BF00324627.
Crawford, J.W., Neilson, R. and Boag, B. (1991). The Effect of Potential Climatic Changes On the Geographical Distribution of the Plant-Parasitic Nematodes Xiphinema and Longidor Us in Europe, Nematologica, 37(1–4), pp. 312–323. doi:10.1163/187529291X00312.
Dar, G.H. and Khuroo, A.A. (2013). Floristic diversity in the Kashmir Himalaya: progress, problems and prospects. Sains Malaysiana, 42(10), pp. 1377–1386.
Doherty, J.M., Callaway, J.C. and Zedler, J.B. (2011). Diversity–function relationships changed in a long-term restoration experiment, Ecological Applications, 21(6), pp. 2143–2155.
Freckman, D.W., (1982). Nematodes in soil ecosystems, No. 631.46 F7.
Freckman, D.W. (1988). Bacterivorous nematodes and organic-matter decomposition. Agriculture, Ecosystems & Environment, 24(1–3), pp. 195–217.
Gaston, K.J. (2000). Global patterns in biodiversity. Nature, 405(6783), pp. 220–227.
Goede, R.G.M.D. and Bongers, T. (1994). Nematode community structure in relation to soil and vegetation characteristics. Applied Soil Ecology, 1(1), pp. 29–44. doi:10.1016/0929-1393(94)90021-3.
Hilty, J. and Merenlender, A. (2000). Faunal indicator taxa selection for monitoring ecosystem health. Biological conservation, 92(2), pp. 185–197.
Hoogen, J.V.D. et al. (2019). Soil nematode abundance and functional group composition at a global scale. Nature, 572, pp. 194–198. doi:10.1038/s41586-019-1418-6.
Hoogen, J.V.D. et al. (2020). A global database of soil nematode abundance and functional group composition. Scientific data, 7(1), pp.1-8.
Hoschitz, M. and Kaufmann, R. (2004). Soil nematode communities of Alpine summits–site differentiation and microclimatic influences. Pedobiologia, 48(4), pp. 313–320. doi:10.1016/j.pedobi.2004.03.004.
Hugot, J.-P., Baujard, P. and Morand, S. (2001). Biodiversity in helminths and nematodes as a field of study: An overview. Nematology, 3, pp. 199–208. doi:10.1163/156854101750413270.
Jairajpuri, M.S. and Ahmad, W. (1992). Dorylaimida: free-living, predaceous and plant-parasitic nematodes. Brill.
Jones, M.G.K. and Fosu-Nyarko, J. (2014). Molecular biology of root lesion nematodes (Pratylenchus spp.) and their interaction with host plants. Annals of applied biology, 164(2), pp. 163–181.
Li, X. Chen, X., Zhu, H. et al. (2020). Effects of historical legacies on soil nematode communities are mediated by contemporary environmental conditions. Ecology and Evolution, 10(13), pp. 6732–6740. doi:10.1002/ece3.6406.
Loof, P.A.A. (1971). Freeliving and plant parasitic nematodes from Spitzbergen, collected by Mr. H. van Rossen.. Mededelingen Landbouwhogeschool Wageningen, 71(7), pp. 1–86.
McGeoch, M.A. (1998). The selection, testing and application of terrestrial insects as bioindicators. Biological Reviews of the Cambridge Philosophical Society (United Kingdom), Biological reviews, 73(2), pp.181-201.
Montoya, D., Yallop, M.L. and Memmott, J. (2015). Functional group diversity increases with modularity in complex food webs. Nature communications, 6(1), pp. 1–9.
Nielsen, U.N., Ayres, E., Wall, D.H. et al. (2014). Global-scale patterns of assemblage structure of soil nematodes in relation to climate and ecosystem properties: Global-scale patterns of soil nematode assemblage structure. Global Ecology and Biogeography, 23(9), pp. 968–978. doi:10.1111/geb.12177.
Oliver, T.H., Heard, M.S., Isaac, N.J., et al. (2015). Biodiversity and resilience of ecosystem functions. Trends in ecology & evolution, 30(11), pp. 673–684.
Overgaard, N. (1949). Studies on the soil microfauna. 11 The soil inhabiting. nematodes. Natura Jutlandica., 2.
Procter, D.L. (1990). Global Overview of the Functional Roles of Soil-living Nematodes in Terrestrial Communities and Ecosystems. Journal of Nematology, 22(1), pp. 1–7.
Procter, D.L.C. (1984). Towards a Biogeography of Free-Living Soil Nematodes. I. Changing Species Richness, Diversity and Densities with Changing Latitude. Journal of Biogeography, 11(2), pp. 103–117. doi:10.2307/2844684.
Reiss, J., Bridle, J.R., Montoya, J.M. et al. (2009). Emerging horizons in biodiversity and ecosystem functioning research. Trends in ecology & evolution, 24(9), pp. 505–514.
Ritz, K. and Trudgill, D.L. (1999). Utility of nematode community analysis as an integrated measure of the functional state of soils: perspectives and challenges. Plant and Soil, 212(1), pp. 1–11. Available at: https://www.jstor.org/stable/42949670 (Accessed: 30 April 2021).
Ruess, L. (1995). Studies On the Nematode Fauna of an Acid Forest Soil: Spatial Distribution and Extraction. Nematologica, 41(1–4), pp. 229–239. doi:10.1163/003925995X00198.
Ruess, L., Michelsen, A. and Jonasson, S. (1999). Simulated climate change in subarctic soils: responses in nematode species composition and dominance structure. Nematology, 1(5), pp. 513–526. doi:10.1163/156854199508513.
Seinhorst, J.W. (1959). A rapid method for the transfer of nematodes from fixative to anhydrous glycerin.. Nematologica, 4(1), pp. 67–69.
Shannon, C.E. and Weaver, W. (1949). The mathematical theory of com-munication. Urbana: University of Illinois Press, 96.
Sohlenius, B. and Bostrom, S. (1999). Effects of global warming on nematode diversity in a Swedish tundra soil – a soil transplantation experiment. Nematology, 1(7), pp. 695–709. doi:10.1163/156854199508720.
Song, D. (2017). Large-scale patterns of distribution and diversity of terrestrial nematodes. Applied Soil Ecology, 114, pp. 161–169. doi:10.1016/j.apsoil.2017.02.013.
Thebault, E. and Loreau, M. (2006). The relationship between biodiversity and ecosystem functioning in food webs. Ecological Research, 21(1), pp. 17–25.
Tilman, D. (2001). Functional Diversity. Encyclopedia of Biodiversity, pp. 109–120. doi:10.1016/B0-12-226865-2/00132-2.
Tomar, V.V.S., Baniyamuddin, M.D. and Ahmad, W. (2006). Community structure of soil inhabiting nematodes in a mango orchard at Aligarh, India. International Journal of Nematology, 16(1), p. 89.
Wall, D.H. and Lynch, J.M., (2000). Soil biodiversity and ecosystem functioning. In Biological Resource Management Connecting Science and Policy. Springer, Berlin, Heidelberg, pp. 283-290.
Wasilewska, L. (1994). The effect of age of meadows on succession and diversity in soil nematode communities.
Wilschut, R.A., Geisen, S., Martens, H. et al. (2019). Latitudinal variation in soil nematode communities under climate warming-related range-expanding and native plants. Global Change Biology, 25(8), pp. 2714–2726. doi:10.1111/gcb.14657.
Wu, T., Ayres, E., Bardgett, R.D. et al. (2011). Molecular study of worldwide distribution and diversity of soil animals. Proceedings of the National Academy of Sciences of the United States of America, 108(43), pp. 17720–17725. doi:10.1073/pnas.1103824108.
Yeates, G.W. (1987). How Plants Affect Nematodes, in Macfadyen, A. and Ford, E.D. (eds) Advances in Ecological Research. Academic Press, pp. 61–113. doi:10.1016/S0065-2504(08)60244-5.
Yeates, G.W., Bongers, T., De Goede, R.G. et al. (1993). Feeding habits in soil nematode families and genera-an outline for soil ecologists. Journal of Nematology, 25(3), pp. 315–331.
Yeates, G.W. (2003). Nematodes as soil indicators: functional and biodiversity aspects. Biology and Fertility of Soils, 37(4), pp. 199–210. doi:10.1007/s00374-003-0586-5.
Yeates, G.W. (2010). Nematodes in Ecological Webs’, in John Wiley & Sons, Ltd Encyclopedia of Life Sciences. Chichester, UK: John Wiley & Sons, Ltd, p. a0021913. doi:10.1002/9780470015902.a0021913.
Yeates, G.W. and Bongers, T. (1999). Nematode diversity in agroecosystems. Invertebrate biodiversity as bioindicators of sustainable landscapes, pp.113-135.

