Department of Basic Science, College of Preparatory Year, University of Hail, Hail-2440, Kingdom of Saudi Arabia.
Corresponding author email: ghazala.physics@gmail.com
Article Publishing History
Received: 10/07/2020
Accepted After Revision: 25/08/2020
Number of publications on novel coronavirus (COVID-19) is increasing rapidly; as a result it is very difficult to make an overview of the research and developments manually. There are many new studies published continuously, so it is important to know about the recent research trends or development in this exciting area. In the present communication, we have used the available bibliometric analyses of novel coronavirus to outline the growth of this topic including number of publications, keywords, co-authorships, co-occurrence, best journal and citation analyses, including the VOS viewer software. The results showed a significant growing attention on the topics of novel coronavirus outbreak (COVID-19). Analysis showed that, authors from USA and China are more active than other countries, followed by England, Italy, Canada and India. The number of publications on novel coronavirus (COVID-19) increased rapidly in April-May, 2020 as the threatening disease spread throughout the world. The analysis also revealed information on the best keywords used, co-authorships, co-occurrence, citations and the journals, among others. The study has included number of publications on novel coronavirus from around the world along with keyword analyses, co-authorship analyses, co-occurrence, and citation analyses. The analysis has also recognized the best writers and journals in the field, and it attempts to determine the future proposasl for monitoring such a vital area research.
Bibliometric trends; COVID-19; Novel coronavirus; SARS-CoV-2; Visualization
Yunus G. Corona Viral Disease-19 Outbreak: Research Publications, Trends and their Visualization. Biosc.Biotech.Res.Comm. 2020;13(3).
Yunus G. Corona Viral Disease-19 Outbreak: Research Publications, Trends and their Visualization. Biosc.Biotech.Res.Comm. 2020;13(3). Available from: https://bit.ly/33ztBsI
Copyright © Yunus This is an open access article distributed under the terms of the Creative Commons Attribution License (CC-BY) https://creativecommons.org/licenses/by/4.0/, which permits unrestricted use distribution and reproduction in any medium, provide the original author and source are credited.
INTRODUCTION
COVID-19 is a disease caused by novel coronavirus (SARS-CoV-2) that can produce symptoms like common cold, cough and fever same as SARS and MERS. The novel coronavirus was originated in China during late 2019 (Gorbalenya et al., 2020; Lu et al., 2020). In March 2020, WHO announced this disease as a pandemic. The symptoms of disease appear from two to fourteen days of disclosure and it comprises temperature, cough, breathing problem, fatigue, pains, and running nose. Until now, no particular medicine or vaccine are available for COVID-19 but we can take precautions to decrease possibility of contagion (Tang et al., 2020). Social distancing and health care with oxygen treatment, fluid controlling, and antibiotics usage for microbial contaminations are suggested (Habibzadeh et al., 2020). Early detection and management can control the spread of COVID-19 disease (WHO, 2020). According to the several directives of the World Health Organization (WHO), the management of the infection could help to reduce the spread of disease (Gidengil et al., 2020). COVID-19 is a disease of international fear and its infection rate is more than the SARS (Liu et al., 2020).
The number of persons infected and died by this disease is also more than that of the earlier severe acute respiratory syndrome, (SARS) (Mahase, 2020). Along with social distancing, quarantining of the infected persons is a key to interrupt the spread of this disease (Wang et al., 2020). If significant public transmission occurs, social distancing, closing of educational institutions, home quarantine, sanitization, and using protective tools such as facemask has been useful (Heymann et al., 2020). The COVID-19 pandemic is obviously a worldwide community health problem and has been getting increased attention to investigate and enhance the capacity of the national and international research laboratories.
The number of publications on the topic of novel coronavirus and COVID-19 are increasing continuously. Therefore, it is important to review the trends of the publications and growth of data for their application in the medicine and vaccine development. Bibliometric analysis may be helpful for this purpose, which is based on statistical analysis to explain the publication trend. A bibliometric analysis is a method to quantify science and technology and their outputs. Researchers find many definitions of the term bibliometrics (Broadus, 1987; Geisler, 2000). Generally, the term bibliometrics is used to quantitative study of publication counts or patterns of publications. Garfield had created the Science Citation Index to study the assembly of measurable elements, (Garfield, 1979).
Bibliometric analyses also provide us the cognitive structure of various research fields. Many research papers published on bibliometric methods, explain the underlying potential and limitations of these methods. There are many publications on different research topics, which can be correctly applied using these methods, but for the best of our knowledge, few elaborate statistical studies for novel coronavirus have been conducted. The present study explains the development in coronavirus publication trends, and comparison of the growth over the years along with novel coronavirus (SARS-CoV-2) and disease COVID-19. These bibliometric analyses have been used to examine the data: (1) publication counts on COVID-19 over the time, (2) countries and authors that are active on publications on COVID-19, (3) core keywords in COVID-19 publications, (4) distinguishable sub-domains related to COVID-19 research, and (5) trends in COVID-19 investigations.
MATERIAL AND METHODS
The efforts of relating bibliometric analyses to publications have demonstrated that they are extremely informative and valuable in relating communication and providing necessary scientific information. The hypothesis of bibliometric is that research publications offer suggestion of the subject areaa. Furthermore, academic publications frequently comprise a number of keywords that define these vital areas of various subjects. Analysis of networks and links can deliver future visions and workings in the related areas (Castells, 1996; Latour, 2005).
Law of distribution: There are two main laws of distribution for bibliometric procedures viz. Bradford’s and Lotka’s law of frequency distribution. According to Bradford distribution law, the number of journals in a subject area may distributed in three sets, each covering an identical publication count (Garfield, 1980; Vickery, 1948). Lotka law states that the number of author who published n number of publication is about 1/n2 of those published one publication (Lotka, 1926). This law also explain that half number of publications in one subject published by a very few writers which is equal to the square root of total number of writers who published in that subject (De et al., 1965; Price et al., 1961).
Choice of the data set: To know about research field, keywords are very useful. In this study, we make an overview and developments in publications on coronavirus and COVID-19. Author keywords are useful choice of terms by person and can change from one publication to other. Different writers used different keywords to specify coronavirus as a main topic in their publications. Along with other measures, we chose the data set Web of Science (Core Collection). This research was started in May 2020, and data are updated on 1st June 2020. Table 1 compares the number of publications on two data sets that is PubMed and Web of Science (WoS). The data from WoS (core collection) was recovered on 1st June 2020 with following specifications:
Table 1. Publications in WoS and PubMed on 1 June 2020.
| Search Term | Number of publications | |
| WoS | PubMed | |
| Coronavirus | 16811 | 25765 |
| COVID-19 | 5210 | 17533 |
| SARS | 14268 | 14855 |
| MERS | 25242 | 19420 |
Topic: COVID -19Timespan: All years, Indexes: SCI-EXPANDED, SSCI, A&HCI, CPCI-S, CPCI-SSH, ESCI. Extra information was retrieved from PubMed to compare number of publications between the dataset and other bases. The supplementary data was taken from PubMed with following search term: ((“COVID-19″[MeSH Terms] OR “COVID-19″[All Fields]), PubMed extended this search term:
COVID-19″[All Fields] OR “COVID-2019″[All Fields] OR “severe acute respiratory syndrome coronavirus 2″[Supplementary Concept] OR “severe acute respiratory syndrome coronavirus 2″[All Fields] OR “2019-nCoV”[All Fields] OR “SARS-CoV-2″[All Fields] OR “2019nCoV”[All Fields] OR ((“Wuhan”[All Fields] AND (“coronavirus”[MeSH Terms] OR “coronavirus”[All Fields])) AND (2019/12[PDAT] OR 2020[PDAT]))
Bibliometric procedures: Bibliometric analyses comprise number of publications, citation analysis, and keyword analysis and so on. Number of publication specifies the size of scientific production and efficiency in a given field, so it considered as a quantification of review procedure (Melkers, 1993). In this analysis, we made publication count for years, type of publications, countries, authors, and keywords. Keyword analysis includes co-occurrences of keywords in different papers, where in keywords allotted. These findings give overview of publication trends (Ellegaard et al., 2015; Melkers, 1993).
Software and pre-processing: There is a lot of software existing for bibliometric work. We selected VOSviewer software by Nic Jan (Van and Nic, 2005). It is freely available and accessible user-friendly software; commonly used for making and envisioning bibliometric graph. It allows distinctive bibliometric methods such as keyword, citation, co-authorship, co-occurrence, and many more. We did some pre-processing in Excel. To clean up the data the thesaurus option available in VOSviewer software was used.
RESULTS AND DISCUSSION
The number of publications provides understanding of the up-to-date research completed in the subject. We made several analyses associated to publications counts, types of publication, states, papers, writers, keywords, citations and co-occurrence; and represent the results under allied sub-titles.
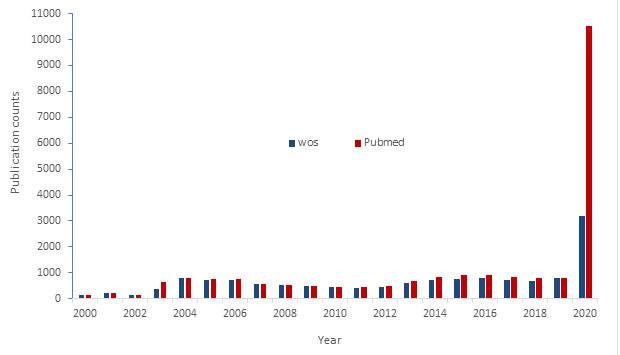
Tendencies of publications on coronavirus and novel coronavirus/COVID-19:The publication counts signify the area of scientific research. It proved by many researchers that the scientific publishing is increasing continuously with high rates in different fields (Larsen and Von, 2010; Price and De, 1963). The numbers of publication on coronavirus are also increasing continuously. Table 1 compares the number of publications on two data set that is PubMed and WoS. The main data for this analysis recovered on 1 June 2020 from WoS (core collection). The dataset suggests sharp growth of publication counts on coronavirus in year 2020, a supporting data also retrieved from PubMed on the same day for the comparison in between two data set. The retrieved data showed that the publication on coronavirus in PubMed started since 1949; but in WoS, it started from 1968 with very few publications. The significant publications found in both data set started from 2000 onwards. Publication trends of growth and decay since 2000 to 2019 in both PubMed and WoS data set is near about same as shown in figure 1.
Figure 1: Yearly number of publication on coronavirus in PubMed and WoS database
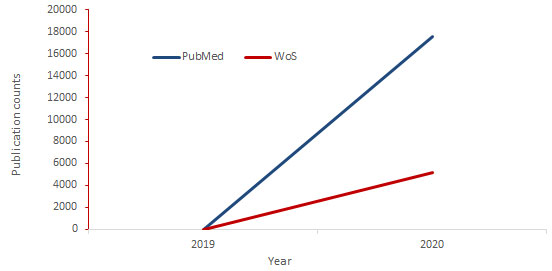
However, in year 2020 there has been a sharp increase in PubMed dataset in comparison to WoS. The publication counts on the topic coronavirus during the year 2020 in PubMed is 10527, while in WoS (core collection) only 3198. Decay in publications are reported in year 2010 in both dataset with 456 in PubMed and 458 in WoS, which represents same trends in both dataset. In current data counts, there is big difference between PubMed and WoS that may be due to selection of only core collection database of WoS. Figure 2 represents number of publication on COVID-19 since 2019 in both data sets. Since starting in 2019, PubMed contains only nine publications with zero in WoS. However, in 2020 there was a sharp increase in publications in which PubMed covered 17524 papers, along with 5210 in WoS.
Figure 2: Number of publication on COVID-19
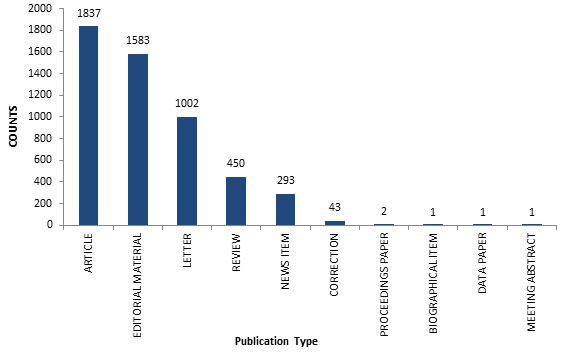
Publication and support types: There are many types of publications for example journal article, review, editorial, case report, clinical analysis, research support and many more. We included all types of research provision from our foremost results and studied distinctly. Journal article is on the top of publication type with a count of 1837 followed by editorial material (1583), letters (1002), reviews (450), and news items (293) as shown in figure 3.
Figure 3: Publication types with counts
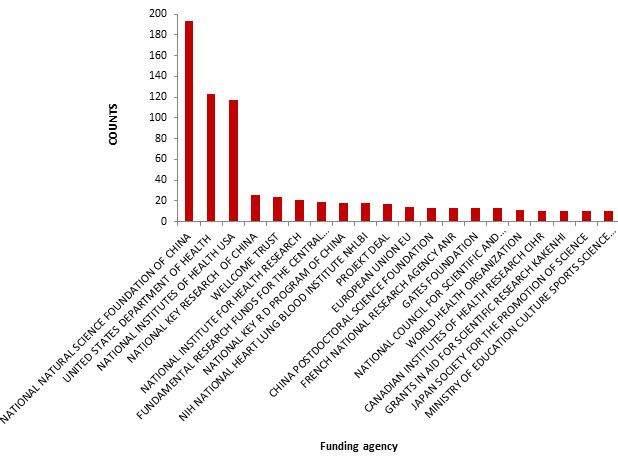
Regarding funding agencies, which support COVID-19 research, National Natural Science Foundation of China is on the top position with 193 records followed by United States Department of Health Services, National Institute of Health USA, National Key Research and Welcome Trust. Figure 4 represents top 20 research funding agencies around the world.
Figure 4: Funding trends for COVID-19 in 2020
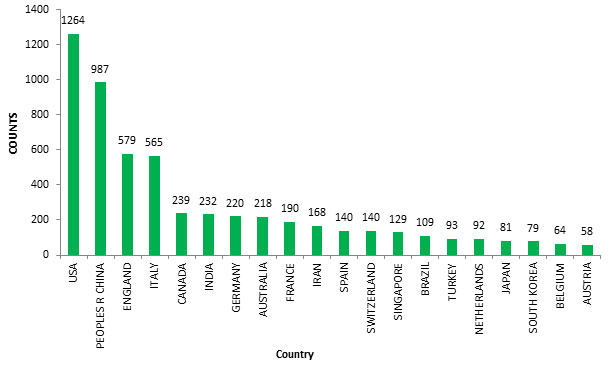
Languages and countries: In analysis of language of publication, we find that the number of publication in English are 95.29%, followed by German (1.55%), Spanish (1.42%), and French (0.40%). The publication counts in other languages are very low. For analysis of the country of publication, we used country evidence from the field ‘place of publication’. USA is on the top position with 24.26% of publications out of 5210 fallowed by China with 18.9%, England 11.11 %, Italy 10.8% and Canada 4.58%. Top 20 countries with publication counts reported in figure 5.
Figure 5: Top 20 countries with number of publication counts
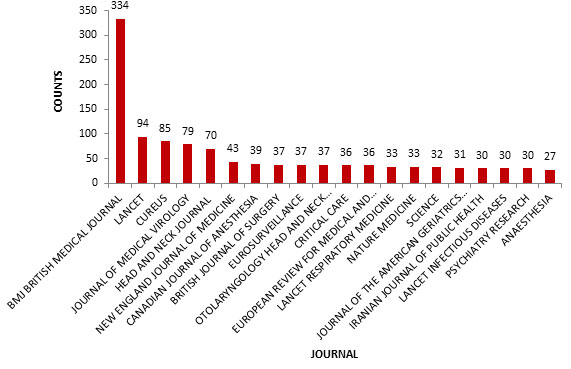
Journal titles: The British Medical Journal comprises highest number of publications (334) which is 6.4% of total publications on COVID-19, followed by Lancet (94) and Cureus (85). Figure 6 represents the topmost 20 journals publishing the research related to novel coronavirus and its disease COVID-19. Most of the publications are from British Medical Journal and very few are from other journal that supported by Bradford’s law.
Figure 6: Top 20 journals for COVID-19 publications
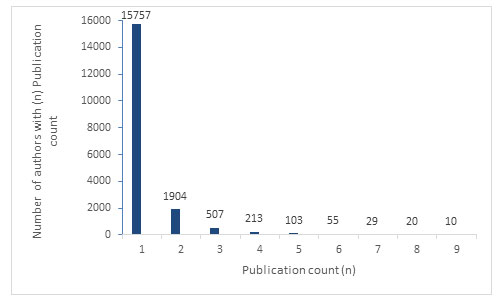
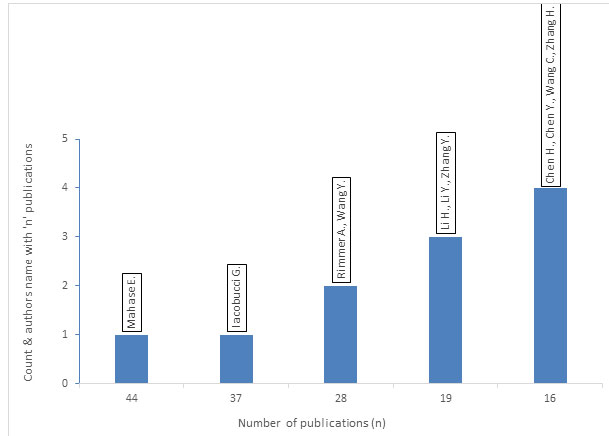
Key authors: In association with Lotka’s law, the results suggested opposite relationship between writers and publication counts by each writer. At one side, many authors (15757) published only one paper and on the other side a very few authors (8) have published more than 20 papers each (Figures 7). In publications, the leading author is written first, and other authors written in decreasing order of their assistances. Normally the first authors have important role in the publication of the paper. We found Mahase Elisabeth as the top writer in the dataset with 44 publications. Mahase, Elisabeth published as a single author all 44 publications; we examined many core papers by Mahase (Mahase, 2020a; 2020b; 2020c; 2020d). Iacobuci Gareth is second highest author with 37 publications as a single author followed by dual author publications by Rimmer Abi and Wang Y, which counted to 28 articles (Figures 8). Figures 7 and 8 represent the inverse correlation as well.
Figure 7: More authors with few publications-many authors contributes only one or few publications on the mentioned topic.
Figure 8: Few authors with more publications-small number of authors contribute many publications on the topic.
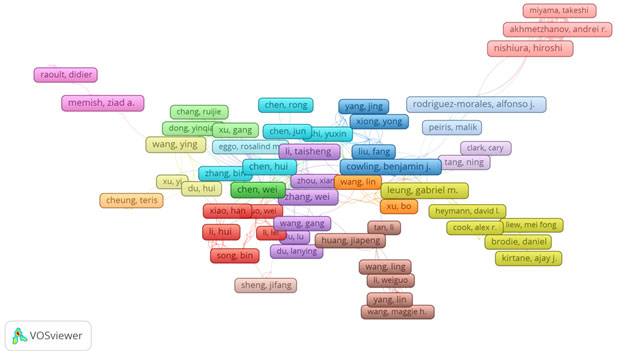
To find of relationships between authors, we conducted co-authorship analysis by using VOSviewer software (www.vosviewer.com). VOSviewer generates plots and picture of data based on refined grouping (Van and Waltman, 2011; Van et al., 2010). During analysis, the minimum number of papers for an author set to three and the documents that have more than 25 authors omitted. Analysis results stated that there are total 19132 authors; however, only 525 authors have co-authorship links. The co-authorship links have 17 different groups that are calculated and pictured by software as presented in figure 9. The groups or clusters are discriminated by different colors. These clusters contain minimum five (cluster 17) to maximum 27 (cluster 1) authors.
Figure 9: Co-authorship analyses with authors. The clusters made by the VOSviewer system. Colors specify cluster of related terms.
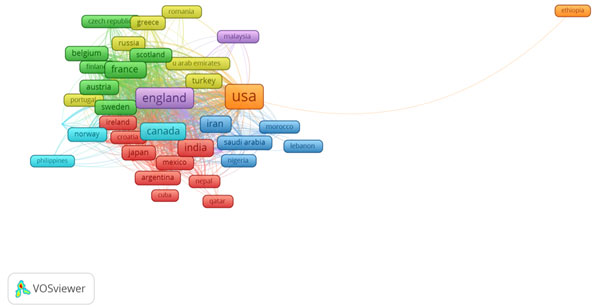
Co-authorship analyses with countries: To analyze co-authorship with countries, we used same procedure as mentioned in previous section by using VOSviewer. During analysis, the minimum number of document of a country was set to five and maximum number of countries for one document set to 25. Result shows that out of 125 countries only 69 countries have co-authorship links. The co-authorship links have seven different groups that are calculated and visualized by software presented in figure 10. The groups or clusters are discriminated by different colors. These clusters contain minimum two (cluster 7) to maximum 21 (cluster 1) countries.
Figure 10: Co-authorship analyses with countries. The clusters made by the VOSviewer system. Colors specify cluster of related terms.
Keyword analysis: WoS database contains three types of keywords viz. all keywords, author keywords, and keywords plus. This study consists of an investigation of all types of keywords. Table 2 represents top 10 keywords with frequency and total link strength. Covid-19 is most frequently used keyword with frequency of 1694.
Table 2. Topmost ten keywords with their frequency
| Keyword | Frequency | Total link strength |
| COVID-19 | 1694 | 69 |
| Coronavirus | 686 | 3466 |
| SARS-COV-2 | 562 | 2979 |
| Pneumonia | 263 | 1560 |
| SARS | 244 | 1636 |
| Pandemic | 243 | 1141 |
| Infection | 151 | 913 |
| China | 134 | 697 |
| Outbreak | 133 | 839 |
| Acute respiratory syndrome | 117 | 737 |
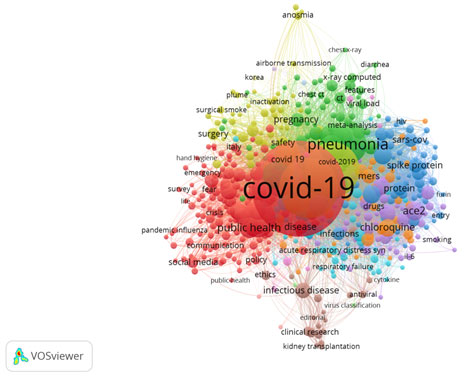
Co-occurrence study of all keywords: The co-occurrences study of keyword is a suitable way to find the core topics of publications. To find co-occurrences analysis, we used VOSviewer tool and prepared two types of analyses such as ‘all keywords’ and ‘author keyword’. By the thesaurus option, pre-processing and clean-up data conducted. During study, the lowest frequency of keywords set to ‘5’, the device then designed the total co-occurrence with other keywords. There are total 6572 keywords, and 519 keywords encounter the threshold. We chose top 519 keywords to include in the studies and visualizations. Figure 11 shows the network visualization of all keywords. These keywords grouped in to 14 clusters. Cluster 1 has 143 items. The topmost keyword COVID-19 is in cluster 1 with total link strength of 6913. The top five keywords are COVID-19, coronavirus, SARS-COV-2, pneumonia and SARS.
Figure 11: Co-occurrence study of all keywords
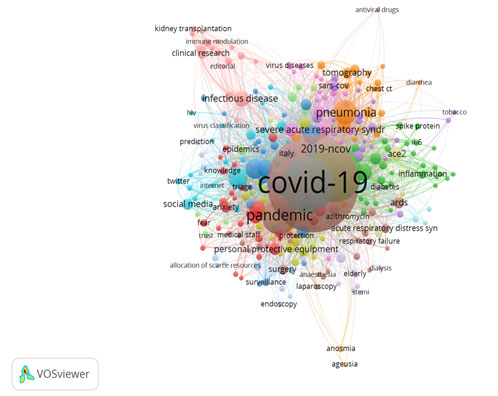
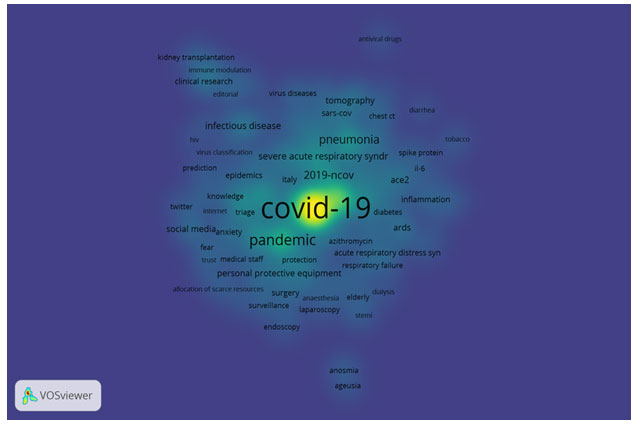
Co-occurrence study of author keywords: In comparison to all keywords, in this segment we emphases on author keywords. The same methodology we used as mentioned in previous section. The minimum number of occurrences was set to five. There are total 4843 keywords and 305 met onset. We selected highest 305 keywords with utmost total bond power. At this time also the terms “COVID-19” is the core keyword by the authors. Seventeen clusters obtained by analysis and represented in figure 12. In calculation to co-occurrence analyses, it provides information to recognize the new keywords that emerges by the authors. Co-occurrence study of author keywords with density visualization presented in figure 13. Colors indicates density of the keyword COVID-19 which is the densest keyword.
Figure 12: Co-occurrence of author keywords.
Figure 13: Co-occurrence analysis of author keywords with density visualization
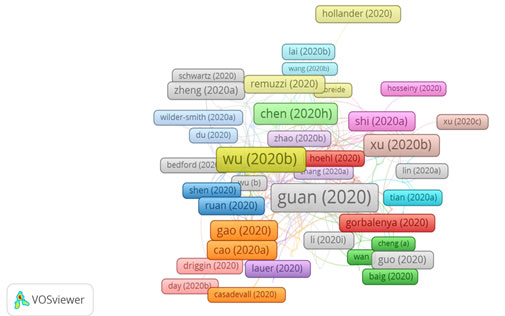
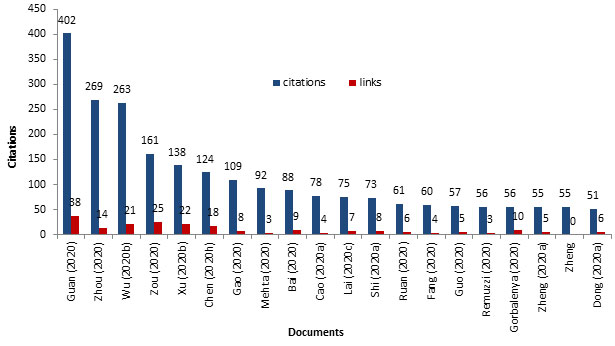
Citation analysis of documents: In this segment, we analyzed documents citation. The minimum number of occurrences fixed to five. Out of 5210 cited documents, 378 seen as threshold. The largest set of connected items consists of 271 items. For each 271 document, the number of citation link calculated and displayed in visualization. Total clusters formed was twenty-eight as represented in figure 14. Cluster 1 contains 16 items and the last cluster 28 have only four items. The documents with decreasing order of citation presented in figure 15. According to citation analyses, the result suggested that the top five documents are from China based authors.
Figure 14: Citation analyses of documents. The clusters made by the VOSviewer software. Colors indicate cluster of related terms.
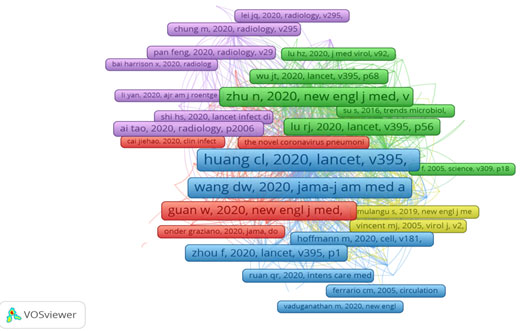
Co-citation analyses of references :For co-citation analysis, minimum number of cited reference was set to 20. Out of 50176 cited references, the threshold value obtained for 304. For each of 304 cited references, the total strength of co-citation links with other cited reference calculated and visualized in figure 16. All items grouped in to five clusters viz. Cluster one (103 items), cluster two (76 items), cluster three (55 items), cluster four (36 items), and cluster five (34 items). The reference with most frequent co-citation “Huang CL, 2020, Lancet, v395, p497, doi 10.1016/s0140-6736(20)30183-5” is in cluster 3 with total link strength of 7377. Table 3 listed twenty topmost cited reference with their total link strength. From co-citation analyses, we can conclude that the documents with highest number of citations are from China based authors.
Table 3. Topmost twenty cited reference with total link strength.
| Rank | Cited reference | Citations | Total link strength |
| 1 | Huang CL, 2020, Lancet, v395, p497, doi 10.1016/s0140-6736(20)30183-5 | 845 | 7377 |
| 2 | Wang DW, 2020, JAMA-J Am Med Assoc, v323, p1061, doi 10.1001/jama.2020.1585 | 546 | 4952 |
| 3 | Chen NS, 2020, Lancet, v395, p507, doi 10.1016/s0140-6736(20)30211-7 | 487 | 5034 |
| 4 | Zhu N, 2020, New Engl J Med, v382, p727, doi 10.1056/nejmoa2001017 | 452 | 3935 |
| 5 | Guan W, 2020, New Engl J Med, v382, p1708, doi 10.1056/nejmoa2002032 | 360 | 3119 |
| 6 | Zhou P, 2020, Nature, v579, p270, doi 10.1038/s41586-020-2012-7 | 299 | 3480 |
| 7 | Chan JFW, 2020, Lancet, v395, p514, doi 10.1016/s0140-6736(20)30154-9 | 282 | 3299 |
| 8 | Lu RJ, 2020, Lancet, v395, p565, doi 10.1016/s0140-6736(20)30251-8 | 266 | 3151 |
| 9 | Zhou F, 2020, Lancet, v395, p1054, doi 10.1016/s0140-6736(20)30566-3 | 252 | 1993 |
| 10 | Wu ZY, 2020, JAMA-J Am Med Assoc, v323, p1239, doi [10.1001/jama.2020.264810.1001/jama.2020.2648 10.1001/jama.2020.2648] | 245 | 1941 |
| 11 | Li Q, 2020, New Engl J Med, v382, p1199, doi 10.1056/nejmoa2001316 | 227 | 2128 |
| 12 | Holshue ML, 2020, New Engl J Med, v382, p929, doi 10.1056/nejmoa2001191 | 203 | 2620 |
| 13 | Wang ML, 2020, Cell Res, v30, p269, doi 10.1038/s41422-020-0282-0 | 177 | 2446 |
| 14 | Zou LR, 2020, New Engl J Med, v382, p1177, doi 10.1056/nejmc2001737 | 148 | 1398 |
| 15 | Rothe C, 2020, New Engl J Med, v382, p970, doi 10.1056/nejmc2001468 | 145 | 1697 |
| 16 | Van Doremalen N, 2020, New Engl J Med, v382, p1564, doi 10.1056/nejmc2004973 | 141 | 1157 |
| 17 | Li Qun, 2020, New Engl J Med, v382, p1199, doi 10.1056/nejmoa2001316 | 131 | 1257 |
| 18 | Xu Z, 2020, Lancet Resp Med, v8, p420, doi 10.1016/s2213-2600(20)30076-x | 128 | 1514 |
| 19 | Ai TAO, 2020, Radiology, p200642, doi 10.1148/radiol.2020200642 | 124 | 1128 |
| 20 | WHO, 2020, Cor Dis 2019 COVID-19 | 119 | 789 |
Figure 15: Top 20 documents with their citations and links
Figure 16: Co-citation analyses of reference. The clusters formed by the VOSviewer algorithm. Colors indicate cluster of related terms.
CONCLUSION
These analyses provide a review of publications on the subject COVID-19. The study demonstrated stable progress in correlated publications, with a greater speed of progress in current year. The study determined total numbers of publications country wise and reported that the authors from USA influence the publications; fallowed by China, England, Italy, Canada and India. The publication supremacy proved by USA based author in this field and putting it as a top dealer to the worldwide. The top journals in which the articles published are British Medical Journal followed by Lancet, Cureus, and Journal of Medical Virology. In analyses of publication types, Article is on the top position fallowed by Editorial material, Letter and Review papers. Regarding research-funding agency, National Natural Science Foundation of China is at the top position is followed by United States Department of Health Services. Along with best authors in related field, the study also suggested that there are few authors with many publications but more authors with only one publication. These findings fallows distribution law of bibliometrics. The author with highest publication count is Mahase Elisabeth.
In a co-occurrence study, the best five ‘all keywords’ are COVID-19, coronavirus, SARS-COV-2, pneumonia and SARS. In analysis of ‘author keywords’, the top five keywords include COVID-19, coronavirus, SARS-COV-2, pandemic and 2019-nCOV. The top three keywords (COVID-19, Coronavirus, SARS-COV-2) are the same in both analyses that is in ‘all keywords’ and ‘author keywords’. In density visualization also, we found that the keywords COVID-19 is a most arising keyword. Furthermore, the outcome of citation analysis of document and co-citation of reference represents that the publication by China based authors are highest cited reference. These results revealed growth of publications and delivered bibliometric assessment of COVID-19 and allied research, which can be helpful for future research and development in the field. The worldwide researchers working especially on COVID-19 pandemic will be benefited by this updated knowledge on related field.
Conflict of interest: The author declares no conflict of interest.
REFERENCES
Broadus, R.N., (1987). Toward a definition of “bibliometrics.” Scientometrics, 12(5-6), pp.373–379. Available at: http://dx.doi.org/10.1007/bf02016680.
Castells, M., (1996). The rise of the network society; Volume I: The Information Age: Economy, Society and Culture. Blackwell, Cambridge, MA, USA.
De, S., Price, D.J., (1965). Networks of Scientific Papers- The pattern of bibliographic reference indicates the nature of the scientific research front. Science, 149, pp.501–515.
Ellegaard, O. & Wallin, J.A., (2015). The bibliometric analysis of scholarly production: How great is the impact? Scientometrics, 105(3), pp.1809–1831. Available at: http://dx.doi.org/10.1007/s11192-015-1645-z.
Garfield, E., (1979). Citation indexing: Its theory and application in science, technology, and humanities. Wiley, New York, USA.
Garfield, E., (1980). Bradford’s law and related statistical patterns. Current. Contents, 19, pp.5-12.
Geisler, E., (2000). The metrics of science and technology; Quorum Books: Westport, CT, USA.
Gidengil, C.A., Parker, A.M. & Zikmund-Fisher, B.J., (2012). Trends in Risk Perceptions and Vaccination Intentions: A Longitudinal Study of the First Year of the H1N1 Pandemic. American Journal of Public Health, 102(4), pp.672–679. Available at: http://dx.doi.org/10.2105/ajph.2011.300407.
Gorbalenya, A.E. et al., (2020). Severe acute respiratory syndrome-related coronavirus: The species and its viruses – a statement of the Coronavirus Study Group. Available at: http://dx.doi.org/10.1101/2020.02.07.937862.
Habibzadeh, P., Stoneman, E.K., (2020). The novel coronavirus: a bird’s eye view. International Journal of Occupational and Environmental Medicine, 11(2), pp. 65–71.
Heymann, D.L. & Shindo, N., (2020). COVID-19: what is next for public health? The Lancet, 395(10224), pp.542–545. Available at: http://dx.doi.org/10.1016/s0140-6736(20)30374-3.
Larsen, P.O. & von Ins, M., (2010). The rate of growth in scientific publication and the decline in coverage provided by Science Citation Index. Scientometrics, 84(3), pp.575–603. Available at: http://dx.doi.org/10.1007/s11192-010-0202-z.
Latour, B., (2005). Reassembling the social- An introduction to actor-network theory. Oxford University Press, Oxford, UK.
Liu, Y. et al., (2020). The reproductive number of COVID-19 is higher compared to SARS coronavirus. Journal of Travel Medicine, 27(2). Available at: http://dx.doi.org/10.1093/jtm/taaa021.
Lotka, A.J., (1926). The frequency distribution of scientific productivity. Journal of the Washington Academy of Sciences, 16, pp.317–323.
Lu, H., Stratton, C.W. & Tang, Y., (2020). Outbreak of pneumonia of unknown etiology in Wuhan, China: The mystery and the miracle. Journal of Medical Virology, 92(4), pp.401–402. Available at: http://dx.doi.org/10.1002/jmv.25678.
Mahase, E., (2020). Coronavirus: covid-19 has killed more people than SARS and MERS combined, despite lower case fatality rate. BMJ, p.m641. Available at: http://dx.doi.org/10.1136/bmj.m641.
Mahase, E., (2020a.) Covid-19: Cancer Research urges mass testing to enable care to continue during pandemic. BMJ, p.m1561. Available at: http://dx.doi.org/10.1136/bmj.m1561.
Mahase, E., (2020b). Covid-19: First coronavirus was described in The BMJ in 1965. BMJ, p.m1547. Available at: http://dx.doi.org/10.1136/bmj.m1547.
Mahase, E., (2020c). Covid-19: Mental health consequences of pandemic need urgent research, paper advises. BMJ, p.m1515. Available at: http://dx.doi.org/10.1136/bmj.m1515.
Mahase, E., (020d). Covid-19: WHO and South Korea investigate reconfirmed cases. BMJ, p.m1498. Available at: http://dx.doi.org/10.1136/bmj.m1498.
Melkers, J., (1993). Bibliometrics as a Tool for Analysis of R&D Impacts. Evaluating R&D Impacts: Methods and Practice, pp.43–61. Available at: http://dx.doi.org/10.1007/978-1-4757-5182-6_3.
Price, D.J., De, S., (1961). Science since babylon; Yale University Press: New Haven, CT, USA.
Price, D.J., De, S., (1963). Little Science, Big Science. Columbia University Press, New York, USA.
Tang, J.W., Tambyah, P.A. & Hui, D.S.C., (2020). Emergence of a novel coronavirus causing respiratory illness from Wuhan, China. Journal of Infection, 80(3), pp.350–371. Available at: http://dx.doi.org/10.1016/j.jinf.2020.01.014.
Van Eck, N.J. et al., (2010) A comparison of two techniques for bibliometric mapping: Multidimensional scaling and VOS. Journal of the American Society for Information Science and Technology, 61(12), pp.2405–2416. Available at: http://dx.doi.org/10.1002/asi.21421.
Van Eck, N.J., Waltman, L., (2011). Text mining and visualization using VOSviewer. ISSI Newsletter, 7(3), pp.50-54.
Van Eck, N.J., Waltman, L., (2009). VOSviewer: A computer program for bibliometric mapping. ERIM Report Series Reference No. ERS-2009-005-LIS. Available online: https://ssrn.com/abstract= 1346848.
Vickery, B.C., (1948). Bradford’s law of scattering. Journal of Documentation, 4, pp.198–203.
Wang, C. et al., (2020). A novel coronavirus outbreak of global health concern. The Lancet, 395(10223), pp.470–473. Available at: http://dx.doi.org/10.1016/s0140-6736(20)30185-9.
WHO, (2020). Global surveillance for human infection with novel corona-virus (2019-nCoV).

