Biodiversity Research Laboratory, Department of Zoology, Shri Shivaji Science
College, Amravati, Maharashtra, 444603 India.
Corresponding author email: vaishnavikuralkar@gmail.com
Article Publishing History
Received: 25/04/2024
Accepted After Revision: 29/06/2024
The increasing loss of biodiversity globally has led to numerous proposals to intensify efforts to produce a census of all biological diversity and to modernize taxonomy. Over the years, a steady decline has been observed in the abundance and diversity of native fishes in the rivers due to anthropogenic disturbances. The present study was carried out on fish diversity from the major rivers and their tributaries in the Amravati district including the Melghat landscape in Maharashtra. The study was conducted from December 2022 to May 2024. Muscle and fin tissue was collected onsite by following standard protocols to avoid contamination. In this study, a total of 46 species belonging to 36 genera, 16 families, were DNA barcoded using the mitochondrial cytochrome c oxidase subunit I (COI) gene. All of the fish species were discriminated by their COI sequences, showing deep genetic divergence, and were highlighted for further taxonomic investigation. Average Kimura 2-parameter genetic distances within species of families like Channidae, Cyprinidae, and other families 0.75%, 0.82%, and 0.97% are respectively.
These values show that COI divergence increases as taxa become less exclusive. Devario aequipinnatus from the family Cyprinidae showed the highest overall GC content at 40.00% , Oreochromis mossambius from the family Chhichlidae had the lowest 28.57% indicating the divergence in the nucleotide composition of fishes. All of the COI sequences obtained were grouped according to their species designation in the maximum likelihood tree that was constructed using MEGA 11 software. This study demonstrated that DNA barcoding has great potential as a tool for fast and accurate species identification and also for highlighting species that warrant further taxonomic investigation.
Coi, Dna Barcoding, Freshwater Fishes, Tapi, Wardha, Purna, Amravati District, Melghat
Kuralkar V.S, Wagh G.A.On revealing the hidden richness of fish diversity from Melghat Regiion of Maharashtra, India using DNA Barcoding: A First Approach. Biosc.Biotech.Res.Comm. 2024;17(2).
Kuralkar V.S, Wagh G.A.On revealing the hidden richness of fish diversity from Melghat Regiion of Maharashtra, India using DNA Barcoding: A First Approach. Biosc.Biotech.Res.Comm. 2024;17(2). Available from: <a href=”https://shorturl.at/aFyL6“>https://shorturl.at/aFyL6</a>
INTRODUCTION
Fish account for approximately half of all vertebrates with 34,300 species identified worldwide. Approximately 7.7% of the world’s fish are in India, with 994 species classified as freshwater and 1,673 as marine. Sustainable management of genetic resources requires an awareness of fish species taxonomy and systematics. At present many species have become extinct to Indian origin, there is an urgent need to develop a tool to describe all the earth’s species so that the associated societal and economic benefits can be derived in addition to evolving strategies for protecting fishes and conserving the resources they constitute). When differentiating between cryptic species of adult fish and larval fish, morphology is not as effective as DNA barcoding, (Krishna et.al. 2012 Shelake etal 2021).
However, DNA barcoding has the potential to identify specific species. The research area’s cryptic species, species composition, and several unclear species may all be quickly surveyed using the DNA barcode technology, which can also be used to identify physically similar species (Ko et al. 2013). Applications for barcoding have a great deal of potential appeal in the fishing industry. The authentication of species in fisheries is becoming increasingly dependent on genetics (Ardura et al 2013). DNA barcoding, which is supported by Hebert et al. (2003a, 2003b), aims to make it easier to recognize the growing number of taxa that are unfamiliar in biological conservation and biodiversity surveys. The 652 base pair target DNA fragment regarding fishes is highly suggested to be located close to the 5′ ends of the mitochondrial cytochrome oxidase subunit I gene (Zhang et.al. 2011).
DNA barcoding’s main objectives are to create reference libraries of barcode sequences for recognized species so that trustworthy molecular tools for identifying species in the wild can be created (Hubert et. al. 2008). Numerous marine and freshwater fish have benefited from the technology’s application. In addition to successfully classifying unknown specimens into recognized species, DNA barcoding is an emerging method for species identification that can also identify genetically distant populations. The positive outcomes have spurred global initiatives to expedite the process of identifying cryptic species and standardize the screening of species diversity (Lakra et al. 2016). Furthermore, intraspecific genetic variation in fish species can be discovered using the DNA barcoding method (Decru et al.2016).
96 species under 52 genera and 19 families from Melghat Tiger Reserve, 17 species from the Salbardi region near Morshi taluka of Amravati district, and 36 species belonging to 11 families from the rivers of the Amravati district respectively (Yadav 2005; Wagh et.al 2008; Wankhade 2015) have been reported, but the identification of fishes was done by a classical method which sometimes could give discrepancies in species confirmation. To overcome this limitation, the use of molecular tools has proven beneficial, and the present study is one of the few and first in this region to analyse the fish diversity using DNA barcoding.
MATERIALS AND METHODOLOGY
Study Area – Major rivers and their tributaries in the Amravati district: Amravati district lies between – (20° 32′ and 21° 46′ NL) and (76° 37′ and 78° 27′ EL). It occupies an area of 12,149.7 sq. Km. This district is situated right in the center of the northern border of Maharashtra State. The district is an undulating plain of black soil of a fertile type, its richest tracts being perhaps in the neighborhood of the Wardha and the Purna rivers. It is watered by several streams which rise in the Satpudas in the north. The climate of this district is characterized by a hot summer and general dryness throughout the year except during the southwest monsoon season. The temperature of the district varies between 12.4°C to 44.5°C and the average rainfall is 841.8. The district is bestowed with three major rivers namely the Tapi river, Purna river, and the Wardha river, and their important tributaries like the Sapan river, Chandrabhaga river, Pedhi river, Sipna river, Bembla river, Gadga river, Khandu river, Khapra river, Dolar river, were surveyed during the study. Tapi lies towards the southern part of the Melghat hills, The Purna, the largest of them rises near Bhainsdehi in the Betul district of Madhya Pradesh at a height of just over 760 meters in the Satpudas, The Wardha river rises to the east of Multai in Madhya Pradesh and forms the eastern boundary of the Amravati district and receives several short tributaries on its right flowing within the district.
In the Amravati district, the area of Melghat is drained by the Khandu river, the Khapra river, the Sipna river, the Gadga river and the Dolar river which are tributaries of the Tapi river. The climate of Melghat is tropical and the forest is dry and deciduous in which December is the coldest month 13°C and 22°C is the maximum temperature. Annual rainfall amounts to 2250 mm which gradually decreases towards the north where it is recorded to 1000mm only.
Figure 1: Map showing surveyed station in the rivers of the
Amravati district including Melghat
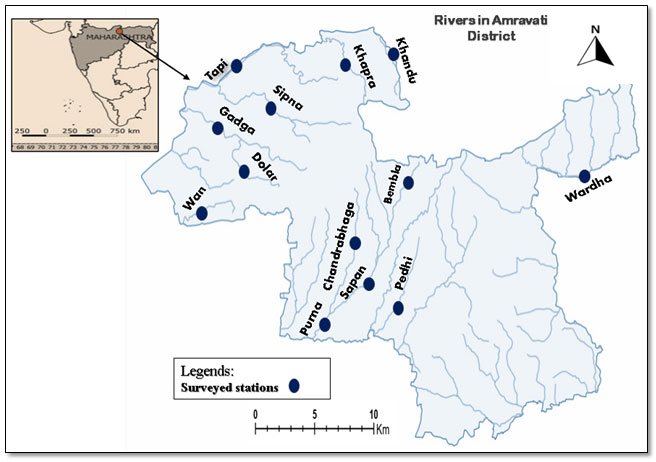
Figure 2: View of rivers in the Amravati district including Melghat surveyed during the
study period to document fish diversity
A-Tapi river, B- Upparwardha reservior, C-Purna river, D-Pedhi river, E-Sapan river,
F-Chandrabhaga river, G-Bembla river, H-Gadga river, I-Sapan river
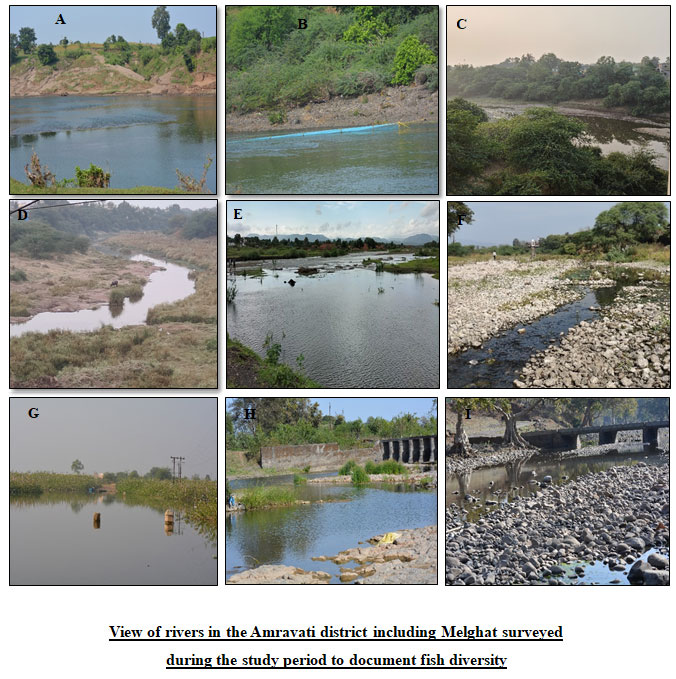
Table 1. Riverwise stations were covered during the study.
| Rivers | Surveyed Stations | GPS coordinates |
| Tapi | Rangubeli | 77.14015°N and 21.71775°E |
| Amner fort | 76.78457°N and 21.52881°E | |
| Sipna | Semadoh | 77.31222°N and 21.497444°E |
| Kolkas | 77.17418°N and 21.50213°E | |
| Harisal | 77.124218°N and 21.523066°E | |
| Gadga | Amner fort | 76.78457°N and 21.52881°E |
| Dolar | Dhakna | 77.05934°N and 21.433778 °E |
| Wardha | Upparwardha | 78.022228°N and 21.30918°E |
| Purna | Asegaon Purna | 77.569182°N and 21.1267°E |
| Pedhi | Walgaon | 77.70328°N and 20.99899°E |
| Sapan | Sawali | 77.485433°N and 21.310439°E |
| Chandrabhaga | Wadgaon | 77.438672°N and 21.279106°E |
| Bembla | Bhuikhed | 78.014728° N and 20.654545°E |
Methodology Sample collection: Fishes were collected from different rivers of the Amravati district including Melghat namely the major rivers like the Tapi, Purna, and Wardha and their major tributaries. All the fishes were identified morphometrically, with the help of Day (1875-78, 1889), Koumans (1953), Talwar and Jhingran (1991) FAO-Fisheries Identification Sheets (1974). Voucher specimens were maintained in the college departmental laboratory. Samples were collected from December 2022 to May- 2024. Digital photographs of all the fishes were taken immediately and the fish were stored at (-20°C), and approximately 100 mg of muscle tissue from each species was preserved in 70% ethanol until used. Further procedures from the DNA isolation to the Fish identification were performed with the help of the experts in the Bioscience Barcoding Laboratory, Banglore, India.
Experimental Methods
- DNA was isolated from the tissue sample of fish provided. Its quality was evaluated on 1.0 % agarose gel, and a single band of high-molecular-weight DNA was observed.
2. Fragment of the COI ( cytochrome oxidase-I) gene was amplified by Fish F1 and Fish F2; Fish R1 and Fish R2 primers. A single discrete PCR (Polymerase chain reaction) amplicon band of 700 bp was observed when resolved on agarose gel.
Fish F1- 5’TCAACCAACCACAAAGACATTGGCAC3′
Fish F2- 5’TCGACTAATCATAAAGATATCGGCAC3′
Fish R1- 5’TAGACTTCTGGGTGGCCAAAGAATCA3′
Fish R2- 5’ACTTCAGGGTGACCGAAGAATCAGAA3′
- The PCR amplicon was purified to remove contaminants.
- Forward and reverse DNA sequencing reaction of PCR amplicon was carried out with Fish F1 and Fish F2; Fish R1 and Fish R2 primers using BDT v3.1 Cycle sequencing kit on ABI 3730xl Genetic Analyzer.
- A consensus sequence of COI genes was generated from forward and reverse sequence data using aligner software.
- The COI gene sequence was used to carry out BLAST (Basic Local Alignment Search Tool) with the ‘nr’(non-redundant) database of the NCBI (National Center for Biotechnology Information) GenBank database. Based on the maximum identity score first ten sequences were selected and aligned using the multiple alignment software program Clustal W.
Data analysis: In total 46 species sequences were aligned using Clustal W and pairwise evolutionary distance was determined by the Kimura 2-parameter method (Kimura 1980) using the software program MEGA 11. Reference sequences of these five species were retrieved from NCBI (National Center for Biotechnology Information) GenBank and the familywise phylogenetic tree was constructed using the maximum likelihood method. To verify the robustness of the internal nodes of the ML tree, bootstrap analysis was carried out using 100 pseudoreplicates. The base composition and genetic distance of each fish species barcoded was obtained using the software MEGA 11.
RESULTS AND DISCUSSION
A total of 46 COI of different freshwater fish species were analyzed in the Amravati district including the Melghat landscape from 17 families and 35 genera. Among the 46 species identified 18 species are newly recorded for the Amravati district. The BLAST searches by each sample sequence in GenBank revealed the closest matches with sample 1 depicting the scientific name, IUCN category, and accession number (NCBI). COI barcodes obtained ranged from 604 to 664 bp, with an average of 640 bp (table 2).
Maximum diversity has been seen in the Wardha river with some 17 species of fishes, followed by the Tapi from the Melghat landscape which is 15,the Purna river, the Pedhi river, the Chandrabhaga river,the Sapan river, the Bembla river, the Sipna river from the Melghat .
Nucleotide content analysis showed the following average frequencies: Adenine (A): 22.43%, Thymine (T): 28.21%, Cytosine (C): 25.32%, and Guanine (G): 24.04%. Overall nucleotide content and content at each codon position are presented in Table 3. Devario aequipinnatus from family Cyprinidae showed the highest overall GC content at 40.00% (G: 15.71% + C: 24.29%) while Oreochromis mossambius from family Chhichlidae had the lowest at 28.57% (G: 15.71%+ C: 12.86%).. Overall genetic distance within the family Channidae is 0.75%, Cyprinidae 0.82% and the other remaining fishes of different families is 0.97%.
The genetic distance between the fishes of different families is highest displayed increasing genetic variation at increasing taxonomic levels. The phylogenetic tree shows that the species are all related, but some are more closely related than others. For example, in the cyprinidae family, the species Puntius sophore and Puntius conchonius are more closely related to each other than they are to any other species in the tree. This is because they share a more recent common ancestor and are similarly the same in the other two phylogenetic trees. Clarias batrachus clusters with Heteropneustes fossilis with high support (92%). This suggests that these species share a more recent common ancestor than with other species in the tree. They belong to the family Clariidae, which are air-sac catfish.
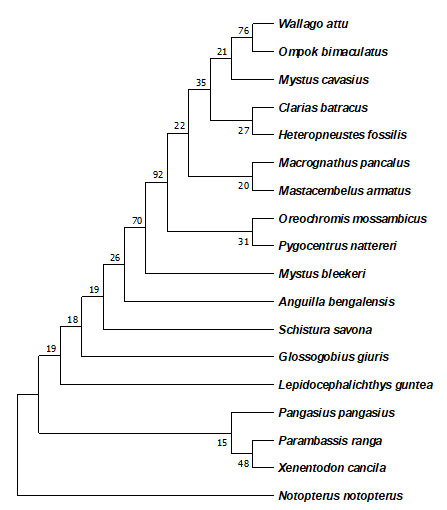
The clade with Oreochromis mossambicus (Oreochromidae) and Pygocentrus nattereri (Serrasalmidae) has moderate support (70%). This grouping is less certain than the Clarias-Heteropneustes grouping. It suggests these lineages may have diverged from a common ancestor more distantly than the Clarias and Heteropneustes species. Anguilla bengalensis (Anguillidae) and Schistura savona (Nemacheilidae) form a separate clade with high support (76%). This means they likely share a more recent common ancestor than with other species on the tree. Several well-supported clades are present at the bottom of the tree. These include the clade with Pangasius pangasius and Mystus bleekeri (both Pangasiidae) and the clade with Xenentodon cancila (Notopteridae) and Notopterus notopterus (Notopteridae).
This suggests strong evolutionary relationships within these families. DNA barcoding can be used for the authentication of documenting the fish diversity within the area of high potential for biodiversity existence due to the supporting ecology present there.
Table 2. Fishes with their accession number in the NCBI database
| FAMILY | SCIENTIFIC
NAME |
IUCN | Accession
Number |
| Angullidae (2) | Anguilla bengalensis (Mottled eel) | (NT) | MK572031.1
|
| Macrognathus pancalus (Spiny eel) | (LC) | JX983358.1
|
|
| Cyprinidae (24) | Ariza labeo (Labeo) | (DD) | FJ459477.1 |
| Barbus barbus*(The common barbel) | (LC) | ON097307.1 | |
| Barilius bendelisis*(Indian hill trout) | (VU) | MK277203.1 | |
| Cirrhinus cirrhosus*(Mrigal carp) | (LC) | MK572126.1 | |
| Ctenopharyngodon idella (Grass carp) | (LC) | OP575587.1
|
|
| Cyprinus carpio (Common carp) | (LC) | JX983284.1
|
|
| Devario aequipinnatus* (Giant danio) | (VU) | MK599491.1 | |
| Garra mullya (Suckerfish) | (LC) | JX983296.1 | |
| Hypophthalmichthys molitrix* (Silver carp) | (LC) | JX983319.1 | |
| Labeo boggut (Minor carp) | (LC) | JX983331.1 | |
| Labeo catla (Catla) | (LC) | JX983340.1
|
|
| Labeo calbasu (Labeo) | (DD) | JX983340.1 | |
| Labeo rohita (Rohu) | (LC) | JX983352.1 | |
| Labeo bata (Bata) | (LC) | MH156965.1 | |
| Pethia ticto (Ticto barb) | (LC) | MF966244.1
|
|
| Puntius sophore (Stigma barb) | (LC) | MK599535.1 | |
| Puntius stigma (Pool barb) | (LC) | JX260943.1 | |
| Puntius conchonius* (Rosy barb) | (LC) | JN965201.1 | |
| Rasbora doniconius (Blackline rasbora) | (VU) | MN342807.1 | |
| Systomus sarana*(Olive barb) | (NT) | JX983460.1 | |
| Salmostoma bacaila (Large razorbelly minnow) | (LC) | EU417789.1 | |
| Thynnichthys sandkhol* (Sandkhol) | (VU) | JX260985.1
|
|
| Tor khudree*(Blue–finned mahaseer) | (CR) | KX946824.1 | |
| Tor remadevii*(Orange– finned mahaseer) | (VU) | MG769040.1 | |
| Channidae (4) | Channa punctatus (Spotted snakehead) | (LC) | MN178288.1
|
| Channa marulius* (Bullseye snakehead) | (DD) | OL638201.1
|
|
| Channa striata (Striped snakehead) | (LC) | OP575576.1
|
|
| Channa gachua*(Dwarf snakehead) | (LC) | MK599523.1
|
|
| Bagridae (2) | Mystus bleekeri*(Day’s mystus) | (DD) | OP661359.1
|
| Mystus cavasius (Gangetic mystus) | (LC) | MK577973.1
|
|
| Siluridae (2) | Wallago attu (Wallago attu)
|
(VU) | MK577971.1
|
| Ompok bimaculatus (Butter catfish) | (DD) | OM273996.1
|
|
| Ambassidae (1) | Parambassis ranga (Indian glassy fish) | (LC) | KY694517.1
|
| Belonidae (1) | Xenentodon cancila (Freshwater garfish) | (CR) | MK359936.1
|
| Cichlidae (1) | Oreochromis mossambius* (Mazambique tilapia) | (LC) | KU565826.1
|
| Clarridae (1) | Clarius batratus (Walking catfish) | (LC) | MG988401.1
|
| Cobitidae (1) | Lepidocephalichthys guntea* (Guntea loach) | (LC) | MH197211.1
|
| Gobiidae (1) | Glossogobius giuris (Tank gobby) | (LC) | MN172285.1
|
| Heteropneustidae (1) | Heteropneustes
Fossilis (Fossil cat) |
(LC) | MK572259.1
|
| Mastacembelidae(1) | Mastacembelus armatus (Zig–zag eel) | (LC) | JX983365.1
|
| Nemacheilidae (1) | Schistura savona* (Stone loach) | (VU) | KJ542585.1
|
| Notopteridae (1) | Notopterus notopterus (Bronze featherback) | (NT) | MK336899.1
|
| Pangassidae (1) | Pangasius pangasius* (Pangas) | (VU) | MK572424.1
|
| Serrasalmidae (1) | Pygocentrus nattereri* (Red –bellied piranha) | (LC) | MG752582.1 |
Table 3. Nucleotide composition of fish barcoded
| Species | T | C | A | G | Total |
| Labeo ariza | 25.71428571 | 27.1428571 | 21.428571 | 25.7142857 | 70 |
| Barbus barbus | 31.42857143 | 24.2857143 | 21.428571 | 22.8571429 | 70 |
| Barilius bendelisis | 25.71428571 | 27.1428571 | 17.142857 | 30 | 70 |
| Cirrhinus cirrhosus | 31.42857143 | 24.2857143 | 18.571429 | 25.7142857 | 70 |
| Cyprinus carpio | 22.85714286 | 30 | 20 | 27.1428571 | 70 |
| Devario aequipinnatus | 48.57142857 | 14.2857143 | 21.428571 | 15.7142857 | 70 |
| Garra mullya | 32.85714286 | 24.2857143 | 17.142857 | 25.7142857 | 70 |
| Hypophthalmichthys molitrix | 30.43478261 | 24.6376812 | 21.73913 | 23.1884058 | 69 |
| Labeo catla | 28.57142857 | 27.1428571 | 20 | 24.2857143 | 70 |
| Labeo calbasu | 31.42857143 | 24.2857143 | 20 | 24.2857143 | 70 |
| Labeo rohita | 31.42857143 | 22.8571429 | 21.428571 | 24.2857143 | 70 |
| Labeo bata | 20 | 31.4285714 | 22.857143 | 25.7142857 | 70 |
| Puntius sophore | 17.14285714 | 32.8571429 | 25.714286 | 24.2857143 | 70 |
| Puntius arenatus | 30 | 21.4285714 | 25.714286 | 22.8571429 | 70 |
| Puntius conchonius | 25.71428571 | 25.7142857 | 27.142857 | 21.4285714 | 70 |
| Rasbora rasbora | 37.14285714 | 25.7142857 | 15.714286 | 21.4285714 | 70 |
| Systomus sarana | 27.14285714 | 25.7142857 | 22.857143 | 24.2857143 | 70 |
| Salmostoma bacaila | 21.42857143 | 31.4285714 | 21.428571 | 25.7142857 | 70 |
| Thynnichthys sandkhol | 34.28571429 | 22.8571429 | 15.714286 | 27.1428571 | 70 |
| Tor khudree | 27.14285714 | 25.7142857 | 27.142857 | 20 | 70 |
| Tor remadeviae | 24.28571429 | 31.4285714 | 21.428571 | 22.8571429 | 70 |
| Channa punctata | 24.28571429 | 25.7142857 | 27.142857 | 22.8571429 | 70 |
| Channa marulius | 34.28571429 | 21.4285714 | 12.857143 | 31.4285714 | 70 |
| Channa striata | 24.28571429 | 35.7142857 | 24.285714 | 15.7142857 | 70 |
| Channa gachua | 30 | 27.1428571 | 20 | 22.8571429 | 70 |
| Mystus bleekeri | 25.71428571 | 25.7142857 | 25.714286 | 22.8571429 | 70 |
| Mystus cavasius | 27.14285714 | 24.2857143 | 22.857143 | 25.7142857 | 70 |
| Wallago attu | 22.85714286 | 30 | 24.285714 | 22.8571429 | 70 |
| Ompok bimaculatus | 25.71428571 | 27.1428571 | 24.285714 | 22.8571429 | 70 |
| Parambassis ranga | 27.14285714 | 27.1428571 | 18.571429 | 27.1428571 | 70 |
| Xenentodon cancila | 28.57142857 | 15.7142857 | 22.857143 | 32.8571429 | 70 |
| Oreochromis mossambius | 40 | 12.8571429 | 31.428571 | 15.7142857 | 70 |
| Clarias batratuss | 20 | 27.1428571 | 25.714286 | 27.1428571 | 70 |
| Glossogobius giuriss | 28.57142857 | 24.2857143 | 18.571429 | 28.5714286 | 70 |
| Heteropneustes fossilis | 30 | 21.4285714 | 25.714286 | 22.8571429 | 70 |
| Mastacembelus armatus | 17.14285714 | 30 | 27.142857 | 25.7142857 | 70 |
| Schistura savona | 31.42857143 | 24.2857143 | 20 | 24.2857143 | 70 |
| Notopterus notopterus | 22.85714286 | 22.8571429 | 24.285714 | 30 | 70 |
| Pangasius pangasius | 30 | 22.8571429 | 18.571429 | 28.5714286 | 70 |
| Pygocentrus nattereri | 25.71428571 | 28.5714286 | 27.142857 | 18.5714286 | 70 |
| Lepidocephalichthys guntea | 32.85714286 | 24.2857143 | 18.571429 | 24.2857143 | 70 |
| Ctenopharyngodon idella | 28.6 | 27.1 | 20.0 | 24.3 | 70 |
| Labeo boggut | 28.6 | 25.7 | 18.6 | 27.1 | 70 |
| Pethia ticto | 18.6 | 27.1 | 22.9 | 31.4 | 70 |
| Anguilla bengalensis | 27.1 | 24.3 | 22.9 | 25.7 | 70 |
| Macrognathus pancalus | 25.7 | 25.7 | 28.6 | 20.0 | 70 |
A – Adenine. G -Guanine, T-Thymine, C-Cytosine
Figure 3: The evolutionary history was inferred by using the Maximum Likelihood method and Kimura 2-parameter model.
The percentage of trees in which the associated taxa clustered together is shown next to the branches.
This analysis involved nucleotide sequences of the Cyprinidae family using MEGA11.
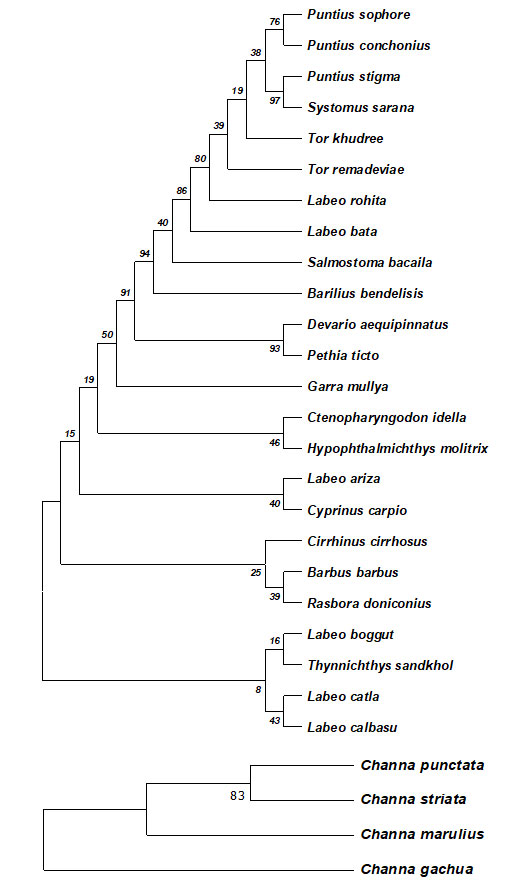
The evolutionary history was inferred by using the Maximum Likelihood method and Kimura 2-parameter model. The percentage of trees in which the associated taxa clustered together is shown next to the branches. This analysis involved nucleotide sequences of the Channidae family using MEGA11.
Figure 4: The evolutionary history was inferred by using the Maximum Likelihood method and Kimura 2-parameter model.
The percentage of trees in which the associated taxa clustered together is shown next to the branches.
This analysis involved nucleotide sequences of different families using MEGA11.
The primers used in the study were able to target and amplify the COI gene region in all 46 specimens of fish. No insertions and deletions were found in the sequence and upon translation, no stop codons were detected. This supports the hypothesis that mitochondrial COI sequence can be used as a standard region for identifying animal species (Hajibabaei et al. 2007b).
Fishes like Tor khudree and Tor remadevii which are recorded from the Gadga river and Tapi river of the Melghat landscape respectively are highly significant fishes ecologically and demanded by locals due to their taste falling under the Critically Endangered and Vulnerable category of IUCN red-list had been identified at the molecular level for the first time in the Amravati district which will help the respective management authority to take actions for their conservations.
In terms of average genetic distances within various taxonomic levels, an increasing pattern was observed as the taxa became less exclusive. In which Systomus sarana was recorded for the first time in the Melghat landscape. 18 fishes shown with asterisk marks are newly reported for the Amravati district as compared to the previous record done by (Wankhade, 2015) which too based on molecular evidence (table 2). several species like Barbus barbus, Barilius bendelisis, Cirrhinus cirrhosus, Devario aequipinnatus make new records for the Amravati district. Some species like Barilius bendelisis, Rasbora doniconius, Thynnichthys sandkhol, Devario aequipinnatus, Tor remadevii (VU), Anguilla bengalensis (NT), Tor khudree(CR) come under the red-list of IUCN category.
All the fishes mentioned in (Table 2) are barcoded and this has been the first attempt for the fish fauna in the Amravati district including Melghat. Earlier the work done by (Yadav 2005; Wagh et.al., 2008; Wankhade, 2015) was only based on the classical level. Table 3 provides the nucleotide composition which infers that there is variation in the nucleotide composition and hence gives evidence that fishes are different from one another at the genetic level. The decline in the number of native fish species in the Amravati district including the Melghat landscape and the changing species composition over time due to the changes in the ecological factors in the rivers call for strict enforcement of regulatory measures that will protect the native fish species found in the rivers.
CONCLUSION
In this study, DNA barcoding using the mitochondrial COI gene was successful in discriminating 46 species of fish in the Amravati district including the Melghat region. Furthermore, DNA barcoding has advanced the study of the river’s ichthyofauna by providing new taxonomic information at the molecular level as well as identifying previously unreported species. Effective management of the Amravati district native fish populations, which have been in decline both in abundance and diversity due to anthropogenic disturbances and increasing use of the rivers for fisheries. Finally, the COI sequences submitted to BOLD and GenBank can aid others in accurate species identification once these are made publicly available. Additional specimens of those species with very few vouchers should be collected further to assess better the uniqueness of the barcode sequence of each species.
ACKNOWLEDGMENT
The authors sincerely appreciate the University Grant Commission (UGC)’s financing and essential support, which enabled them to conduct research. They are thankful to the Principal of Shri Shivaji Science College Dr. G.V.Korpe and Department of Zoology for the laboratory facilities provided. They are thankful to the Barcoding Biosciences laboratory, Bangalore for the laboratory facility provided for molecular analysis of samples. Also grateful to Kamlesh Wadhokar, Arati Kolhe, and Swara Wadhokar for their assistance during fieldwork.
REFERENCES
Ardura, A., Planes, S., & Garcia-Vazquez, E. (2013). Applications of DNA barcoding to fish landings: authentication and diversity assessment. ZooKeys, (365), 49.
Decru, E., Moelants, T., De Gelas, K., Vreven, E., Verheyen, E., & Snoeks, J. (2016). Taxonomic challenges in freshwater fishes: A mismatch between morphology and DNA barcoding in fish of the north‐eastern part of the Congo basin. Molecular Ecology Resources, 16(1), 342-352.
Editor – Director, (2005). Fauna of Melghat Tiger Reserve, Conservation Area Series, 24 : 1 –500 + 8pp plates (Published by the Director, Zool. Surv. India, Kolkata) Published: September 2005; ISBN 81 – 8171 –080 –0
Hubert, N., Hanner, R., Holm, E., Mandrak, N. E., Taylor, E., Burridge, M., … & Bernatchez, L. (2008). Identifying Canadian freshwater fishes through DNA barcodes. PLoS one, 3(6), e2490.
Iswarya Deepti, V., Kandula, S., & Khedkar, G. D. (2018). DNA barcoding of five species of groupers (Pisces: Serranidae) off Visakhapatnam, central-eastern coast of India. Mitochondrial DNA Part A, 29(5), 659-663.
Jun-Bin Zhang, Robert Hanner, DNA barcoding is a useful tool for the identification of marine fishes from Japan, Biochemical Systematics and Ecology, Volume 39, Issue 1, 2011, Pages 31-42, ISSN0305-1978,https://doi.org/10.1016/j.bse.2010.12.017. (https://www.sciencedirect.com/science/article/pii/S0305197810002292)
Krishna, P. V., Madhusudhana Rao, K., & Srinivasa Rao, D. (2012). Identification of selected estuarine fishes by DNA barcoding from river Krishna region, Andhra Pradesh, India. Int JR Pharm Bio Sci, 3(3), 1044-1049.
Lakra, W. S., Singh, M., Goswami, M., Gopalakrishnan, A., Lal, K. K., Mohindra, V., … & Ayyappan, S. (2016). DNA barcoding Indian freshwater fishes. Mitochondrial DNA Part A, 27(6), 4510-4517. Ko, H. L., Wang, Y. T., Chiu, T. S., Lee, M. A., Leu, M. Y., Chang, K. Z., … & Shao, K. T. (2013). Evaluating the accuracy of morphological identification of larval fishes by applying DNA barcoding. PLoS One, 8(1), e53451.
Mohanty, M., Jayasankar, P., Sahoo, L., & Das, P. (2015). A comparative study of COI and 16 S rRNA genes for DNA barcoding of cultivable carps in India. Mitochondrial DNA, 26(1), 79-87.
Persis, M., Chandra Sekhar Reddy, A., Rao, L. M., Khedkar, G. D., Ravinder, K., & Nasruddin, K. (2009). COI (cytochrome oxidase-I) sequence-based studies of Carangid fishes from Kakinada coast, India. Molecular Biology Reports, 36, 1733-1740.
Persis, M., Chandra Sekhar Reddy, A., Rao, L. M., Khedkar, G. D., Ravinder, K., & Nasruddin, K. (2009). COI (cytochrome oxidase-I) sequence-based studies of Carangid fishes from Kakinada coast, India. Molecular Biology Reports, 36, 1733-1740.
Rabaoui, L., Yacoubi, L., Sanna, D., Casu, M., Scarpa, F., Lin, Y. J., … & Qurban, M. A. (2019). DNA barcoding of marine fishes from Saudi Arabian waters of the Gulf. Journal of Fish Biology, 95(5), 1286-1297.
Sadguru, P. (2021), Present Status of Fish Diversity of Davipatan Division of Uttar Pradesh, India.International Journal of Zoological Investigations,7(2),629–636. https://doi.org/10.33745/ijzi.2021.v07i02.047.
Trivedi, S, Affan, R., Alessa, A. H. A., Ansari, A. A., Dhar, B., Mahadani, P., & Ghosh, S. K. (2014). DNA barcoding of Red Sea fishes from Saudi Arabia–the first approach. DNA Barcodes, 2(1), 17-20.
Ward, R. D., Zemlak, T. S., Innes, B. H., Last, P. R., & Hebert, P. D. (2005). DNA barcoding Australia’s fish species. Philosophical Transactions of the Royal Society B: Biological Sciences, 360(1462), 1847-1857.
Wagh, G A, Khawale, N (2008), Morphometric and Biodiversity of Fishes, Amphibians, and Reptiles in Salbardi region near Morshi. (2008), Morphometric and Biodiversity of Fishes, Amphibians and Reptiles in Salbardi region near Morshi.
Wankhade, V R (2015), Ichthyological fauna of the Amravati District, (M.S), India. Science Park Research Journal. ISSN 2321–8045

