1Research Scholar, Rayalaseema University, Kurnool, India
2Dr. Bidlan’s Research Institute, Hyderabad, India
Corresponding author Email: madhu.saghee@gmail.com
Article Publishing History
Received: 10/10/2017
Accepted After Revision: 19/12/2017
Organochlorine pesticides are ubiquitous group of recalcitrant molecules that accumulate in food chains and have inherent toxic effects and adverse health effects. To circumvent the problem, microbial communities are found to be promising candidates for degrading the organochlorine pesticide’s and removal of residues. In this study, a novel microbial consortium isolated from Yamuna and Godavari rivers capable of simultaneous biodegradation of organochlorine pesticides (DDT and Lindane) was subjected to metagenomic sequencing. This consortia used was enriched by progressively increasing concentrations of Lindane and DDT (organochlorine pesticides) for months till a stable Lindane and DDT tolerant population was established, and found to be degrading mixture of organochlorine pesticides with concentrations up to 30 ppm of DDT and Lindane. Currently, in the realm of our knowledge very few metagenomic analysis were carried out to characterize the consortia and understand the biodiversity of microbial communities in the riverine ecosystems, that was found to be unique and highly efficient in bio-degradation of organochlorine pesticides. The study concluded biodiversity with a shannon alpha-diversity index of 3.0317 and identified 871 species with Brevundimonas diminuta (previously assigned to the genus Pseudomanas) having abundance ratio of 17.57 % followed by Stenotrophomonas acidaminiphila in the mixed consortium and deciphered the systematic and functional contexts within riverine metagenome.
Microbial Consortium, Bioremediation, Dichlorodiphenyltrichloroethane, Hexachlorocyclohexane, Lindane, Metagenomics, Amplicon, Illumina
Raju S. M, Bidlan R. 16S Metagenomic Analysis and Taxonomic Distribution of Enriched Microbial Consortia Capable of Simultaneous Biodegradation of Organochlorinesby Illumina Platform. Biosc.Biotech.Res.Comm. 2017;10(4).
Raju S. M, Bidlan R. 16S Metagenomic Analysis and Taxonomic Distribution of Enriched Microbial Consortia Capable of Simultaneous Biodegradation of Organochlorinesby Illumina Platform. Biosc.Biotech.Res.Comm. 2017;10(4). Available from: https://bit.ly/2R4TJ6v
Introduction
Organochlorine pesticides (OCPs) were excessively used globally for pest control and agricultural purposes and public health control (Aktar et al., 2009). OCPs are ubiquitous group of recalcitrant molecules that degrade slowly and accumulate through food chains (Amrita
et al., 2007) and produce a significant magnification at each tropic level. One of the major sinks for persistent organic pollutants discharged into environment is the water ecosystem i.e. rivers and lake beds. Organochlorine pesticides were detected in rivers where higher concentrations of Lindane, Endosulfan and DDT were found (Pandey
et al., 2011)and the residue presence was even detected in drinking and bottled water (Mutiyar et al., 2011). It is highly essential and vital to remove these pollutants from the environment, from the sinks primarily water and soil ecosystems to finally eliminate their residues. Microorganisms are found to be potential degraders of organochlorine compounds, notably water and soil habitants belonging to genera Bacillus, Pseudomonas, Arthrobacter, Klebsiella, Acinetobacter, Alcaligenes, Flavobacterium and Micrococcus were found to be effective bio-degraders (Kafilzadeh et al., 2014 Eric et al 2017).
In this paper, we present the findings of metagenomic analysis leveraging next-generation sequencing (NGS) performed using Hiseq 2500 system (Kumar et al., 2015). The Metagenomics was carried on the defined microbial consortium identified from water ecosystems, Yamuna River (North India) and Godavari River (South India) capable of simultaneous degradation of organochlorine pesticides (Bidlan, 2003). The taxonomic distribution and biodiversity among the microbial consortium was established that comprised of interacting microbial populations (Oulas A et al., 2015 Eric et al., 2017 ).
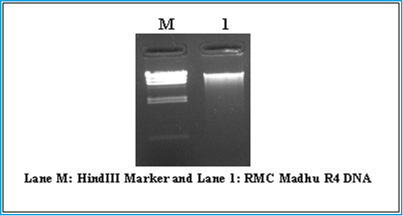 |
Figure 1: QC of gDNA on 0.8% agarose gel |
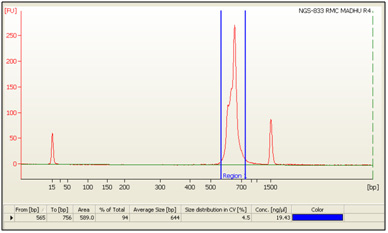 |
Figure 2: Bioanalyzer profile of the Consortium on DNA 1000 chip. |
Materials and Methods
Lindane ã-HCH (insecticidal isomer) was of 97% purity and obtained from Sigma- Aldrich, USA. DDT, 99.4% pure, was donated by Hindustan Insecticides Ltd, India. All other chemicals and reagents used in the study were of analytical grade and were purchased from standard manufacturers. The microbial consortium subjected to Metagenomic analysis was isolated from Yamuna (North India) and Godavari rivers (South India) and enriched by progressively increasing concentrations of Lindane and DDT (organochlorine pesticides) for months till a stable Lindane and DDT tolerant population was established in the flask (Bidlan 2003). DNA was isolated using Xcelgen Bacterial gDNA kit and quality of gDNA was checked on 0.8 % agarose gel (loaded 5 μl) for the single intact band. The gel was run at 110 V for 30 min. 1 µl of each sample was loaded in Nanodrop 8000 for determining A260/280 ratio. The DNA was quantified using QubitdsDNA HS Assay kit (Life Tech). 1 µl of each sample was used for determining concentration using Qubit® 2.0 Fluorometer (Ogata et al., 1990).
| Table 1: Primers used in the Study | |||
| Oligo Name | Oligo Sequence (5’ to 3’) | Length of primer | Product size (Approx.) |
| Prokaryote
V3-Forward |
CCTACGGGNBGCASCAG
|
17 | ~ 460 bps |
| Prokaryote
V4-Reverse |
GACTACNVGGGTATCTAATCC
|
21 | |
| Table 2: Relative Abundance of the genus in the consortium | |
| Taxonomy (Genus) | Abundance |
| Brevundimonas | 17.60% |
| Enterococcus | 8.50% |
| Leucobacter | 3.90% |
| Lysinibacillus | 2.90% |
| Alcaligenes | 1.40% |
The amplicon library was prepared using Nextera XT Index Kit (Illuminainc) as per the 16S Metagenomic Sequencing Library preparation (Eric J. et al., 2017). Primers for the amplification of the V3-V4 hyper-variable region of 16S rDNA gene of bacteria and Archaea are used for this study
(Table-1).
The amplicons with the Illumina adaptors were amplified by using i5 and i7 primers that add multiplexing index sequences as well as common adapters required for cluster generation (P5 and P7) as per the standard Illumina requirements (Esling et al., 2015). The amplicon libraries were purified by 1X AMpureXP beads and checked on Agilent High Sensitivity (HS) chip on Bioanalyzer 2100 and quantified on fluorometer by QubitdsDNA HS Assay kit (Life Technologies).
| Table 3: Alpha-diversity | |||
| Sample | shannon | Observed species | chao1 |
| Consortiaenriched with pesticides | 3.0317 | 871 | 871 |
After obtaining the Qubit concentration for the library and the mean peak size from Bioanalyser profile, library was loaded onto HiSeq 2500 at appropriate concentration (10-20 pM) for cluster generation and sequencing (Sharpton, 2014). Paired-End sequencing allows the template fragments to be sequenced in both the forward and reverse directions. Kit reagents were used in binding of samples to complementary adapter oligos on flow cell. The adapters were designed to allow selective cleavage of the forward strands after re-synthesis of the reverse strand during sequencing. The copied reverse strand was then used to sequence from the opposite end of the fragments (Blomquist et al., 2013).
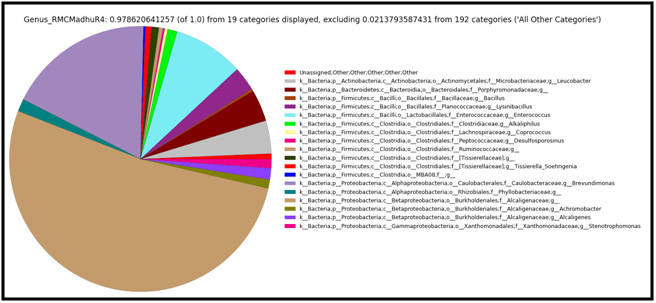 |
Figure 3: Taxonomic distribution of defined consortium at genus level showing the relative abundance of each genus within microbial community. |
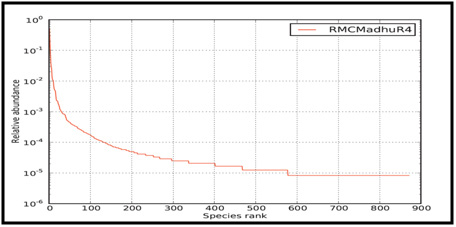 |
Figure 4: Rank abundance plot of Microbial Consortium |
The libraries were prepared from sample after amplifying the V3-V4 region of the 16S segment. Size of library was 644 bp and the library was sequenced using the Illumina sequencing chemistry to generate ~150 Mb of data per sample. The next generation sequencing (NGS) for the sample was performed on the Illumina platform, HiSeq 2500 (Kumar et al., 2015).
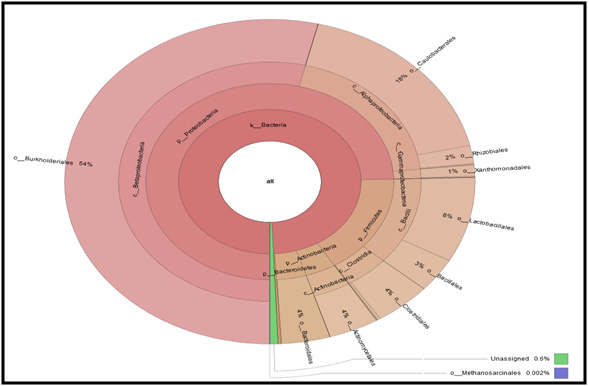 |
Figure 6: Krona graph for taxonomy assignment for Microbial Consortium at order level |
Paired end sequence stitching was carried out for sample using FLASH (Fast Length Adjustment of Short reads) with parameter minimum overlap of 10 bases to merge paired-end reads from next-generation sequencing experiments (Tanja et al., 2011). QIIME (Quantitative Insight into Microbial Ecology) was used for analyzing 16S metagenome data from NGS platforms and, is implemented in python language (Kuczynski et al., 2011). Chimeras composed of DNA from two or more microbial species which are artifacts made during the PCR process. They were filtered first, using usearch61 algorithm (de novo, abundance-based), from the Flashed/stitched data then taken for analysis. A total of 2,44,283 non chimeric sequences from sample were used for OTU pick.In the next step, the similar sequences were clustered, i.e., sequences coming from the same genus, together into one representative taxonomic unit called as Operational Taxonomic Unit (OTU). The basis of this sequence clustering is 97% sequence similarity and implemented through UCLUST algorithm. OTU-picking identified highly similar sequences across the samples and provided a platform for comparisons of community structure. All the sequences from all the samples were clustered into Operational Taxonomic Units (OTUs) based on their sequence similarity.
A representative sequence was selected for each of these OTU’s picked. As these OTU’s made up of a group of sequences, they were represented through one sequence to assign a taxonomic name to the group. Thus representative set of OTUs were prepared which consist of 2,911 sequences. With representative sequence in hand, the taxonomic names to these sequences were assigned at 90% sequence similarity. This is done using UCLUST algorithm, where query is representative sequences and subjects that are curated sequences at greengenes database.
| Table 4: Organisms Identified through Metagenomic Characterization by Hiseq2500, Illumina Platform, NGS | |
| Total Reads | 5,88,408 |
| Total number of stitched reads | 2,81,957 |
| Number of OTUs | 2,911 |
| Abundant phylum | Proteobacteria |
| Abundant class | Betaproteobacteria |
| Abundant order | Burkholderiales |
| Abundant family | Alcaligenaceae |
| Abundant genus | Brevundimonas |
| Abundant species | dimunita |
| shannon alpha-diversity | 3.0317 |
| Observed species | 871 |
Results and Discussion
Diversity calculation for each sample was performed and compared the types of communities, using the taxonomic assignments.
Diversity
á-Diversity or within-sample diversity is calculated using an OTU table which gives idea about species richness. Alpha diversity summarizes the diversity of organisms in a sample using different metrics in a habitat/sample. The below table summarizes the á-Diversity, where the columns correspond to alpha diversity metrics and the rows correspond to samples and their calculated diversity measurements (Lozupone, Catherine
et al., 2007).
The rank abundance curve representing species richness and species evenness is shown in Figure 4. Species richness can be viewed as the number of different species on the chart and species evenness is derived from the slope of the line that fits the graph.
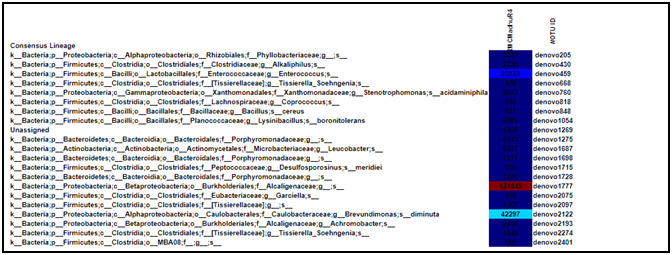
The OTU table was developed to visualise as a heatmap where each row corresponds to an OTU and each column corresponds to a sample. The higher the relative abundance of an OTU in a sample, the more intense the color at the corresponding position in the
heatmap.
Krona graph tool was used to display abundance and hierarchy simultaneously using a radial space-filling display. The Krona chart features a red-green colour gradient signifying average value within each taxon (Ondov et al., 2011)
Conclusion
The metagenomic sequencing comprehensively sampled all genes in all organisms present in microbial consortia and evaluated bacterial diversity and abundance of microbes (Table-4). This study also identified at genotypic level any unculturable microorganisms that are otherwise difficult or impossible to analyze (Handelsman J. et al., 2004). The study concluded biodiversity with a shannon alpha-diversity of 3.0317 and identified 871 species genotypically, with Brevundimonas diminuta having abundance ratio of 17.57 % followed by Stenotrophomonas acidaminiphila in the mixed consortium. This consortia characterized was found to be degrading mixture of organochlorine pesticides with concentrations up to 30 ppm of DDT and Lindane confirmed by GC-MS/MS. Although research has been carried out using on single strain and single compound of organochlorines, the current study data provides an insight on how bacterial communities in mixed consortia are taxonomically distributed and their biodiversity. The metagenomic characterization identified the consortia in a definitive manner which acts as promising solution for bioremediation of organochlorine mixtures.
NCBI Sequence Accession Number
DNA sequences obtained have been deposited at National Center for Biotechnology Information (NCBI) Sequence Read Archive under the bioproject ID PRJNA420925 and accession codeSRX348847.
Acknowledgements
The authors would like to acknowledge the support of Xcelris Labs for extending support, wherever required during the research and Rayalaseema University and UGC for support and encouragement for the research studies.
References
- AkhtarMW, Dwaipayan Sengupta, and Ashim Chowdhury, 2009 Impact of pesticides use in agriculture: their benefits and hazards, Interdisciplinary Toxicology, 2(1) pp.1–12.
- Amrita Malik, Kunwar P. Singh, Priyanka Ojha, 2007 Residues of Organochlorine Pesticides in Fish from theGomti River, India, Bulletin of Environmental Contamination and Toxicology, Volume 78, Number 5, Page 335
- Bidlan R. 2003 Studies on DDT degradation by Bacterial strains. In: Isolation, purification and identification of microbes capable of DDT- degradation. Ph.D. thesis, University of Mysore, India.pp 90-142. 2003.
- Bidlan R. and Manonmani H.K., 2004 Aerobic degradation of dichlorodiphenyltrichloroethane (DDT) by Serratiamarcescens DT-1P.Process Biochemistry,38, pp.49-56.
- Blomquist TM, Crawford EL, Lovett JL, Yeo J, Stanoszek LM. (2013) Correction: Targeted RNA Sequencing with Competitive Multiplex-PCR Amplicon Libraries. PLOS ONE 8(12): 10.
1371 - Eric J. de Muinck,Pål Trosvik, Gregor D. Gilfillan, Johannes R. Hov and Arvind Y. M. Sundaram 2017 A novel ultra-high-throughput 16S rRNA gene amplicon sequencing library preparation method for the Illumina HiSeq platform, Microbiome 5:68 https://doi.org/10.1186/s40168-017-
0279-1 - Garza DR, Dutilh BE 2015 From cultured to uncultured genome sequences: metagenomics and modeling microbial ecosystems. Cellular and Molecular Life Sciences. 72:4287-4308. doi:10.1007/s00018-015-2004-1.
- Handelsman J. 2004 Metagenomics: Application of Genomics to Uncultured Microorganisms. Microbiology and Molecular Biology Reviews. 68(4):669-685. doi:10.1128/MMBR.68.4.669-685.2004.
- Kafilzadeh F, Ebrahimnezhad M, Tahery Y. 2015 Isolation and Identification of Endosulfan-Degrading Bacteria and Evaluation of Their Bioremediation in Kor River, Iran.Osong Public Health and Research Perspectives. 6(1):39-46. doi:10.1016/j.phrp.2014.12.003.
- Kuczynski J, Stombaugh J, Walters WA, González A, Caporaso JG, Knight R. 2011 Using QIIME to analyze 16S rRNA gene sequences from Microbial Communities.Current protocols in bioinformatics / editoral board, Andreas D Baxevanis CHAPTER:Unit10.7. doi:10.1002/0471250953.bi1007s36.
- Kumar S, Krishnani KK, Bhushan B, Brahmane MP. 2015 Metagenomics: Retrospect and Prospects in High Throughput Age. Biotechnology Research International. 2015:121735. doi:10.1155/2015/121735.
- Lozupone, Catherine et al. 2007 Quantitative and qualitative beta diversity measures lead to different insights into factors that structure microbial communities. Applied and environmental microbiology 73 5 1576-85.
- Mutiyar, PK A. K. Mittal and A. Pekdeger 2011 Status of organochlorine pesticides in the drinking water well-field located in the Delhi region of the flood plains of river Yamuna, Drink. Water Eng. Sci., 4, pp.51–60.
- Ogata, M., Mattern, R., Schneider, P.M. et al. Z Rechtsmed (1990) 103: 397. https://doi.org/10.1007/BF01263148
- Ondov, B.D., Bergman, N.H. & Phillippy, A.M. 2011 BMC Bioinformatics 12: 385. https://doi.org/10.1186/1471-2105-12-385
- Oulas A, Pavloudi C, Polymenakou P. 2015 Metagenomics: Tools and Insights for Analyzing Next-Generation Sequencing Data Derived from Biodiversity Studies. Bioinformatics and Biology Insights. 9:75-88. doi:10.4137/BBI.S12462.
- Pandey, P P. S. Khillare, Krishan Kumar 2011 Assessment of Organochlorine Pesticide Residues in the Surface Sediments of River Yamuna in Delhi, India, Journal of Environmental Protection 2, 511-524
- Philippe Esling, Franck Lejzerowicz, Jan Pawlowski 2015 Accurate multiplexing and filtering for high-throughput amplicon-sequencing, Nucleic Acids Research, Volume 43, Issue 5, 11 March 2015, Pages 2513–2524, https://doi.org/10.1093/nar/gkv107
- Sharpton TJ. 2014 An introduction to the analysis of shotgun metagenomic data.Frontiers in Plant Science. 5:209. doi:10.3389/fpls.2014.00209.
- Tanja Mago, Steven L. Salzberg 2011 FLASH: fast length adjustment of short reads to improve genome assemblies, Bioinformatics, Volume 27, Issue 21, 1 November 2011, Pages 2957–2963, https://doi.org/10.1093/bioinformatics/btr507

