Department of Computer Sciences, King Saud University Riyadh Saudi Arabia
Corresponding author Email: dalsaeed@ksu.edu.sa
Article Publishing History
Received: 15/04/2019
Accepted After Revision: 25/06/2019
Melanoma is the most dangerous of skin cancer types and causes the most deaths. This paper aimed to provide a usable Computer Aided Diagnosis (CAD) system that helps dermatologist in the diagnosis of skin cancer. The proposed CAD system called Skin Cancer Computer Aided Diagnosis support system (SCCAD) consisted of six components, namely; image acquisition, image pre-processing, segmentation, features extraction, image classification and viewing result. Image pre-processing is achieved by various pre-processing approaches. Image segmentation is based on Otsu’s threshold method. The extracted features were texture, color, and shape. These features became the input to the Support Vector Machine (SVM) classifier to classify the lesions as melanoma or non-melanoma. We obtained the dermoscopic images from the PH² and the digital image archive of the Department of Dermatology of the University Medical Center Groningen (UMCG) databases. We evaluated the performance of the classification model by using 10-Fold cross-validation and the confusion matrix. In addition, we compared between the SVM and ensemble classifier. The accuracy values of SVM and ensemble are 92.6%, 91.1% respectively. In addition, we evaluated the usability of the CAD system by informal study with Human Computer Interface (HCI) experts.
Computer Aided Diagnosis (CAD) system; Features extraction; Machine Learning; Support Vector Machine (SVM).
Alamri A, Alsaeed D. On the Development of a Skin Cancer Computer Aided Diagnosis System Using Support Vector Machine. Biosc.Biotech.Res.Comm. 2019;12(2).
Alamri A, Alsaeed D. On the Development of a Skin Cancer Computer Aided Diagnosis System Using Support Vector Machine. Biosc.Biotech.Res.Comm. 2019;12(2). Available from: https://bit.ly/30fwQ3k
Copyright © Alamri and Alsaeed, This is an open access article distributed under the terms of the Creative Commons Attribution License (CC-BY) https://creativecommns.org/licenses/by/4.0/, which permits unrestricted use distribution and reproduction in any medium, provide the original author and source are credited.
Introduction
Skin cancer is “the uncontrolled growth of abnormal skin cells”. It’s classified into melanoma and non-melanoma. Non- melanoma is more common than melanoma and is divided into Basal Cell Cancer (BCC) and Squamous Cell cancer (SCC). Melanoma is the most dangerous type of skin cancer (Skin Cancer Foundation). Most skin cancers are caused by exposure to ultraviolet radiations because ultraviolet light damages the DNA in the human skin (National Cancer Institute, 2010).According to the World Health Organization (WHO), 132,000 new cases of melanoma and between 2 and 3 million non-melanoma are diagnosed globally each year (World Health Organization). Skin cancer is the most prevalent form of cancer in the US. Recent estimates are that 9,730 of American’s (6,380 male, 3,350 female) will die from skin cancer over the course of 2017, and the number of cases has doubled in the past 30 years. Statistically, every hour, one person in the US dies from melanoma (American Cancer Society, 2017).
Studies showed that if the skin cancer was detected early it is almost a curable disease (WorldHealthOrganization). It can be diagnosed physically by examining the area, size, shape, color, and texture of suspicious spot, or performing a biopsy and examine it under the microscope (CancerTreatment Cancers Of America). The application of computational intelligence methods provides better and more reliable diagnoses. Developing CAD system helps in the diagnosis of skin cancer from images by finding the location of a lesion and estimating the probability of disease (Masood and Al-Jumaily, 2013).The usage of ML in the medical imaging field has rapidly increased, using Computer Aided diagnosis (CAD), due to the complexity of representing objects accurately; such as lesions, and organs by using simple equations or models (Suzuki, 2017). Furthermore, one of the most important usages of ML in medical imaging is to classify objects (e.g., cancer or non-cancers), it plays an important role as an aid in diagnosing skin cancer. In this paper we propose a CAD system that helps dermatologist in the diagnosis of skin cancer using image processing and ML classification algorithms.
Related Work
Previous studies show that there are several classifiers used to classify skin cancer images. Some of the most used classifiers are: Support Vector Machines (SVM), Neural Networks (NN), K Nearest Neighbors (KNN), AdaBoost, and decision trees (C4.5 and CART).The features extracted from skin cancer images are divided into three categories: texture, color, and shape. Each of these can be extracted using different algorithms. Combinations of features offers greater advantages (Thomas 2014). These extracted features are used as the input to the classifier. Moreover, the classifier will obtain more accurate results if the features are well extracted (Antony et al., 2016). In the following subsections we will discuss some previous studies based on the type of classifier.
Support Vector Machines (SVM): The SVM classifier uses hyper-planes to determine boundaries of separation between data of different classes (RAY, 2015). There are several studies (Maurya et al., 2015, Almaraz-Damian et al., 2016, Ansari and Sarode 2017, Filali et al., 2017) in which texture features were extracted by using Gray Level Co-occurrence Matrix (GLCM) as an input to the classifier. Maurya et al. (2015) provided an automated system for the detection and classification of skin cancer of four classes: Melanoma, Basal cell carcinoma, Actinic Keratosis, and Squamous cell carcinoma. The features they extracted with using GLCM method are autocorrelation, contrast, energy, entropy, and homogeneity. Thus, these features were used as the inputs to the multi-SVM classifier. The proposed system obtained result with an accuracy of 81.43 %. Almaraz-Damian et al. ( 2016) proposed another method based on the features of shape, color, and texture. “Shape” was based on the ABCD rule, “color” obtained by applying Non-Linear Diffusion and k-means methods, and “texture” feature by GLCM. Researchers classified images as malignant (cancerous) or benign (noncancerous) by using the SVM and discovered that the performance of the proposed system yielded a 75.1 % accuracy. Ansari and Sarode (2017) proposed a skin cancer detection system based on SVM and using GLCM methodology to extract texture features. They concluded that the usage of SVM and GLCM was easy and yielded a high degree of accuracy. Filali et al. ( 2017)
suggested a new approach for the automatic segmentation and classification of skin lesions. K-means was one such algorithm they used in the segmentation process. They extracted texture features by using GLCM and noted them as energy, contrast, correlation, homogeneity, and entropy. The researchers also used SVM as a classifier and found that the proposed approach provided a good segmentation and an average accuracy of 83 %.
Some other studies (Almansour and Jaffar, 2016, Manerkar et al., 2016) have extracted the texture features using GLCM with some different algorithms. Almansour and Jaffar ( 2016) used SVM to classify images of skin cancer as “melanoma” and “non-melanoma”. They extracted the texture features in two ways: Local Binary Pattern (LBP) on different scales and GLCM. In addition, they extracted color features using four statistics called “color moments”: Mean, standard deviation, variation and skewness. They measured the performance of the classifier by its accuracy, sensitivity and specificity. They learned that their proposed method was better than the other compared methods. Another system proposed by Manerkar et al. (Manerkar et al., 2016), applied multi SVM classifiers to the classification of multiple classes of skin cancer. This study employed GLCM and Image Quality Assessment (IQA) methods to extract texture features. As result, the overall accuracy of this proposed system ranged from 96 % to 98 %.
Furthermore, the ABCD rule of melanoma has been favored by some researchers (Gautam and Ahmed, 2015, Mete et al., 2016) to represent features of images. Gautam and Ahmed (2015) proposed a Decision Support System to analyze the degree of risk exhibited in a sample. The system classified images as “malignant” or “benign” by using SVM and they optimized these results by using Sequential Minimal Optimization (SOM). They applied the ABCD rule to extract the features and concluded that SVM is an effective method of classifying skin cancer images. Mete et al. ( 2016) proposed a novel system to classify skin cancer images in three classes: Melanoma, Dysplastic Nevus, and Benign. The proposed system contained two layers of scrutiny. They first used three SVM Binary classifiers: Melanoma or Benign, Melanoma or Dysplastic Nevus, Dysplastic Nevus or Benign. The second layer worked in a decision-maker role to map lesions to classes based on the outcomes that were obtained from the first layer. They extracted features from the images according to the ABCD rule and which were optimal for SVM. They discovered that their system provided an F-measure accuracy of 85 %.
Neural Network (NN): Neural networks have the ability to solve highly complex problems (Jaleel et al., 2013). There are several types of neural network that used by researchers with featuring different extraction techniques; such as back propagation neural network (BPNN), feed forward back-propagation neural network, radial basis function neural network (RBFNN), feed forward multi-layer ANN, auto-associative neural network (AANN), and adaptive-network-based fuzzy inference system (ANFIS).In some of the studies (Antony et al., 2016, Jaleel et al., 2013, Suryapraba et al., 2015) the extraction of texture features was done using GLCM and feed as input to different neural network classifiers. Jaleel et al. ( 2013) gave a system to aid the diagnosis of skin images as “cancerous” or “non-cancerous” based on BPNN. The features extracted using GLCM are of contrast, correlation, energy, mean, and homogeneity. The proposed system yielded an accuracy of 82 % and the researchers suggested the use of optimizing techniques such as Particle Swarm Optimization to enhance accuracy still further. Suryapraba et al. ( 2015) proposed an algorithm to enhance diagnosis of melanoma using ANN as classifier. They too extracted texture features from images using GLCM and the proposed algorithm presented highly accurate results. Antony et al. (2016) suggested a method based on ANN. They also used the GLCM method to extract texture features of contrast, correlation, energy, entropy, and homogeneity. They stated that their proposed method classified an image as “cancerous” or “non-cancerous” with an accuracy of 86.66 %.
In some other studies (Singhal and Tiwari, 2015, Sharma and Srivastava, 2016, Arasi et al., 2017) the features were extracted via Discrete Wavelet Transform (DWT). Singhal and Tiwari ( 2015) proposed a method of detection based on ANN. They used a neural network BPNN and RBFNN to extract features using a multi-level 2-D Wavelet Transform. The features extracted included mean, maximum, minimum, median, standard deviation, and variance. They concluded that BPNN was more accurate, simple and effective than RBFNN but that RBFNN was able to train data faster. Another work presented by Sharma and Srivastava (Sharma and Srivastava, 2016) classified skin cancer images as “cancerous” and “non-cancerous” by also applying two types of neural network: BPNN and AANN. They extracted unique features from images using a 2-D Wavelet Transform and discovered that the BPNN achieved an accuracy of 91 % with three hidden layers, while the overall accuracy of AANN was 82.6 %. Recently, Arasi et al. ( 2017) proposed a computational intelligence approaches for melanoma diagnostics using BPNN and ANFIS. ANFIS is the combination of ANN with “fuzzy” systems and has the advantages of both approaches. In the features-extraction process, researchers used DWT before applying Principle Component Analysis (PCA) thereby minimizing the dimensionality of the wavelet transformation data to give a more accurate classification (the feature being represented by the variance of Principal Components (eigenvalue)). Researchers found the BPNN obtained higher accuracy of 98.8% compared with ANFIS (95.18 %).
Other classification techniques: In some other studies, researchers have tried using hybrid classification techniques, combining two classifiers together to gain more accurate results. Others, in their studies, have tested and compared the results of several classifiers. Sumithra et al. (2015), proposed a system for segmentation and classification purposes. In their experiments, they compared the classification results of using SVM, KNN, and a hybrid method using SVM combined with KNN. They found that classifiers in combination achieved better results than those used singularly. Furthermore, using KNN alone provided less accuracy than using SVM. Another work proposed by Farooq et al. (Farooq et al., 2016) developed a framework using both SVM and Neural Classifiers. The results of SVM were shown in three cases: “high risk” (i.e. melanoma), “low risk” (i.e. non-melanoma), or “medium risk” (i.e. indeterminate). The ANN classifier was used to implement further classification of the results obtained from SVM or biopsy tests. Nizar and Kumar (Nizar and Kumar, 2016) proposed a system based on SVM and KNN techniques in order to classify several types of skin cancer. They concluded that SVM achieved greater accuracy than KNN. Another comparative analysis was undertaken by Amirjahan and Sujatha (2016).
They compared three types of classifiers: SVM, C4.5 and Classification and Regression Trees (CART) to predicate the efficiency of each. Their results showed that SVM provided a higher level of accuracy than others. Elgamal ( 2013), used both Feed Forward Back-propagation ANN and K-NN to classify images as “normal” or “abnormal” skin cancer images. He discovered the two proposed classifiers showed robust and effective results. The work done by Barata et al. (2014) had two objectives, one of which was to apply two systems for the classification of skin lesion and compare their results. The systems were global and local. The global system extracted global features (e.g. color moments) and applied SVM, AdaBoost, and KNN classifiers. While the local system was applied to some features that cannot be obtained (e.g. unknown boundary) by selecting a small region of image (Philbin et al., 2007). The other objective of this study was to determine which set of features was more discriminative by comparing color and texture. The study concluded that both systems provided good results in their respective datasets, and that color features performed better than texture when used in isolation. Mhaske and Phalke ( 2013) compared the results of three types of classifiers: KNN, ANN, and SVM. They found that the result obtained from SVM was more accurate than ANN and K-NN, followed by ANN. The least accurate results were obtained from K-NN. Similar work was undertaken by Victor and Ghalib (2017) to detect skin cancer by using KNN, SVM, Decision Tree (DT), and Boosted Tree (BT). Their experiments showed that; SVM again yielded the most accurate results, followed by KNN. The DT classifier was the third most accurate and the BT the least accurate.
Material and Methods
Proposed SCCAD System: The proposed SCCAD system is a computer aided diagnostic support system for segmentation and classification of skin lesions. It also extracts a set of discriminating features from skin lesions for efficient classification. The proposed system allows the dermatologist to upload a skin image for a patient and provides the diagnosis (melanoma or normal). It also provides some extra features for the dermatologist such as, saving images and some patient data if needed. The overview of the proposed SCCAD system is shown in Figure 1 below.
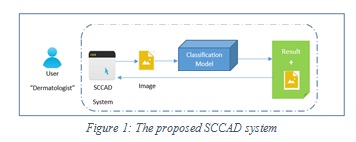 |
Figure 1: The proposed SCCAD system |
As shown in Figure 1, the classifier uses a pre-trained skin cancer classification model, and up to our knowledge there is no such classification model on hand and ready to use, so we developed, trained and tested our own model. In the following subsections we will discuss the developed skin cancer classification model and the design of proposed SCCAD system.
Proposed Skin Cancer Classification Model
The classification model consists of six main components: image acquisition, image preprocessing, segmentation, features extraction, image classification and view result. A general block diagram of the proposed model is illustrated in Figure2.
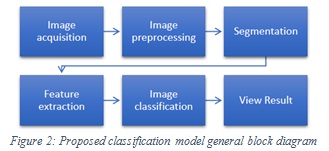 |
Figure 2: Proposed classification model general block diagram |
Image acquisitions: This is the first step, reading the input RGB image. We obtained from images PH² dataset and from MED-NODE .
Image preprocessing: a preprocessing step is important to reduce unwanted distortions and enhance images to increase image quality. In our model, we used the preprocessing techniques proposed by Hoshyar et al. (Philbin et al., 2007), they showed that the most beneficial techniques used in the preprocessing step for skin cancer detection are as follows:
Image enhancement: image enhancement aims to improve the visual appearance of an image. We applied two algorithms: image scaling to resize image to 575*765 pixels and a symmetric image filter to enhance or highlight details of image as showing in the following equations:
Resize Image = imresize (RGB Image, [575,765]);
Where imresize is a MATLAB function that used to specify the size of the output image by passing a vector that contains the number of rows and columns in the output image.
Filter Image = imfilter (Resized Image, ’symmetric’);
Where imfilter is a MATLAB function that used to apply symmetric filter on the image.
Grayscale conversion: a grayscale image consists of brightness information. Grayscale images are faster and easier to process when compared to color images. Moreover, the images processing techniques are applied on the grayscale image (Jayaraman et al., 2009). We converted skin images into grayscale images to use in the segmentation component as showing in the following equation:
Convert Image = rgb2gray (Filtered Image);
Where rgb2gray is a MATLAB function that used to convert RGB image to gray image by removing the hue and saturation information while keeping the luminance.
Image restoration: image restoration defines the process of retrieving a degraded image which has suffered noise or blurring. In the proposed model the wiener filter is used as showing in the following equation. It is a powerful technique used in medical applications to reduce the image noise and blur.
Wiener Filtered Image=wiener2(Gray Image);
Where wiener2 is a MATLAB function that used to apply wiener filter on 2-dimensional image.
Segmentation
This component aims to divide images into multiple segments. This process helps to make the image’s Region of Interest (ROI) easier to evaluate. In the proposed segmentation was done using Otsu thresholding method (Vala and Baxi, 2013). Otsu is one of the best thresholding methods and is widely used due to its effectiveness. We used global image threshold that using Otsu’s method as showing in the following equation:
Level of Thresholding =graythresh (Gray Image);
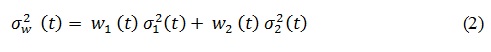
Where graythresh is a MATLAB function that used to computes a global threshold to separate the background from ROI. The basic idea is to find the threshold that minimizing the weighted within-class variance and maximizing between-class variance for separating lesion in an image from the background based on their gray-level distribution. Threshold computed with the following equation: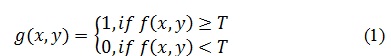
Where 1 means that the pixels corresponding to lesion or object while 0 to background. The weighted within-class variance is computed with the following equation:
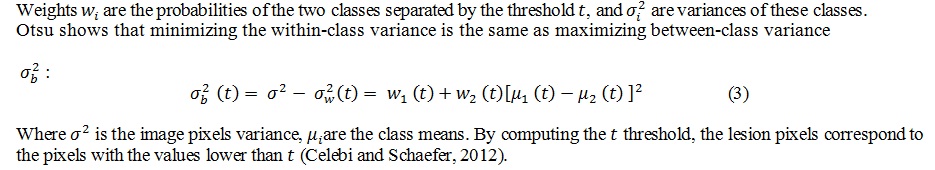
Features extraction: extract relative features from a segmented image to be used by the classifier to identify melanoma. In the proposed model, three types of feature were extracted:
Texture: it describes it describes local brightness variation from pixel to pixel in a small neighborhood of the image (Russ, (1999)). It also refers to the attributes or information representing the spatial arrangement of the gray levels of the pixels in regions of a digital image (IEEE, 1990). The Gray Level Co-occurrence Matrix (GLCM) was used as studies showed that it is the most effective and most cited method for feature extraction. GLCM represent how often different combinations of pixel brightness values (grey-levels) occur in an image. It considers the relationship between two neighboring pixels, the first pixel is known as a reference and the second is known as a neighbor pixel (Almansour and Jaffar, 2016). The four statistical measures extracted from GLCM matrix are: contrast, energy, correlation, and homogeneity. Statistical measures are computed with the following equation:
GLCM=graycomatrix(Gray Image);
Where graycomatrix is MATLAB function that used to create gray-level co-occurrence matrix from image by calculating how often a pixel with the intensity (gray-level) value I occurs in a specific spatial relationship to a pixel with the value j. The co-occurrence matrix P of an image I of size N*N is can be defined as:
Shape : we used the ABCD rule (Asymmetry, Border, Color and Diameter) as it is the main geometric feature that best describes a melanoma lesion (Jain et al., 2015), the ABCD features are as follows:
Asymmetry: to determine the area of the image of the mole. We calculated the asymmetry. Asymmetry Index (in pixels) is computed with the following equation (Hanon AlAsadi and M.Alsafy, 2015):
=Δ∗100 (9)
Where is the area of the total image, Δ is the area of difference between total image and lesion area. For asymmetry increases, the ratio approaches closer to 0, otherwise reach to 1.
Border: the irregularity of the mole border is a feature for melanoma. Irregularity index is a function of area (A) and perimeter (P). it is calculated (in pixels) using the following equation (Hanon AlAsadi and M.Alsafy, 2015) :
= (4)/2 (10)
For the border to be irregular, the value of IR must reaches 0, otherwise 1.
- Color: to determine if the mole is composed of a non-uniform color, we evaluated the color distribution in the skin lesions. The skin lesion contains combination of three or more such as red, dark brown, and light brown; we declared it as melanoma.
- Diameter: the diameter of the mole if greater than 6mm (22.6772 pixels) then it will be considered as melanoma. We calculated the diameter as the distance between each pair of points.
Color: color is one of the important features used as a descriptor to identify melanoma. We extracted four statistics (usually called color moments or color feature) to identify the colors in the segmented lesion regions. These are mean, standard deviation, variation and skewness. We converted RGB image into HSV (Hue, Saturation, Value) and extracted color moments as showing in the following equation:
HSV Image = rgb2hsv (RGB Image);
Where rgb2hsv is a MATLAB function that used to convert RGB image to HSV image.
Image classification
Image classification refers to the process of classifying the input image into one of the two groups: melanoma or non-melanoma based on the extracted features from the image. For building the classification model, two classifiers (SVM and ensemble) were tested and evaluated based on their performance (more details in section 4 Results and Discussion). Recent work on melanoma classification have proven that SVM is one of the most effective classifiers with a high degree of accuracy (Thamilselvan and Sathiaseelan, 2015). Ensemble is also a good classifier and can improve predictive accuracy if used in a hybrid model (Rahman and Tasnim, 2014). Results showed that SVM gave better performance than ensemble, according to that it was used in building the classification model. Based on this result, SVM was also selected as the classifiers to be used in the SCCAD system.
View Result: in this step the result of classifying each image. The two classifiers return results by predictFcn(X) function either 1 for melanoma or 0 for non-melanoma. The features are the input, while the output either 0 or 1.
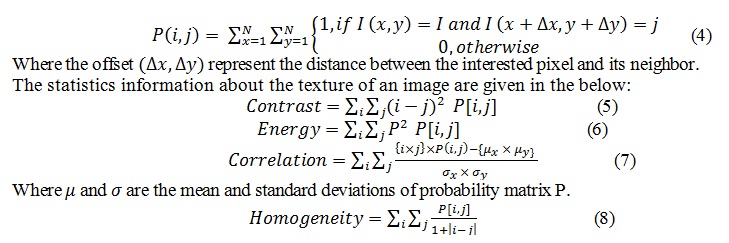
The proposed methodology of discrimination between melanoma or not is shown in Figure 3.
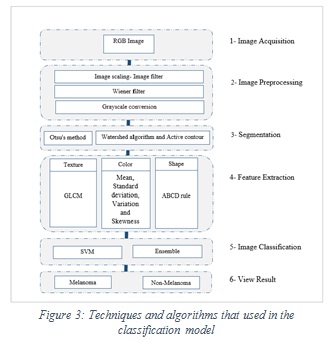 |
Figure 3: Techniques and algorithms that used in the classification model |
Design and structure of proposed SCCAD system
The main components of the proposed SCCAD system are: image acquisition, image preprocessing, segmentation, features extraction, and image classification. The classification component uses the proposed classification model and the extracted features to return the prediction result. Figure 4 shows the architectures of classification model and the SCCAD system. The same process used in building the classification model (Figure 2) is used in the proposed SCCAD system in its components apply the same algorithms used in the proposed classification model which are explained above.
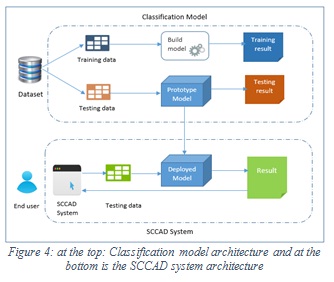 |
Figure 4: at the top: Classification model architecture and at the bottom is the SCCAD system architecture |
Implementation
To develop both the classification model and the SCCAD system, we used MATLAB R2018a, an image processing toolbox, as well as statistics and ML toolboxes.
For developing and testing our proposed classification model and SCCAD system, we used 151 images. The images have been collected from the PH² dataset and from dermatology database used in MED-NODE . PH² dermoscopic images database were obtained from the Dermatology Service of Hospital Pedro Hispano (Matosinhos, Portugal). The PH² database consist of 200 images of melanocytic lesions. 40 of them are melanoma, 80 are common nevi, and 80 are atypical nevi. These are 8-bit RGB color images with a resolution of 768*560 pixels. Furthermore, MED-NODE’s dataset consists of 70 melanoma and 100 nevus images from the digital image archive of the Department of Dermatology of the University Medical Center Groningen (UMCG) used for the development and testing of the MED-NODE system for skin cancer detection from macroscopic images.
In order to have a good accuracy, we tried to balance the number of melanoma and non-melanoma images to be 51% (76) and 49% (75) respectively, equaling (151) as a total. We used 90% (136) of images for training and testing process, and 10% (15) for testing by the end user who uses SCCAD system. To increase the learnability and enhance the accuracy of the model, a preprocessing step for training images is important. One of the preprocessing operations was cropping, (for the images with the black corners) because the segmentation algorithm segment it as lesion based on its darker color and it appeared as a lesion to the segmentation algorithm instead of the correct lesion. Figure 5 shows the segmented image before and after crop with the black corners. For hair removal, we used software called Dull Razor to remove thick hairs manually. Figure 6 shows the image before and after Dull Razor usage.
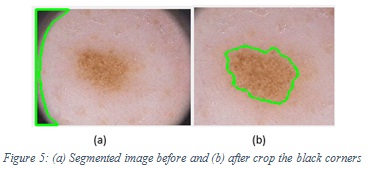 |
Figure 5: (a) Segmented image before and (b) after crop the black corners |
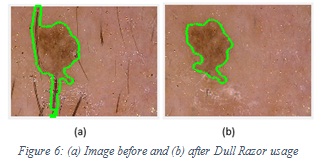 |
Figure 6: (a) Image before and (b) after Dull Razor usage |
Results and Discussion
The proposed system combines two main sub systems: the skin cancer classification model and the SCCAD system itself. To evaluate the performance of the proposed model, we used the K-Fold cross validation and confusion matrix, while for evaluation our proposed SCCAD system by performing informal study with Human Computer Interface (HCI) experts. In the following subsection we will discuss these evaluation processes.
Evaluating the performance of proposed classification model
To measure the quality of our classification model, we used the K-fold cross validation as the evaluation method. We set it to 10-fold cross-validation. In the 10-fold, the dataset randomly partitioned into 10 equal size sub-dataset, one sub-dataset used for testing the model and the remaining 9 sub-datasets used for train the model. The cross-validation process is then repeated 10 times (the folds), with each of the 10 sub-datasets used exactly once as the validation data. The 10 results from the folds can then be averaged (or otherwise combined) to produce a single accuracy. We used cross-validation instead of conventional validation (70% training, 30% testing) because the use of a single dataset for testing may not reflect the true accuracy our model .
After training the model and obtaining the average accuracy, we obtained the confusion matrix, sensitivity, and specificity. The accuracy is best when using all 20 features: texture, color, and shape.
Confusion matrix
The confusion matrix (Agolytics) describes the performance of the classification model and shows the way in which the model is confused when it makes a prediction. The matrix is an N*N matrix, where N=2 is the number of classes that being to predicate. We used the following terminologies:
- True positive (TP): correct classification of melanoma 1.
- True negative (TN): correct classification of non- melanoma 0.
- False positive (FP): incorrect classification as melanoma.
- False negative (FN): incorrect classification as non-melanoma.
Figure 7 shows the confusion matrix of SVM, while Figure 8 shows the confusion matrix of ensemble.
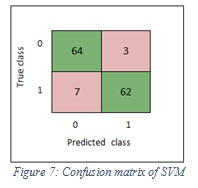 |
Figure 7: Confusion matrix of SVM |
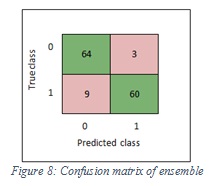 |
Figure 8: Confusion matrix of ensemble |
Accuracy
The overall accuracy is the measure of effectiveness of classification algorithms. It is defined as the overall correct classification of melanoma and non-melanoma images to the total number of images as follows:
Accuracy= (TP+TN)/ (TP+TN+FP+FN)
In other words, the classification accuracy is the ratio of correct predictions to total predictions made.
Accuracy=Correct predication/ total predication *100
The accuracy values of SVM and ensemble are 92.6% and 91.1% respectively.
Sensitivity
The sensitivity (also called the true positive rate, recall) is defined as the correct classification number of melanoma divided by total number of melanoma. The sensitivity of the classification model is defined as follows:
Sensitivity= (TP)/ (TP+FN)
The sensitivity values of SVM and ensemble are 90%, 87% respectively. In the SVM classifier, it means 90% of the images were classified correctly as melanoma and 10% of images were wrongly kept as non-melanoma. Furthermore, in the ensemble, it means 87% of the images were classified correctly as melanoma and 13% of images were wrongly kept as non-melanoma.
Specificity
The specificity (also called the true negative rate) is defined as the correct classification number of non-melanoma divided by total number of non-melanoma. The specificity of the classification model is defined as follows:
Specificity= (TN)/ (TN+FP)
The specificity values of SVM and ensemble are 96% and 96% respectively. In the SVM classifier, it means 96% of the images were classified correctly as non-melanoma and 4% of images were wrongly kept as melanoma. Furthermore, in the ensemble, it means 96% of the images were classified correctly non-melanoma and 4% of images were wrongly kept as melanoma. Figure 9 shows the sensitivity and specificity of SVM, while Figure 10 shows the sensitivity and specificity of ensemble.
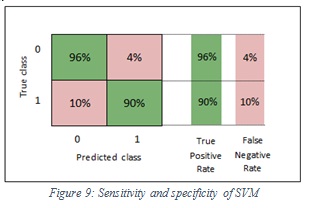 |
Figure 9: Sensitivity and specificity of SVM |
 |
Figure 10: Sensitivity and specificity of ensemble |
As a performance comparison between SVM and ensemble, the SVM is better than the ensemble. So, we applied the SVM classifier in our SCCAD system. Table 1 summarize the differences between them.
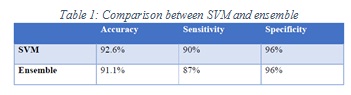 |
Table 1: Comparison between SVM and ensemble |
Evaluating the usability of proposed SCCAD
To evaluate the SCCAD system, two HCI experts have inspected and examined the SCCAD system to identify possible usability problems. Their evaluation leads to important findings and recommendations which ultimately beneficial to the improvement and enhancement of the UI. This study with HCI experts was directed by the main study research questions in Table 2. The main recommendations for the UI were as follows:
- No need to show the values of the extracted features and displaying only the information that beneficial to the dermatologist without unnecessary technical terminology.
- Add at the re-upload image task, they suggest using the same button for upload and re-upload.
- Add an option for saving the system’s status in case of failure or undesirable action.
- These recommendations helped in enhancing the usability of the proposed SCCAD system.
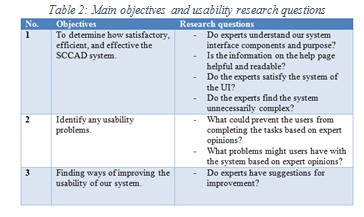 |
Table 2: Main objectives and usability research questions |
Conclusion and Future Work
Skin cancer is a very serious type of cancer diseases and Melanoma is the most dangerous type of skin cancer that may cause death. If early diagnosed, skin cancer can almost be curable. In this paper we proposed a CAD system that helps dermatologist in the diagnosis of skin cancer (melanoma or non-melanoma) using image processing and ML classification algorithms. For this purpose, we developed a classification model and a SCCAD system. We started by building and evaluating the classification model by training and testing two classifiers, SVM and ensemble, and using 20 features of texture, color, and shape. SVM gave better results than ensemble based on the K-fold cross validation with k-10. The next step after developing the classification model was to design, implement and evaluate the SCCAD system which is the main goal in this work. The SCCAD system provided the dermatologists with many features that help the dermatologist in the diagnosis process. The classifier used in SCCAD was SVM according to the results found in the phase of developing classification model. An evaluation by HCI experts was performed to enhance the usability of the SCCAD system and their recommendation were implemented. For future work, hair removal and image cropping techniques can be integrated in the SCCAD system as part of the preprocessing steps. A hybrid model of classification by used to enhance the accuracy of prediction. Improving the classification model is possible by using another dataset to increase the learnability of classification model.
Acknowledgements
The authors would like to acknowledge the support by the “Research Center of the Female Scientific and Medical Colleges”, Deanship of Scientific Research, King Saud University. They also would like to acknowledge the HCI experts, Dr. Shiroq Al-Megren and Dr. Balsam Al-Sugair from King Saud University Riyadh, for their contribution in evaluating the usability of the proposed SCCAD system.
References
Dermatology Database Used In MED-NODE.(2018) Department Of Dermatology Of The University Medical Center Groningen (UMCG). PH² Database.(2018) Dermatology Service Of Hospital Pedro Hispano, Matosinhos, Portugal.
Agolytics. Tutorial: (2019) How To Establish Quality And Correctness Of Classification Models? Part 3 – Confusion Matrix [Online]. Agolytics. Available: Http://Algolytics.Com/How-To-Establish-Quality-And-Correctness-Of-Classification-Models-Part-3-Confusion-Matrix/ [Accessed 2019].
Almansour, E. & Jaffar, M. A. (2016). Classification Of Dermoscopic Skin Cancer Images Using Color And Hybrid Texture Features. Ijcsns International Journal Of Computer Science And Network Security, 16.
Almaraz-Damian, J. A., Ponomaryov, V. & Rendon-Gonzalez, E. 2016. Melanoma Cade Based On Abcd Rule And Haralick Texture Features. 2016 9th International Kharkiv Symposium On Physics And Engineering Of Microwaves, Millimeter And Submillimeter Waves (Msmw). Kharkiv, Ukraine: Ieee.
American Cancer Society (2017). Cancer Facts & Figures 2017.
Amirjahan, M. & N.Sujatha (2016). Comparative Analysis Of Various Classification Algorithms For Skin Cancer Detection. International Journal Of Emerging Technologies In Engineering Research (Ijeter), 4.
Ansari, U. & Sarode, T. (2017). Skin Cancer Detection Using Svm.
Antony, A., Ramesh, A., Sojan, A., Mathews, B. & Varghese, T. A. (2016). Skin Cancer Detection Using Artificial Neural Networking. International Journal Of Innovative Research In Electrical, Electronics, Instrumentation And Control Engineering, 4.
Arasi, M. A., El-Horbaty, E.-S. M., Salem, A. M. & El-Dahshan, E.-S. A. (2017). Computational Intelligence Approaches For Malignant Melanoma Detection And Diagnosis. 2017 8th International Conference On Information Technology (Icit). Amman, Jordan, Jordan: Ieee.
Barata, C., Ruela, M., Francisco, M., Mendonca, T. & Marques, J. S. (2014). Two Systems For The Detection Of Melanomas In Dermoscopy Images Using Texture And Color Features. Ieee Systems Journal, 8, 965-979.
Cancer Treatment Cancers of America. Skin Cancer Diagnostic Evaluations [Online]. Cancer Treatment Cancers Of America. Available: Http://Www.Cancercenter.Com/Skin-Cancer/Diagnostics-And-Treatments/Tab/Diagnostic-Evaluations/ [Accessed 2018].
Celebi, M. E. & Schaefer, G. (2012). Color Medical Image Analysis, Springer Netherlands.
Elgamal, M. 2013. Automatic Skin Cancer Images Classification. (Ijacsa) International Journal Of Advanced Computer Science And Applications, 4.
Farooq, M. A., Azhar, M. A. M. & Raza, R. H. (2016). Automatic Lesion Detection System (Alds) For Skin Cancer Classification Using Svm And Neural Classifiers. 2016 Ieee 16th International Conference On Bioinformatics And Bioengineering (Bibe). Taichung, Taiwan: Ieee.
Filali, Y., Ennouni, A., Sabri, M. A. & Aarab, A. (2017). Multiscale Approach For Skin Lesion Analysis And Classification 2017 International Conference On Advanced Technologies For Signal And Image Processing (Atsip). Fez, Morocco, Morocco: Ieee.
Gautam, D. & Ahmed, M. (2015). Melanoma Detection And Classification Using Svm Based Decision Support System. 2015 Annual Ieee India Conference (Indicon). New Delhi, India: Ieee.
Hanon Alasadi, A. & M.Alsafy, B. (2015). Early Detection And Classification Of Melanoma Skin Cancer, Research Gate. Ieee 1990. Ieee Standard.
Jain, S., Jagtap, V. & Pise, N. (2015). Computer Aided Melanoma Skin Cancer Detection Using Image Processing. Procedia Computer Science, 48, 735-740.
Jaleel, J. A., Salim, S. & Aswin.R.B (2013). Diagnosis And Detection Of Skin Cancer Using Artificial Intelligence. International Journal Of Engineering And Innovative Technology (Ijeit), 3.
Jayaraman, S., Esakkirajan, S. & Veerakumar, T.( 2009). Digital Image Processing. Tata Mcgraw Hill Ndia;. M.Suryapraba, G.Rajanarayanee & Kumari, P. (2015.) Analysis Of Skin Cancer Classification Using Glcm Based On Feature Extraction In Artificial Neural Network International Journal Of Emerging Technology In Computer Science & Electronics (Ijetcse), 13.
Manerkar, M. S., Harsh, S., Saxena, J., Sarma, S. P., Snekhalatha, U. & Anburajan, M. (2016). Classification Of Skin Disease Using Multi Svm Classifier. 3rd International Conference On Electrical, Electronics, Engineering Trends, Communication, Optimization And Sciences (Eeecos)-2016. Tamil Nadu, India.
Masood, A. & Al-Jumaily, A. A. (2013). Computer Aided Diagnostic Support System For Skin Cancer: A Review Of Techniques And Algorithms. International Journal Of Biomedical Imaging, 2013, 22.
Maurya, R., Singh, S. K., Maurya, A. K. & Kumar, A. (2015). Glcm And Multi Class Support Vector Machine Based Automated Skin Cancer Classification. 2014 International Conference On Computing For Sustainable Global Development (Indiacom). New Delhi, India: Ieee.
Mete, M., Sirakov, N. M., Griffin, J. & Menter, A. (2016)A Novel Classification System For Dysplastic Nevus And Malignant Melanoma. 2016 Ieee International Conference On Image Processing (Icip). Phoenix, Az, Usa: Ieee.
Mhaske, H. R. & Phalke, D. A. (2013). Melanoma Skin Cancer Detection And Classification Based On Supervised And Unsupervised Learning. 2013 International Conference On Circuits, Controls And Communications (Ccube), . Bengaluru, India: Ieee.
Nationalcancerinstitute (2010). What You Need To Know About Melanoma And Other Skin Cancers. National Cancer Institute.
Nizar, F. & Kumar, G. S. S. (2016). Classification Of Various Skin Lesions Using Svm And Knn Classifiers. International Journal Of Innovative Research In Computer And Communication Engineering, 4.
Philbin, J., Chum, O. R., Isard, M., Sivic, J. & Zisserman, A. (2007). Object Retrieval With Large Vocabularies And Fast Spatial Matching. 2007 Ieee Conference On Computer Vision And Pattern Recognition. Minneapolis, Mn, Usa: Ieee.
R.Sumithra, Suhil, M. & D.S.Guru (2015). Segmentation And Classification Of Skin Lesions For Disease Diagnosis. Procedia Computer Science, 45, 76-85.
Rahman, A. & Tasnim, S. (2014). Ensemble Classifiers And Their Applications: A Review. International Journal Of Computer Trends And Technology (Ijctt) 10.
Ray, S. (2015). Understanding Support Vector Machine Algorithm From Examples (Along With Code) [Online]. Available: Https://Www.Analyticsvidhya.Com/Blog/2017/09/Understaing-Support-Vector-Machine-Example-Code/ [Accessed].
Russ, J. C. (1999). The Image Processing Handbook, Florida.
Sharma, D. & Srivastava, S. 2016. Automatically Detection Of Skin Cancer By Classification Of Neural Network. International Journal Of Engineering And Technical Research (Ijetr), 4.
Singhal, E. & Tiwari, S. (2015). Skin Cancer Detection Using Arificial Neural Network. International Journal Of Advanced Research In Computer Science, 6.
Skin Cancer Foundation. Skin Cancer Information (2018) Online. Skin Cancer Foundation. Available: Http://Www.Skincancer.Org/Skin-Cancer-Information [Accessed 2018].
Suzuki, K. (2017). Overview Of Deep Learning In Medical Imaging. Springer Singapore.
Thamilselvan, P. & Sathiaseelan, J. G. R. (2015). A Comparative Study Of Data Mining Algorithms For Image Classification.
Thomas, A. & K, S. (2014). A Survey On Image Feature Descriptors-Color, Shape And Texture (Ijcsit) International Journal Of Computer Science And Information Technologies, 5.
Vala, H. J. & Baxi, A. (2013). A Review On Otsu Image Segmentation Algorithm. International Journal Of Advanced Research In Computer Engineering & Technology (Ijarcet), 2.
Victor, A. & Ghalib, M. R. (2017). Automatic Detection And Classification Of Skin Cancer. International Journal Of Intelligent Engineering And Systems, 10.
World Health Organization. (2018) Skin Cancers [Online]. World Health Organization. Available: Http://Www.Who.Int/Uv/Faq/Skincancer/En/Index1.Html [Accessed].

