Department of Biochemistry, Faculty of Science, King Abdulaziz University, Jeddah, Saudi Arabia
Corresponding author email: mhalkhatib@kau.edu.sa
Article Publishing History
Received: 17/01/2020
Accepted After Revision: 25/03/2020
Incorporation of a chemotherapeutic drug into natural oils based-nanoemulsion may facilitate its delivery to the cancer cells and improve its cytotoxic effect. The current study is aimed o formulate etoposide (EP) in a nanoemulsion formula (BLO-EVO-N) produced by blending black currant seed (BLO) and evening primrose (EVO) oils with an emulsifying agent and to in vitro assess its anti-cancer activity on the A549. The size and charge of the produced formulas, BLO-EVO-N and EP/BLO-EVO-N, were characterized using the dynamic light scattering techniques. The viability and invasion of the treated A549 cells were assessed using a cell counting kit- 8 and collagen-based cell invasion assay. Apoptosis of A549 cells was evaluated with mitochondrial staining, annexin V- fluorescein isothiocyanate (FITC), cell death assays. The z-average diameter of EP/BLO-EVO-N (75.19 ± 9.0 nm) was increased when loaded with EP (236.9 ± 6.8 nm). Most of the A549 cells remained viable following treatment with a single EP, while a remarkable reduction in the percentage of the viable cells was noticed at the EP/BLO-EVO-N treatment. The signs of apoptosis, such as the change in the mitochondrial permeability, increased amount of apoptotic cells and enhancement in the mono- and oligonucleosomes ratios were larger when cells were treated with EP/BLO-EVO-N formula. Regarding the invasion assay, the EP/BLO-EVO-N has a potent anti-invasion effect since it can suppress the invasion of 66% of the A549 cells. In conclusion, combining EP in BLO-EVO-N formula had improved the anti-tumor effect of EP in A549 cells.
Anti-cancer activity; Apoptosis; Cell viability; Chemotherapeutics; Mitochondrial permeability; Polyunsaturated fatty acids
Al-Hashemi S. M, Alkhatib M. H, Gashlan H. M. Incorporating Etoposide Into PUFA-Rich Oils Nanoemulsion Potentiates iIts Inhibitory Effect on the Cellular Growth of A549 Non-Small Cell Lung Cancer Cells. Biosc.Biotech.Res.Comm. 2020;13(1).
Al-Hashemi S. M, Alkhatib M. H, Gashlan H. M. Incorporating Etoposide Into PUFA-Rich Oils Nanoemulsion Potentiates iIts Inhibitory Effect on the Cellular Growth of A549 Non-Small Cell Lung Cancer Cells. Biosc.Biotech.Res.Comm. 2020;13(1). Available from: https://bit.ly/2VPviOP
Copyright © Al-Hashemi et al., This is an open access article distributed under the terms of the Creative Commons Attribution License (CC-BY) https://creativecommons.org/licenses/by/4.0/, which permits unrestricted use distribution and reproduction in any medium, provide the original author and source are credited.
INTRODUCTION
Despite the extensive developments in cancer therapy, lung cancer remains the foremost cause of cancer-related deaths in both males and females (Yin et al., 2017; Bray et al., 2018). Moreover, most of the lung cancer patients ~80% are diagnosed with non-small cell lung cancer (NSCLC). The low survival rate after treatments of NSCLC patients could be attributable to the late diagnosis and the cancer metastasis. Therefore, handling of NSCLC metastasis is one of the most crucial ways for effective lung cancer therapies (Townsend et al., 2017; Altorki et al., 2019). Despite the extensive uses of chemotherapeutics agents, the undesirable side effects, drug resistance, short biological half-life, low permeability, and poor solubility are the main causes leading to failure delivery of the drug to the cancer cell Therefore, colloidal delivery systems were proposed to overcome the main hurdle related to the conventional chemotherapeutic agent and to enhance its efficacy (Reddy et al., 2006; Pandey, 2020).
The natural oils of BLO and EVO are a rich source of polyunsaturated fatty acids (PUFAs) that have a potent anti-cancer activity (Sayegh et al., 2016; Timoszuk et al., 2018). The possible mechanisms for PUFAs apoptotic effect in cancer cells are owing to the disruption of the cell cycle progression, stimulation of the cellular oxidative stress, and alteration of the membrane fluidity which might facilitate the permeation of the anti-cancer drugs to the target cell (Menendez et al., 2001; Xu and Qian, 2014; Zajdel et al., 2015). Nanoemulsions (NEs) are one of the most effective dispersed nanosystems that are developed to improve the delivery of therapeutic agents. The NEs offer several advantages in the therapeutic field, such as enhanced bioavailability, physical stability, and solubility of the lipophilic drug (Jaiswal et al., 2015; Ting et al., 2015; Khan et al., 2018; Halnor et al., 2018). In the present study, a novel EP-loaded NE formula based on mixing BLO and EVO oils was produced to potentiate the efficacy of EP. The antitumor activity of the produced formula was in vitro evaluated in the A549 cells.
MATERIALS AND METHODS
Materials: EP was obtained from Ebewe Pharma GmbH (Unterach, Austria). Tween 80 and span 20 were purchased from Al-Rowad Modern Est. for the Medical Supply. The natural oils (EVO and BLO) were acquired from Chateau Cosmetics Botanical Beauty (Miami, Florida US). Cell Counting Kit- 8 (CCK-8) (Lot. No. LE612) was acquired from Dojindo Molecular Technologies, Inc. (Japan). Mitochondria Staining Kit (Cat. No. CS0390) was purchased from Sigma Aldrich.
Preparation of BLO-EVO-N formulas: The formula (BLO-EVO-N) was produced by the ultrasonication method. A volume fraction of 2 % of each BLO and EVO were combined with 86 % of buffer (50 mM, pH7) and then stabilized by the addition of 3 % Span 20 and 7 % Tween 80. The mixture was sonicated for 30 min using the Omni Sonic Ruptor 4000 Ultrasonic Homogenizer (New York, US) until it becomes clear. The EP-loaded formulations (EP/BLO-EVO-N) were prepared by directly solubilizing the EP in the BLO-EVO-N formula.
Physical measurements of formulation: The zeta potentials, z-average diameters, and polydispersity index (PDI) for the produced formulas were measured using zetasizer (Malvern Instruments Ltd., UK).
In vitro drug release: The in vitro release of EP and EP/BLO-EVO-N was assessed using the dialysis technique. 1 mL of the EP and EP/BLO-EVO-N were relocated into the dialysis bag separately (Cut-off 3.5 Da, Spectra Lab, California) submerged into 200 mL buffer (50 mM, pH 7.4) and stirred at 100 rpm. Almost 1.0 mL of the buffer was taken at a predetermined interval and replaced by fresh buffer (1.0 mL). The optical density of the removed buffer at a specific time (A1) was measured by using a UV-Vis spectrophotometer (Thermo Scientific™, US). The % of EP released was estimated through dividing A1 by A0 (absorbance of the initial sample added to the dialysis bag) and multiplying by 100.
Determination of antitumor activity: Cell culture: Non-small cell lung cancer cell line (A549) was generously provided by King Abdulaziz University Hospital (Jeddah, KSA). Approximately 2×10⁶ A549 cells were plated in a culture flask (25 cm2) containing 5 mL of Dulbecco’s modified eagle’s medium (DMEM), complemented with 10 % (v/v) fetal bovine serum (FBS), 1 % (v/v) penicillin/streptomycin and incubated at 37oC in a 5 % CO2 humidified atmosphere.
Cell counting kit-8 assay :A549 cells (1×10⁴/well) were cultured into 96-well plates at which each well-contained 100 μL of DMEM followed by incubation at 37oC for 24 h in a CO2 incubator. Then, 200 μL of tested formula, EP, BLO-EVO-N, and EP/BLO-EVO-N were added. The cellular viability was evaluated by adding 5 μL of CCK-8 reagent to each well, mixed gently, and incubated for 3 h at culture conditions. After that, the absorbance (A) of treated cells, control cells, and media (blank) were measured in a BioTek Microplate Reader (λ = 450 nm). The cellular viability (% CV) was calculated by subsequent calculation: % CV = ((A of treated cells –A of blank) / (A of control)) *100
Cell morphology characterization :Cells (1×10⁴/well) were cultured and treated into 96-well plates at the same procedure done in the CCK-8 experiment. Following treatments, the DMEM was removed, cells were rinsed with 100μL phosphate buffer saline (0.5mM, PBS), fixed by the addition of formaldehyde (200 μL, 4 %), and stained with100 μL of 5 % Coomassie Brilliant Blue dye for 10 min. Finally, cells were cleaned with tap water followed by drying overnight at 25oC. The morphological alteration of treated cells was detected using a phase-contrast inverted microscope (Olympus, Japan).
DAPI Staining :In a 24 well-plate, A549 cells (5×10⁴/well) were seeded in each well-containing 0.5 mL of growth media. Then, 0.5 mL of the IC50 for each BLO-EVO-N and EP/BLO-EVO-N was added to each well. After that, cells were rinsed with 300 μL PBS (50 mM, pH7.4), fixed via 4% formaldehyde, stained for 2 min with DAPI stain (300 μL, 300 nM) and visualized using fluorescent microscope at λ = 437nm (Leica CRT6000, Germany).
Mitochondrial permeability assay: The 1×10⁴ of A549 cells were grown in 100 μL of DMEM in each well of 96 well-plates. Then, cells were incubated with 200 μL of IC50 for BLO-EVO-N and EP/BLO-EVO-N for 24 h at 37oC. After that, cells were stained with a cytofluorimetric, cationic dye, JC-1 stain solution (JC-1 stain, JC-1buffer solution, and DMEM) and incubated at 37 oC. Finally, the fluorescence was examined at excitation (Ex): 525 nm / emission (Em): 590 for red fluorescence (depolarization) and at Ex: 490nm / Em: 530 for green fluorescence (hyperpolarization) using fluorescence microplate reader (Synergy™ HTX, BioTek, US).
Annexin V-FITC/PI assay:A549 cells apoptosis was assessed using Annexin V-FITC Apoptosis Detection Kit (Cat. No. MBS668896, MyBioSource, San Diego, USA). Briefly, cells )3×10⁵/well) were planted into 6 well- plates contained 2 mL of DMEM and incubated at 37oC. Then, 2 mL of IC50 for the various formulation was added. After that, cells were harvested, rinsed twice with pre-cold PBS, spun down (300 g), re-suspended in 1X binding buffer (100 μL). Then, 5 μL of each FITC and PI added, incubated for 20 min, and completed with 400 μL of binding buffer. Finally, cells estimated within one hour using flow cytometer (FACS AriaTM III, BD Biosciences, CA, US).
Nuclear fragmentation assay: The DNA fragmentation ratio was examined by applying a Cell Death Detection ELISAplus kit (Lot. No. 19315700, Mannheim, Germany). Briefly, cells (1×10⁴/well) were cultured into 96 well-plates contained 100 μL of growth medium. Then, 0.2 mL of IC50 of tested formulas were added. After that, 20 μL of cell lysates were relocated into the streptavidin-coated microplate, supplemented with 80μL of immunoreagent and incubated on a shaker (300 rpm, 2 h) at the dark. Then, the ABTS stain was add and incubated on a plate shaker (10 min). The optical density (A) was determined (405 nm) and the DNA fragmentation ratio was estimated according to the following equation:
DNA fragmentation ratio = (A of treated (dead cells)/ A of control (viable cells)).
Cell invasion assay :The ability of A549 cells to invade the collagen membrane was evaluated by utilizing Chemicon collagen-based cell invasion assay kit (Cat. No. ECM551, Merck KGaA, Darmstadt, Germany). Briefly, Cells (3×10³/well) were cultured and treated into six-well plates similar to the procedure done in the Annexin V-FITC/PI assay. After treatments, the insert was incubated with serum-free medium (300 µL, 30 min), and then 250 µL of cell suspension was added. The insert was incubated at 500 µL of complete medium for 24 h in a CO2 incubator. After that, the insert was stained, gently cleaned, and then incubated with the extraction buffer (200 µL, 15 min). The extraction solution (100 µL) was shifted to a 96 well-plate for colorimetric measurements (560 nm). The % of A549 cell invasion was measured by the subsequent equation:
% Relative Invasion = (A of treatment / A of control) *100
Statistical Analysis:The variations between groups were assessed through one-way ANOVA. The significant differences between the two groups were estimated by the independent sample t-test (P < 0.05). Values were presented as mean ± SD and done in triplicate. All statistical calculations were carried out using MegaStat Excel Software (Butler University, Indianapolis).
RESULTS AND Discussion
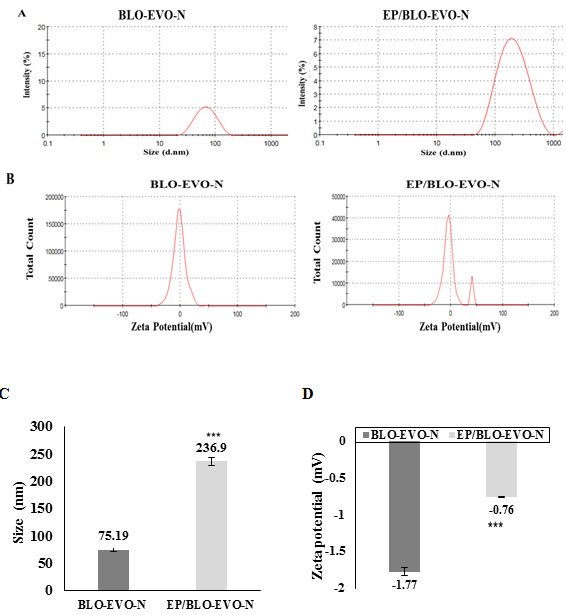
Physical characterization of formulations: As exhibited in Figure 1 (A and C), the dispersed nanodroplets of EP-loaded BLO-EVO-N had noticeably increased when compared to the ones of free BLO-EVO-N (P < 0.001). The greater size of EP/BLO-EVO-N might indicate that EP was located inside the core of the BLO-EVO-N micelles. It has been recently demonstrated that the droplet size of sorafenib merging in a carrot-NE was larger than free carrot-NE (Alkhatib et al., 2018). Additionally, the polydispersity indexes (PDI) for both formulations, BLO-EVO-N and EP/BLO-EVO-N, which were calculated by dividing the SD over the average size, were smaller than 0.08, indicating a monodisperse size distribution. According to Figure 1 (B and D), the negative charge magnitudes of BLO-EVO-N was considerably larger than EP/BLO-EVO-N (P < 0.001).
Figure 1: A Particle size distributions of BLO-EVO-N and EP/BLO-EVO-N, measured using zetasizer. B Zeta potential spectrum of BLO-EVP-N and EP/BLO-EVO-N. C & D The graphs displayed the amount of z-average diameters and zeta potential for the produced formula, respectively. Data were expressed as mean ± SD (n =3). Error bars represent the standard deviation. The P-values were assessed using the independent t-tests. The (***, P < 0.001) represents the very highly significant difference between the variables.
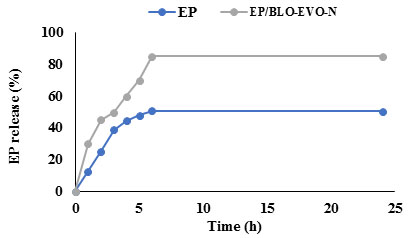
In vitro drug release: As demonstrated in Figure 2, the EP-loaded BLO-EVO-N showed a faster release than the native EP solution. Approximately, half of the EP/BLO-EVO-N was released at the third hour compared to the 38% of the released EP solution. The rapid release of EP/BLO-EVO-N than free EP could be ascribed to the negative charge and monodisperse size distribution of the EP/BLO-EVO-N formula. After 24 h, nearly 85 % of EP/BLO-EVO-N was released, while 50% of the EP solution was released.
Figure 2: In vitro release profiles of free EP and EP/BLO-EVO-N in phosphate buffer (50 mM, pH7.4) using dialysis technique.
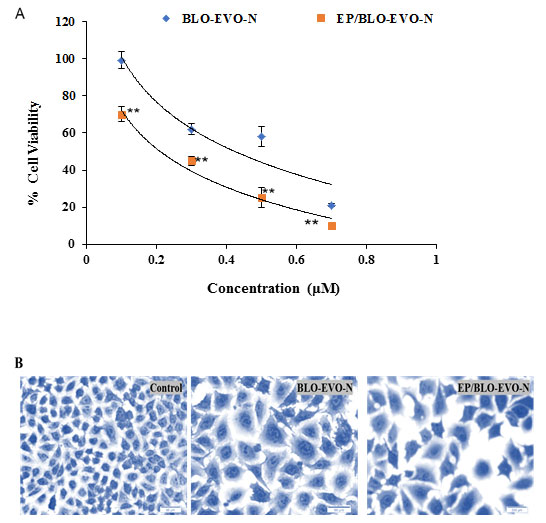
Cell viability assay: The % of viable A549 cells following incubation with formulations at different concentrations (0.7, 0.5, 0.3, and 0.1 μM) for 24 h was displayed in Figure 3A. Most of the A549 cells remain viable after treatment with the free drug formula (EP). In contrast, a remarkable decrease in the % of viable A549 cells was detected following treatment with BLO-EVO-N and EP/BLO-EVO-N. Furthermore, the graph showed a steady decline in the % of viable A549 cells once the concentration of drug formulas increased. Regarding half-maximal inhibitory concentration (IC50) of the produced formula, the EP/BLO-EVO-N (0.2 ± 0.03 μM) has a considerably less IC50 than that of BC/EP-NE (0.4 ± 0.01 μM) (P < 0.001). Interestingly, the incorporating of EP in the NE based on EVO and BLO might facilitate its delivery and enhanced its antineoplastic effects on A549 cells. In agreement with our findings, several previous studies have pointed out that using an essential oil or synthetic drug in a nanoemulsion form exhibited a strong cytotoxic effect on various cancer cells (Farshi, et al., 2017; Milhomem-Paixão et al., 2017; Pereira et al., 2017; Alkhatib et al., 2018; Alkhatib et al., 2019). According to the light microscopy images presented in Figure 3B, the treated A549 cells showed a reduction in cell count, loss of cell membrane, irregular cell shape and membrane blubbing compared to the untreated cells (control).
Figure 3: A Cytotoxicity effect of various concentrations of the tested formulas on the A549 cells incubated for 24h at 37°C determined by the CCK-8 assay. Data were presented as mean ± SD (n = 3). Error bars display the ± SD. The P-values were assessed using the independent t-tests. The highly significant differences between formulas were represented as (**, 0.001 ≤ P < 0.01). B Light microscopy images of the control (untreated) and treated A549 cells stained with Coomassie blue. Images were magnified at 40 X.
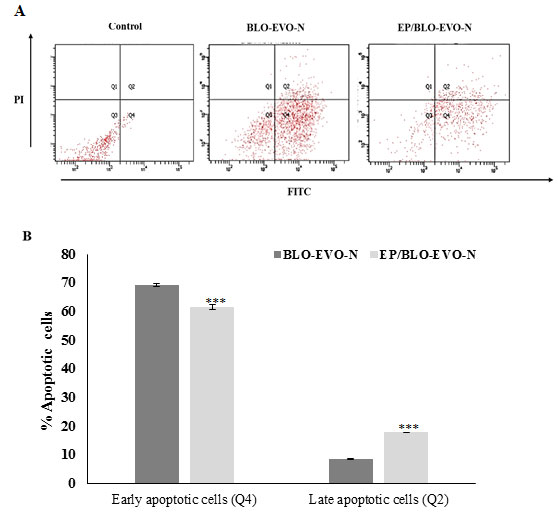
Apoptosis detection: The apoptosis of A549 cells treated with BLO-EVO-N and EP/BLO-EVO-N was evaluated using different assays, mitochondrial permeability, Annexin V-FITC flow cytometry, cell death, light, and fluorescent microscopy. The failure in the electrochemical gradient of the mitochondrial membrane (lowering red/green fluorescence intensity ratio) was detected when A549 cells were treated with various formulations relative to the untreated cells (P < 0.001). Moreover, the loss of the A549 cells mitochondrial gradient (lowering red/green fluorescence intensity ratio) was higher with the EP/BLO-EVO-N treatment (Figure 4) ( P < 0.001). Additionally, the flow cytometry plots (Figure 5A), displayed that cells treated with the formulations, BLO-EVO-N and EP/BLO-EVO-N, were distinguished to the different stages of apoptosis. The highest amount of early apoptotic cells was noticed when cells were treated with BLO-EVO-N (Figure 5B). In contrast, the amount of late apoptotic cells was considerably increased upon the EP/BLO-EVO-N treatment (P < 0.001).
Figure 4: Mitochondrial permeability change of A549 cells detected by measuring the red/green fluorescence intensity ratio using JC-1stain. Data were expressed as mean ± SD (n = 3). Error bars display the ± SD. The independent t-tests evaluated the P-values. The (***) indicates the very highly significant differences between formulas (P < 0.001).
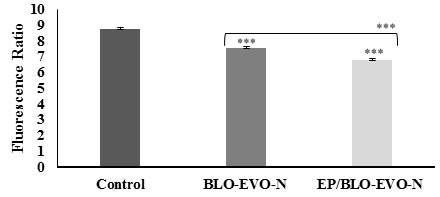
Figure 5: A FITC/PI flow cytometry plots of A549 cells subjected to the formulation. Cells were treated with the IC50 of BLO-EVO-N and EP/BLO-EVO-N for 24 h. Cells were categorized as necrotic (Q1), late apoptotic (Q2), viable (Q3), and early apoptotic cells (Q4). B Bar chart reveals the percentages of A549 cells undergoing apoptosis. Data were expressed as mean ± SD (n = 3). Error bars display the ± SD. The independent t-tests assessed the P-values. The (***) referred to the very highly significant differences (P < 0.001).
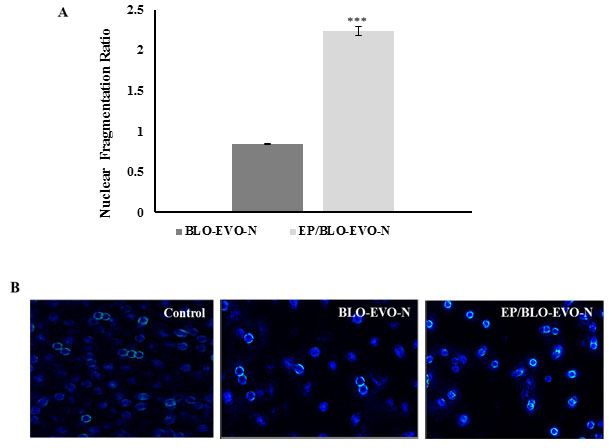
The results of the flow cytometry analysis were confirmed with the cell death experiment that indicates the increased ratio of the mono- and oligonucleosomes of the apoptotic A549 cells upon the EP/BLO-EVO-N treatment (Figure 6A). The nuclear fragmentation ratios were increased to 2.2 ± 0.05 when A549 cells were treated with EP/BLO-EVO-N (P < 0.001). According to the fluorescence microscopy images exhibited in Figure 6B, the changes of the A549 nuclear morphology was more considerable in the treated A549 cells. The active component of PUFAs such as arachidonic acid (AA, ω-6), gamma-linolenic acid (GLA, ω-6), eicosapentaenoic acid (EPA, ω-3), and docosahexaenoic acid (DHA, ω-3) have a selectively tumoricidal effect on cancer cells (Dai et al., 2013). Zajdel et al. (2015) have found that ω-3 PUFAs specifically, EPA and DHA possess many cytotoxic effects on the A549 cells such as inhibition of cellular growth, enhanced cell death, stimulated activation of caspase-3/7, and potentiated intracellular oxidative DNA. Likewise, a previous study of Dai et al. (2013) emphasized that PUFAs can induce apoptosis in the gastric carcinoma cells by lipid peroxidation process. The valuable effects of EVO have been confirmed in the treatments of many diseases such as atopic dermatitis, psoriasis, asthma, and anti-cancer therapy (Timoszuk et al., 2018). Therefore, combining EP in the NE containing PUFAs could enhance the delivery of EP to the target site and improve the induction of A549 cells apoptosis.
Figure 6: A Nuclear fragmentation ratio in the cytoplasm of the apoptotic A549 cells following treatments with the IC50 of BLO-EVO-N and EP/BLO-EVO-N for 24 h. Error bars display the ± SD. The P-values were calculated using the independent t-tests. The (***) described the very highly significant differences between BLO-EVO-N and EP/BLO-EVO-N (P < 0.001). B Nuclear changes of the treated A549 cells stained with DAPI and observed using fluorescence microscopy. Images were magnified at 20X.
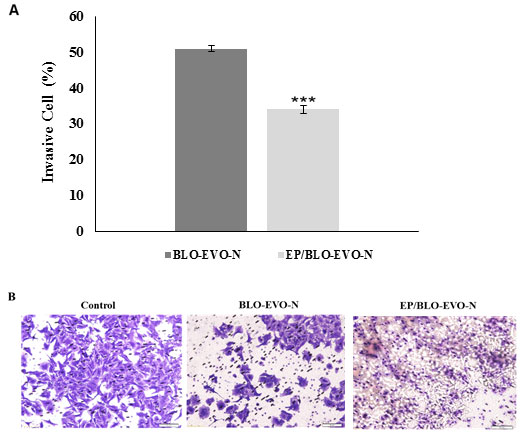
A549 cell invasion: The effect of BLO-EVO-N and EP/BLO-EVO-N in repressing the invasion of A549 cells was displayed in Figure 7 (A and B). The invasion of 49 % of A549 cells was repressed when cells were treated with free BLO-EVO-N formula relative to the untreated cell (control). Upon treatments with EP/BLO-EVO-N, the A549 cells showed a noticeable decrease in the invasive rate than BLO-EVO-N (P < 0.001). Increased susceptibility of the tumor cells to apoptosis, diminished angiogenesis and suppressed metastasis are some of the various signaling pathways of n-3 PUFA (Gorjao et al., 2019).
The DHA and EPA, as a ω-3 PUFAs, are vital for the treatments and prevention of metastatic lung cancer (Yin et al., 2017). In a previous study, Zhang et al. (2012) have reported that PUFAs, DHA and EPA, have an impact on breast cancer proliferation, differentiation, and prognosis. In the present study, the BLO-EVO-N and EP/BLO-EVO-N could inhibit the invasion of A549 cells by 49% and 66%, respectively. The obvious decrease in the percentage of invaded A549 cells at the EP/BLO-EVO-N treatments compared to the BLO-EVO-N might be attributed to the combined effect of EP and the active metabolites of the natural oils, BLO and EVO.
Figure 7 A : The percentages of invasive A549 cells after treatments with the IC50 of BLO-EVO-N and EP/BLO-EVO-N for 24 h. Data were expressed as mean ± SD. Error bars represent the ± SD. The P-values were measured by the independent t-tests. The (***) referred to very highly significant differences (P < 0.001). B Images of the invasive A549 cells following treatments with the formulation using light microscopy (Magnification 20X).
CONCLUSION
The free-EP did not induce any noticeable inhibitory effect on the A549 cellular growth. However, incorporating EP in a mixed natural oils based-nanoemulsion (EP/BLO-EVO-N) had significantly reduced the A549 cellular growth and invasion. The new formula EP/BLO-EVO-N is a promising antitumor agent that has beneficial properties owing to the inclusion of oils that are rich with the PUFAs. Given that, EP/BLO-EVO-N needs to be further investigated in animal models.
REFERENCES
Alkhatib, M. H., Al-Otaibi, W. A., & Wali, A. N. (2018). Antineoplastic activity of mitomycin C formulated in nanoemulsions-based essential oils on HeLa cervical cancer cells. Chemico-Biological Interactions, 291, 72-80.
Alkhatib, M. H., AlMotwaa, S. M., & Alkreathy, H. M. (2019). Incorporation of ifosfamide into various essential oils-based nanoemulsions ameliorates its apoptotic effect in the cancers cells. Scientific Reports, 9(1), 695-703.
Alkhatib, M. H., Alnahdi, N. S., & Backer, W. S. (2018). Antitumor activity, hematoxicity and hepatotoxicity of sorafenib in a nanoemulsion based on the carrot seed oil. International Journal of Life Science and Pharma Research, 8, 50-57.
Altorki, N. K., Geoffrey, J. M., Dingcheng, G., Jeffrey, L. P., Ashish, S., Brendon, S., Timothy, M., and Vivek, M. (2019). ‘The lung microenvironment: an important regulator of tumour growth and metastasis’, Nature Reviews Cancer, 19, 9-31.
Bray, F., Ferlay, J., Soerjomataram, I., Siegel, R. L., Torre, L. A., & Jemal, A. (2018). Global cancer statistics 2018: GLOBOCAN estimates of incidence and mortality worldwide for 36 cancers in 185 countries. CA: A Cancer Journal for Clinicians, 68(6), 394-424.
Dai, J., Shen, J., Pan, W., Shen, S., & Das, U. N. (2013). Effects of polyunsaturated fatty acids on the growth of gastric cancer cells in vitro. Lipids in Health and Disease, 12(1), 71-85.
Farshi, P., Tabibiazar, M., Ghorbani, M., & Hamishehkar, H. (2017). Evaluation of antioxidant activity and cytotoxicity of cumin seed oil nanoemulsion stabilized by sodium caseinate-guar gum. Pharmaceutical Sciences, 23(4), 293-300.
Gorjao, R., dos Santos, C. M. M., Serdan, T. D. A., Diniz, V. L. S., Alba-Loureiro, T. C., Cury-Boaventura, M. F., Hatanaka, E., Levada-Pires, A.C., Sato, F.T., Pithon-Curi, T.C., Fernandes, L.C., Curi, R., Hirabara, S.M. (2019). New insights on the regulation of cancer cachexia by N-3 polyunsaturated fatty acids. Pharmacology & Therapeutics, 196, 117-134.
Halnor, V.V., Pande, V.V., Borawake, D.D., and Nagare, H.S. (2018). ‘Nanoemulsion: A novel platform for drug delivery system’, Journal of Materials Science & Nanotechnology, 6, 104-114.
Jaiswal, M., Dudhe, R., & Sharma, P. (2015). Nanoemulsion: an advanced mode of drug delivery system. 3 Biotech, 5(2), 123-127.
Khan, I., Bahuguna, A., Kumar, P., Bajpai, V. K., & Kang, S. C. (2018). In vitro and in vivo antitumor potential of carvacrol nanoemulsion against human lung adenocarcinoma A549 cells via mitochondrial mediated apoptosis. Scientific Reports, 8(1), 144-158.
Menendez, J., del Mar Barbacid, M., Montero, S., Sevilla, E., Escrich, E., Solanas, M., Colomer, R. (2001). Effects of gamma-linolenic acid and oleic acid on paclitaxel cytotoxicity in human breast cancer cells. European Journal of Cancer, 37(3), 402-413.
Milhomem-Paixão, S. S. R., Fascineli, M. L., Muehlmann, L. A., Melo, K. M., Salgado, H. L. C., Joanitti, G. A., Grisolia, C. K. (2017). Andiroba oil (Carapa guianensis Aublet) nanoemulsions: development and assessment of cytotoxicity, genotoxicity, and hematotoxicity. Journal of Nanomaterials, 2017,e362046.
Pandey and Abhishek. (2020). Solid Lipid Nanoparticles: A Multidimensional Drug Delivery System.’ in, Nanoscience in Medicine Vol. 1 (Springer).
Pereira, F. G., Marquete, R., Oliveira-Cruz, L., Quintanilha-Falcão, D., Mansur, E., & de Lima Moreira, D. (2017). Cytotoxic effects of the essential oil from leaves of Casearia sylvestris Sw. (Salicaceae) and its nanoemulsion on A549 tumor cell line. Boletín Latinoamericano y del Caribe de Plantas Medicinales y Aromáticas, 16(5), 506-512.
Reddy, L. H., Adhikari, J. S., Dwarakanath, B. S. R., Sharma, R. K., & Murthy, R. R. (2006). Tumoricidal effects of etoposide incorporated into solid lipid nanoparticles after intraperitoneal administration in Dalton’s lymphoma bearing mice. The AAPS Journal, 8(2), E254-E262.
Sayegh, F., Elazzazy, A., Bellou, S., Moustogianni, A., Elkady, A. I., Baeshen, M. N., & Aggelis, G. (2016). Production of polyunsaturated single cell oils possessing antimicrobial and anticancer properties. Annals of Microbiology, 66(3), 937-948.
Timoszuk, M., Bielawska, K., & Skrzydlewska, E. (2018). Evening Primrose (Oenothera biennis) Biological Activity Dependent on Chemical Composition. Antioxidants, 7(8), 108-118.
Ting, Y., Chiou, Y.-S., Pan, M.-H., Ho, C.-T., & Huang, Q. (2015). In vitro and in vivo anti-cancer activity of tangeretin against colorectal cancer was enhanced by emulsion-based delivery system. Journal of Functional Foods, 15, 264-273.
Townsend, M. H., Anderson, M. D., Weagel, E. G., Velazquez, E. J., Weber, K. S., Robison, R. A., & O’Neill, K. L. (2017). Non-small-cell lung cancer cell lines A549 and NCI-H460 express hypoxanthine guanine phosphoribosyltransferase on the plasma membrane. OncoTargets and Therapy, 10, 1921-1932.
Xu, Y., & Qian, S., Y. (2014). Anti-cancer activities of ω-6 polyunsaturated fatty acids. Biomedical Journal, 37(3), 112-119.
Yin, Y., Sui, C., Meng, F., Ma, P., & Jiang, Y. (2017). The omega-3 polyunsaturated fatty acid docosahexaenoic acid inhibits proliferation and progression of non-small cell lung cancer cells through the reactive oxygen species-mediated inactivation of the PI3K/Akt pathway. Lipids in Health and Disease, 16(1), 87-95.
Zajdel, A., Wilczok, A., & Tarkowski, M. (2015). Toxic effects of n-3 polyunsaturated fatty acids in human lung A549 cells. Toxicology in Vitro, 30(1), 486-491.
Zhang, H., Zhou, L., Shi, W., Song, N., Yu, K., & Gu, Y. (2012). A mechanism underlying the effects of polyunsaturated fatty acids on breast cancer. International Journal of Molecular Medicine, 30(3), 487-494.

