1Department of Zoology, Govt. M.V.M., Affiliated to Barkatullah University Bhopal, M.P.
2Department of Zoology, Sarojini Naidu Govt. Girls Post Graduate College, Bhopal
3Department of Human Biology, Punjabi University, Patiala Punjab
Corresponding author Email: deepgenetics@gmail.com
Article Publishing History
Received: 21/10/2017
Accepted After Revision: 10/12/2017
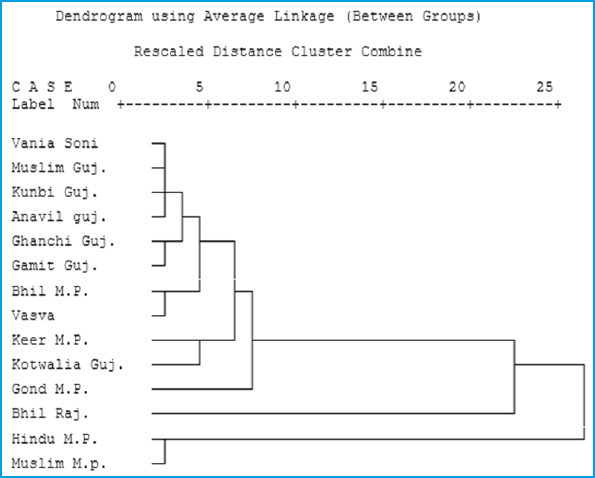
The present biochemical study is planned primarily to characterize genetically the Gond Tribe of Madhya Pradesh. The blood samples for the present study were collected at random from a total of 200 apparently healthy and not closely related individuals of either sex, of the Gond of Hoshangabad, Betul and Sehore districts of Madhya Pradesh. The samples were analyzed for phenotypes of A1A2BO and Rh (D) blood groups by standard tube method and for Red Cell Enzymes electrophoretic method.Typed Red Cell Enzymes were Adenosine Deaminase, Acid Phosphatase locus 1, Phosphoglucomutase locus 1, Esterase D, Adenylate kinase locus 1 and Glucosephosphate isomerase. A rare allele ACP*C was recorded in Gond tribe despite the fact that it was totally absent not only in Keer of Betul, but also in Korku of Pachmarhi Hoshangabad and Bhils of Jhabua . In case of GPI, rare variant (GPI*1-7) was recorded in Gond Tribe of Hoshangabad of the State. There was great heterogeneity (h) values over the loci in the Gond material, varying from as low as 0.0304 at GPI locus to as high as 0.6244 at A1A2BO locus. Analysis of heterozygosity revealed that in the Gond tribe GPI was the least variable locus and A1A2BO was the most variable locus. Genetic relationships among the present Gond tribe and earlier studied Tribal and Caste Populations of Neighboring States of Gujarat and Rajasthan shows that the Hindu and Muslim separated out from the Tribal population of neighboring States from earlier stage of evolution. Rajasthan Bhil shows distant single line subcluster, the latter tribes were placed together in an another subcluster. In addition all the Tribes of Gujarat and Madhya Pradesh shows close genetic affinities.
Biochemical Markers, Genetic Polymorphism, Gond Tribe, Red Cell Enzymes
Bharti D, Chaudhary R, Chahal S. Red Cell Enzyme Gene Polymorphism in Gond Tribe of Madhya Pradesh. Biosc.Biotech.Res.Comm. 2017;10(4).
Bharti D, Chaudhary R, Chahal S. Red Cell Enzyme Gene Polymorphism in Gond Tribe of Madhya Pradesh. Biosc.Biotech.Res.Comm. 2017;10(4). Available from: https://bit.ly/2wPHGk2
Introduction
The Scheduled Tribe population of the State is 15,310,000 as per 2011 Census, this constitutes 20.1 percent of the total population (72,620,000) of the State. Madhya Pradesh holds first rank among all the other states in terms of Scheduled Tribe population. The State has a total of forty six (46) Scheduled Tribes (Census of India, 2011). The Great tribal community mostly found in dense forests of the central India is Gond, They are widely spread in the Chhindwara, Betul and others district of Madhya Pradesh, Bastar district of Chhattisgarh and also in the parts of Maharashtra, Andhra Pradesh, and Orissa. Gonds are one of the largest tribal group in the world. The main dialect of Gonds is Gondi boli which is related to Telugu and the other Dravidian languages. In the northern parts, Gonds are often seen speaking Hindi and Marathi while in the southern parts Parsi or Persian is the frequently used language. Gonds are mainly divided into four tribes namely – Raj Gonds, Madia Gonds, Dhurve Gonds, Khatulwar Gonds. Gonds have been largely influenced by the Hindus and for the long time have been practicing the Hindu culture and traditions.
A molecular study (Chaubey et al., 2017) based on allele frequency and haplotype revealed that the Gond share genetic ancestry with the Indian Austroasiatic (ie, Munda) groups, rather than with different Dravidian groups to whom they are most closely related linguistically and The haplotype based analysis (Chaubey et al., 2015) suggested the genome sharing Gond with among Bhil, Kol and with other ethnic groups of South Asian descent.
Although, recently studies (Thakur and Singh 2017; Sharma 2017) were done on Gond tribes but in present investigation we have selected different most Gond tribe populated districts of the state. The present biochemical study was planned to characterize genetically the Gond tribe. They are endogamous population groups, having their own unique culture and language. Although serological studies have been done on some tribes but biochemical genetic markers are still to be examined. There is no previous report on the extensive study of blood genetic markers in Gond of Hoshangabad district of Madhya Pradesh.
| Table 1: Distribution of A1A2BO blood groups in various Scheduled Tribe and Non Tribal populations of Madhya Pradesh and Neighboring States. | ||||||||||
| S. No. | NAME OF
POPULATION |
N |
ALLELE FREQENCIES OF DIFFERENT BIOCHEMICAL GENES | REFERENCES | ||||||
| A1 | A2 | B | O | RHD | RHd | |||||
| MADHYA PRADESH | ||||||||||
| 1. | GOND | 200 | 0.2041 | 0.01 | 0.2811 | 0.5048 | 0.8586 | 0.1414 | Present study (n=200) | |
| 2. | HINDU | 175 | 0.167 | 0.0294 | 0.2503 | 0.5533 | 0.7732 | 0.2268 | Roberts et al., 1974 | |
| 3. | MUSLIM | 168 | 0.1869 | 0.033 | 0.2587 | 0.5214 | 0.8457 | 0.1543 | Roberts et al., 1974 | |
| 4. | BHIL MP | 145 | 0.219 | 0.025 | 0.221 | 0.535 | 0.8339 | 0.1661 | Papiha et al., 1978 | |
| 5. | KEER | 131 | 0.0705 | 0 | 0.3368 | 0.5926 | 0.9126 | 0.0874 | Bharti et al., 2007 | |
| GUJARAT | ||||||||||
| 6. | VANIA SONI | 267 | 0.1791 | 0.0138 | 0.2478 | 0.5593 | 0.703 | 0.297 | Undevia et al., 1978 | |
| 7. | GHANCHI | 58 | 0.255 | 0.051 | 0.254 | 0.44 | 0.7726 | 0.2274 | Papiha et al., 1981 | |
| 8. | KUNBI | 116 | 0.146 | 0.016 | 0.249 | 0.589 | 0.7543 | 0.2457 | Papiha et al., 1981 | |
| 9. | ANAVIL | 50 | 0.189 | 0.013 | 0.213 | 0.585 | 0.6536 | 0.3464 | Papiha et al., 1981 | |
| 10 | MUSLIM GUJRAT | 65 | 0.19 | 0.01 | 0.269 | 0.531 | 0.6962 | 0.3038 | Papiha et al., 1981 | |
| 11. | VASAVA | 71 | 0.22 | 0.013 | 0.185 | 0.582 | 0.7626 | 0.2374 | Bhasin et al., 1985 | |
| 12. | KOTWALIA | 102 | 0.158 | 0.019 | 0.315 | 0.508 | 0.7797 | 0.2203 | Bhasin et al., 1985 | |
| 13. | GAMIT | 261 | 0.282 | 0.031 | 0.227 | 0.46 | 0.7297 | 0.2703 | Bhasin et al., 1985 | |
| RAJASTHAN | ||||||||||
| 14. | BHIL | 92 | 0.14 | 0.027 | 0.231 | 0.602 | 0 | 0.2085 | Kumar et al., 1999 | |
Material and Methods
The present genetic study was based on Biochemical and Serological markers for which the blood samples were collected at random from a total of 200 apparently healthy and not closely related individuals of either sex, of the Gonds of Hoshangabad, Betul and Sehore districts of Madhya Pradesh. About 0.5 ml of blood samples were collected by finger prick method into EDTA-K2 vials, kept in thermo cool icebox and transported to the laboratory within 3-4 days. The samples were analyzed for phenotypes of A1A2BO and Rh (D) blood groups by standard tube method and for red cell enzymes by electrophoresis (Bhasin M.K. and Chahal, S.M.S.,1996). For this purpose haemolysates were prepared using freezing and thawing method and stored at -20ºC in the freezer. Prepared haemolysates were used for isoenzyme typing by biochemical technique of electrophoresis and specific staining protocols. Typed red cell enzymes were Adenosine Deaminase (ADA), Acid Phosphatase locus 1 (ACP1), Phosphoglucomutase locus 1 (PGM1), Esterase D (ESD), Adenylate kinase locus 1 (AK1) and Glucosephosphate isomerase (GPI).
Results and Discussion
The distribution of two blood groups and four biochemical markers in Gond tribe are presented in table 1. In A1A2BO, the frequency of A1 allele in Gond is found to be 20.41% while a low value (7.05%) has been recorded in Keer tribe (Bharti et al., 2007) but on the other hand showed partial variation with the Gond tribe (17%) of Anuppur and Dindori districts of MP (Thakur S. and Singh H.S., 2017), whereas Bharti et al., (2007) reported high incidence of allele B in Keer (33.68%) and low in Gond (28.11%) were observed. The allele frequency of A1 in Gond is similar to that of Bhil (21.9%) and Gond (20.1%) of Ambikapur district (Bhatia et al.,1986). On comparison with the caste population, it revealed that, the A1 allele frequency of Gond tribe is greater than Hindu (15.91%) and Muslim (18.39%) of Indore (Roberts et al., 1974). The percentage frequency of A2 allele in Gond has been found to be 1.0 %, which is the lowest recorded incidence in any tribal population, but it is noteworthy that it is totally absent in Keer (Bharti et al., 2007) while recorded high (2.0%) in Gond tribe of Anuppur and Dindori districts of Madhya Pradesh (Thakur and Singh 2017). The distribution of allele frequencies of allele O in Gond shows approximate similarity with earlier data of the tribes. In case of Rh blood group, only one case has been found to be Rh negative in Keer of neighboring district Sehore while in Gond tribe four cases has been recorded . In contrast to the caste population of the State these frequencies are lower than those recorded in Sunni (25.2%), Shia (27.7%), Bohra (28.28%) and Brahmin (18.26%), endogamous group of Hoshangabad district (Khan et al., 1985).
| Table 2: Distribution of Red cell Enzymes polymorphism in the Gond Tribe of Madhya Pradesh. | |||||||
| S. No. | Gene | n | Phenotypes | Number Observed | Allele | Allele frequencies | ÷2 (H.-W.) |
| 1. | ADA | 145 | 1 | 126 | ADA*1 | 0.9345 |
0.003 |
| 1,2 | 19 | ADA*2 | 0.0655 | ||||
| 2 | 0 | ||||||
| 2. | AK1 | 189 | 1 | 167 | AK1*1 | 0.9418 |
0.003 |
| 1,2 | 22 | AK2*2 | 0.0582 | ||||
| 2 | 0 | ||||||
| 3. | ESD | 196 | 1 | 79 | ESD*1 | 0.5995 |
1.040 |
| 1,2 | 77 | ESD*2 | 0.4005 | ||||
| 2 | 40 | ||||||
| 4. | PGM1 | 196 | 1 | 94 | PGM1*1 | 0.6856 |
0.087 |
| 1,2 | 78 | PGM2*2 | 0.3144 | ||||
| 2 | 22 | ||||||
| 5. | ACP1 | 182 | A | 13 | ACP1*A | 0.2390 |
0.413 |
| A,B | 60 | ||||||
| B | 106 | ACP1*B | 0.7527 | ||||
| A,C | 1 | ACP1*C | 0.0083 | ||||
| B,C | 2 | ||||||
| 6. | GPI | 195 | 1 | 189 | GPI*1 | 0.9846 |
– |
| 1,3 | 5 | GPI*3 | 0.0128 | ||||
| 1,7 | 1 | GPI*7 | 0.0026 | ||||
The allele frequencies obtained after the electrophoretic typing of the biochemical marker viz, Adenosine Deaminase (ADA), Acid Phosphatase locus 1 (ACP1), Phosphoglucomutase locus 1(PGM1), Esterase D (ESD), Adenylate Kinase locus 1 (AK1) and Glucosephosphate isomerase (GPI), are given in table 2, which shows great variations. From the six enzymes studied, four enzyme systems (ADA, PGM1, ESD and AK1) showed common phenotypes, while in ACP1 a rare allele ACP*C was recorded in Gond tribe despite the fact that it was totally absent not only in Keer of Betul, but also in Korku of Pachmarhi Hoshangabad (Saha et al., 1987) and Bhils of Jhabua (Papiha et al., 1978). In case of GPI, rare variant (GPI*1-7) was recorded in Gond Tribe of Hoshangabad of the state. The comparison of allele frequencies of Gond tribe with other caste and tribal populations of the state is shown in table 3. The allele frequencies of ADA*1 (0.9345), PGM1*1(0.6856), ACP1*A (0.239) and AK1*1 (0.9417) in Gond are approximately similar from Bhil of Jhabua {ADA*1 (0.921), PGM1*1(0.704), ACP1*A (0.201) and AK1*1 (0.959)} (Papiha et al., 1978).
Heterozygosity (H)
Table 4 shows the locus–wise and population–wise estimates of heterozygosity (h) in the Gond and erlier studied caste and tribal populations of Madhya Pradesh. There was great heterogeneity in h values over the loci in the Gond material, varying from as low as 0.0304 at GPI locus to as high as 0.6244 at A1A2BO locus. Thus, analysis of heterozygosity, a measure of genic variation, revealed that in the present Scheduled Tribe material GPI was the least variable locus and A1A2BO was the most variable locus.
| Table 3: Distribution of Allele frequencies of Red Cell Isozymes in various tribal and non tribal populations of Madhya Pradesh and neighboring states. | |||||||||||
| S. No. | NAME OF POPULATION | ALLELE FREQENCIES OF DIFFERENT BIOCHEMICAL GENES | REFERENCES | ||||||||
| AK1 | AK2 | ESD1 | ESD2 | PGM1 | PGM2 | ACPA | ACPB | ACPC | |||
| 1 | GOND | 0.9418 | 0.0582 | 0.5995 | 0.4005 | 0.6856 | 0.3144 | 0.239 | 0.7527 | 0.0083 | Present study |
| 2 | HINDU | 0.901 | 0.099 | 0 | 0 | 0.7241 | 0.273 | 0.3103 | 0.6868 | 0.0029 | Roberts et al., 1974 |
| 3 | MUSLIM | 0.902 | 0.098 | 0 | 0 | 0.7256 | 0.2744 | 0.3282 | 0.6687 | 0.0031 | Roberts et al., 1974 |
| 4 | BHIL MP | 0.9586 | 0.0414 | 0.793 | 0.207 | 0.7042 | 0.2958 | 0.1993 | 0.8007 | 0 | Papiha et al., 1978 |
| 5 | KEER | 0.8931 | 0.1069 | 0.8931 | 0.1069 | 0.8511 | 0.1489 | 0.3228 | 0.6712 | 0 | Bharti et al., 2007 |
| 6 | VANIASONI | 0.8774 | 0.1226 | 0.8452 | 0.1548 | 0.6502 | 0.3498 | 0.2595 | 0.7405 | 0 | Undevia et al., 1978 |
| 7 | GHANCHI | 0.956 | 0.044 | 0.873 | 0.127 | 0.634 | 0.357 | 0.364 | 0.646 | 0 | Papiha et al., 1981 |
| 8 | KUNBI | 0.918 | 0.082 | 0.811 | 0.189 | 0.665 | 0.326 | 0.274 | 0.713 | 0.013 | Papiha et al., 1981 |
| 91 | ANAVIL | 0.928 | 0.072 | 0.84 | 0.16 | 0.714 | 0.286 | 0.357 | 0.643 | 0 | Papiha et al., 1981 |
| 10 | MUSLIM GUJRAT | 0.918 | 0.082 | 0.815 | 0.185 | 0.667 | 0.325 | 0.254 | 0.738 | 0.008 | Papiha et al., 1981 |
| 11 | VASAVA | 0.923 | 0.077 | 0.773 | 0.227 | 0.758 | 0.242 | 0.103 | 0.862 | 0.035 | Bhasin et al., 1985 |
| 12 | KOTWALIA | 0.977 | 0.023 | 0.908 | 0.092 | 0.82 | 0.18 | 0.244 | 0.722 | 0.033 | Bhasin et al., 1985 |
| 13 | GAMIT | 0.965 | 0.035 | 0.866 | 0.134 | 0.673 | 0.327 | 0.265 | 0.721 | 0 | Bhasin et al., 1985 |
| 14 | BHIL RAJ. | 0.889 | 0.111 | 0.793 | 0.207 | 0.759 | 0.241 | 0.259 | 0.741 | 0 | Kumar et al., 1999 |
| Table 4: Heterozygosity (h) estimates in the present tribe and earlier studied Caste populations of Madhya Pradesh. | ||||||
| Locus | Caste | Scheduled Tribe | Locus-wise Average heterozygosity (H) | |||
| Muslim | Hindu | Gond | Bhil | Keer | ||
| A1A2BO | 0.6297 | 0.6028 | 0.6244 | 0.6163 | 0.5304 | 0.6007 |
| RH(D) | 0.2610 | 0.3507 | 02428 | 0.2770 | 0.1595 | 0.2582 |
| ADA | – | – | 0.1224 | – | 0.1909 | – |
| AK1 | 0.1768 | 0.1784 | 0.1096 | 0.0793 | 0.1909 | 0.1470 |
| ESD | – | – | 0.4802 | 0.3283 | 0.3986 | – |
| PGM1 | 0.3982 | 0.4012 | 0.4311 | 0.4166 | 0.2535 | 0.3801 |
| ACP1 | 0.4451 | 0.4319 | 0.3763 | 0.3192 | 0.4410 | 0.4027 |
| GPI | – | – | 0.0304 | – | 0.0076 | 0.0127 |
Nei’s Gene Diversity Analysis
Estimates of the various measures of gene diversity (Nei, 1973) viz., HT, HS and GST among (Based on five loci) the present Tribe and earlier studied populations of Madhya Pradesh are set out in Table 5. The table shows that the intra–subpopulational gene diversity (HS) varied widely (range 0.1446447 at AK1 locus to 0.5997652 at A1A2BO locus). As for the inter–subpopulational gene diversity (DST), it ranged from a low of 0.0037303 at AK1 locus to a high of 0.0063573 at PGM1 locus. Thus, it is clear that the gene diversity between populations (0.004773386) was much lower than the gene diversity within them (0.357364). As for the coefficient of gene differentiation (GST), the values were quite variable over loci (range 0.0072951 – 0.02514102 ), A1A2BO being the least differentiated locus and AK1 being the most differentiated locus among the Tribal and Caste populations of Madhya Pradesh (Table 5).
| Table 5: Genetic differentiation in the present studied Gond tribe and earlier studied Tribal and Castes population of Madhya Pradesh – estimates by Nei’s GST. | ||||
| Genetic locus | Gene diversity in total population (HT) |
Intra-subpopulational gene diversity | Inter-subpopulational gene diversity | Coefficient of gene differentiation
(GST) |
| (Hs) | (DST) | |||
| A1A2BO | 0.6041727 | 0.5997652 | 0.0044075 | 0.0072951 |
| RH(D) | 0.2622226 | 0.2582126 | 0.00401 | 0.01529235 |
| AK1 | 0.1483750 | 0.1446447 | 0.0037303 | 0.025141027 |
| PGM1 | 0.3869012 | 0.3805439 | 0.0063573 | 0.01643132 |
| ACP1 | 0.40892743 | 0.4035656 | 0.00536183 | 0.013111935 |
| Average | 0.362119786 | 0.3573464 | 0.004773386 | 0.013181787 |
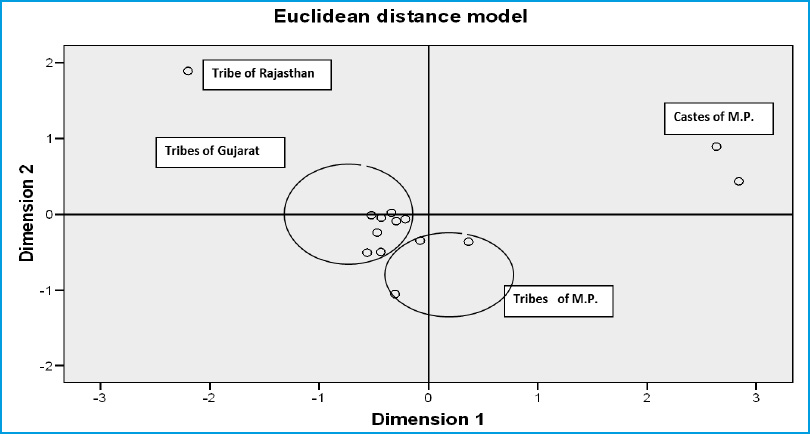
Nei’s genetic distance (D) and Eulclidean model analysis
Genetic relationships among the present studied Gond tribe and earlier studied tribal and Caste Populations of Neighboring States of Gujarat (Papiha et al., 1981; Bhasin et al.,1985 and Undevia et al., 1978) and Rajasthan (Kumar et al.,1999) presented in figure 1 and 2 (Based on Six common Genetic Markers). These figures show that the Hindu and Muslim separated out from the Tribal population of all the studied States. Rajasthan Bhil showed a single line subcluster, the latter tribes were placed together in an another subcluster. In edition all the Tribes of Gujrat and Madhya Pradesh showed close genetic affinities. The chi square (÷2) test depicted that serological and biochemical ( ADA, PGM1, ACP and AK1) markers are in genetic equilibrium as the differences between observed and expected frequencies are statistically not significant, except for ESD where the (÷2) value is statistically significant.
Conclusion
The present serological markers study concludes with the low incidence of A1 allele and high of B and presence of A2 allele in few cases of Gond of Hoshangabad District. On the other hand Rh negative allele was found higher in Gond. In Biochemical trait, presence of less common phenotype in ACP i.e. ACP*C and GPI (GPI*7) were recorded The allele frequencies of ADA, PGM1, ACP1 and AK1 indicate closeness between Gonds of Hoshangabad, Bhil and Korku of Hoshangabad district of M.P. (Pachmarhi) but different from Keer of neighboring district. Gond tribe has genetic affinities with tribes of M.P. and Gujarat but great distance showed against Caste population of M.P. and tribal population of Rajasthan. The present study will help to characterize genetically the Gond tribe of Madhya Pradesh.
Acknowledgements
Authors acknowledge gratefully to the subjects who voluntarily donated their blood samples for this study. We are also thankful to the authorities of Department of Zoology, Govt. M.V.M., Bhopal and Department of Human Biology, Punjabi University, for providing their lab facilities in this study.
Conflict of Interest
None, all authors equally contributed to this research work
References
- Census of India. (2011). Basic data sheet [table]. Available at Census 2011 – Madhya Pradesh
- Chaubey, G., Tamang, R., Pennarun, E., Dubey, P., Rai, N., Upadhyay, R.K., Meena, R.P., Patel, J.R., van Driem, G., Thangaraj, K. and Metspalu, M.(2017) Reconstructing the population history of the largest tribe of India: the Dravidian speaking Gond European. Journal of Human Genetics Issue/Volume: in press.
- Chaubey, G., Kadian, A., Bala, S., & Rao, V. R. (2015). Genetic Affinity of the Bhil, Kol and Gond Mentioned in Epic Ramayana. PLoS ONE, 10(6)
- Thakur S and Singh HS. (2017) Distributions of A1A2BO and Rh blood group among Gonds and Panikas of Madhya Pradesh. The Anthropologist.,Volume 18, Pages 1123-1124
- Sharma S (2017) Genetic Variation of ABO Blood Groups among Three Endogamous Tribal Populations of Chhattisgarh, Central India. The Anthropologist Pages 765-766.
- Bhasin M.K. and Chahal, S.M.S. (1996) A Laboratory Manual for Human Blood Analysis. Kamla-Raj Enterprises, Delhi.
- Bharti D, Chaudhary R, Chahal S.M.S. and Sharma G ,(2007) The distribution of serological and biochemical markers in the Keer tribe of the Madhya Pradesh .Asian J.Exp.Sci.,Vol. 21, No. 2, 337-340.
- Bhatia, H.M., Rao, V.R., Vasantha, K., Sathe, M.S. and Mishra, R.P.(1986) A1A2BO, MN, Rh blood groups among Gond, Oeaon and Kawar tribal groups of Ambikapur district, Madhya Pradesh. J. Ind. Anthrop. Soc., 21: 73-77.
- Roberts, D.F., Papiha, S.S., Green, C.K., Chhaparwal, B.C. and Mehta, S. (1974) Red cell enzyme and other polymorphic system in Madhya Pradesh, central India. Ann. Hum. Biol., 1:159-174.
- Khan, M.F.H., Khatoon, S., Choube, R. and Balakrishnan, V. (1985) Relationship among three Muslim and one Hindu endogamous groups of Madhya Pradesh. 1. Genetic distance analysis. Acta Anthropogenet., 9: 214-224.
- Saha, N. and Goswami, H.K.(1987) Some blood genetic markers in Korkus of Central India. Hum. Hered., 37: 273-277.
- Papiha, S.S., Roberts, D.F.Mukerjee, D.P., Singh, S.D. and Malhotra, M. (1978) A genetic survey in the bhil tribe of Madhya Pradesh, Central India. Am. J. Phys. Anthrop. 49: 176-
185. - Papiha, S.S., Roberts, D.F., Shah, K.C. and Shah, A.C. (1981) A genetic study of some Gujarat populations. Acta Anthropogenet. 5: 23-40.
- Bhasin, M.K., Singh, Indera P., Sudhakar, K., Bhardwaj, V., Chahal, S.M.S., Walter, H. and Dannewitz, A. (1985) Genetic studies in four tribal populations of the Surat district , Gujarat (India). Ann. Hum.Biol. 12: 27-39.
- Undevia, J.V., Balakrishnan, V., Kirk, R.L., Blake, N.M., Saha, N. and McDermid, E.M. (1978) A population genetic study of the Vania Soni in western India. Hum. Hered. 28 : 104-121.
- Kumar, S., Kushwaha, K.P.S., Rao, M.B. and Bhasin, M.K.(1999) Serogenetic characterization of the Bhil tribe of Rajasthan. Anthropologist 1 : 57-60.

