Vyatka State University, Kirov, Russia.
Article Publishing History
Received: 13/09/2021
Accepted After Revision: 25/11/2021
Ensuring a stable improvement in the quality and standard of living of the rural population allows preserving the social and economic potential of rural areas. Effective management can ensure the implementation of social control and development of rural areas, the preservation of ecology, which ultimately contributes to the preservation of sustainable development of agricultural territories. The purpose of the study: To determine the directions and effective level of increasing the production of agricultural and livestock products aimed at preserving the sustainable development of agricultural territories. A correlation and regression analysis was carried out in the study to determine the promising directions of the northern districts of the Omsk region (Russia) to increase the effectiveness of strategic planning for the sustainable development of agricultural territories.
Sustainable development of the regions, according to the authors, is impossible without increasing the level of well-being, therefore, the authors identified such areas for development as the cultivation of fodder crops, the cultivation of livestock and poultry (for slaughter), the cultivation of poultry for meat and the production of honey. The authors concluded that it is necessary to increase the production volumes of the selected promising areas for the development of agriculture by at least 5% to 13% per year, depending on the direction. There will be an increase in profit only at these values, which is one of the important factors contributing to the sustainable development of the areas allocated for research.
Agriculture, Correlation, Ecology, Regression Analysis.
Makarova T, Domenko Y. Promising Directions in Strategic Planning of Sustainable Development of Agricultural Territories. Biosc.Biotech.Res.Comm. 2021;14(4).
Makarova T, Domenko Y. Promising Directions in Strategic Planning of Sustainable Development of Agricultural Territories. Biosc.Biotech.Res.Comm. 2021;14(4). Available from: <a href=”https://bit.ly/3d2ZFbL“>https://bit.ly/3d2ZFbL</a>
Copyright © Makarova and Domenko This is an open access article distributed under the terms of the Creative Commons Attribution License (CC-BY) https://creativecommns.org/licenses/by/4.0/, which permits unrestricted use distribution and reproduction in any medium, provide the original author and source are credited.
INTRODUCTION
The strategic planning tool is the process of collecting information and processing it using various scientific methods to solve analytical problems in the field of strategic management. Since each region has its peculiarities of development, it is necessary to select the most universal tools for strategic planning of the region. It is necessary to identify tools for the development and implementation of regional policy in a fairly large array of tools that are applicable in the framework of strategic planning.
The relevance of scientific research is due to the need to develop software tools for strategic planning of the development of agricultural territories. The lack of tools reduces the level of effective management of agricultural territories. In particular, in situations where prompt decision-making on the development of agricultural territories is required to increase their level of sustainable development, solve human welfare problems, preserve the biological environment and reduce the possibility of environmental threats (Dvoichenkova et al. 2021).
To date, there are many traditionally used tools in the system of strategic planning of socio-economic development of territories, such tools include SWOT analysis, PEST analysis, M. Porter’s five forces analysis, BCG matrix, methods of system analysis, etc. (Kopylova 2019). In our opinion, not all the proposed tools can have a proper impact on the socio-economic development of territories in modern conditions despite a considerable number of scientific publications on the strategic planning of territories (Yatsenko et al. 2020; Germanovich et al. 2020). The main purpose of the article is to use correlation and regression analysis as a tool for determining promising directions in strategic planning of sustainable development of agricultural territories.
MATERIAL AND METHODS
We proposed the use of the method of correlation and regression analysis as a tool for determining promising areas in the strategic planning of territories. Correlation analysis and regression analysis were used to study the statistical dependence of several random variables based on sample data.
In strategic planning, these methods was used at the stage of developing forecasts of socio-economic development. Correlation analysis allowed inferring the strength of the relationship between data pairs x and y and uses regression analysis to predict one variable (y) based on another variable (x). In other words, in this case, it was possible to identify a causal relationship between the analyzed aggregates (Tereshchenko et al. 2012). Regression analysis distributes the roles between the studied characteristics − the first of them was an argument, and the second is a function.
The predicted variable (function) is denoted as y, and the variable used for such prediction (argument or factor) as x. The characteristic of the constraint force based on the pair correlation coefficient shows that there is no constraint at a coefficient of up to 0.3, the constraint was weak from 0.3 to 0.5, noticeable from 0.5 to 0.7, the constraint is strong from 0.7 to 0.9, and very strong from 0.9 to 0.99 (Baraz 2005). In this study, the method of correlation and regression analysis was carried out concerning two northern districts (Bolsheukovsky and Bolsherechensky districts) of the Omsk region (Russia). The results obtained served as the basis for constructing a linear function, which makes it possible to determine promising directions for each municipality in the field of agriculture (Tereshchenko et al. 2012).
RESULTS AND DISCUSSION
Figure 1: shows the schemes of correlation and regression analysis.
Figure 1:Schemes of correlation and regression analyses
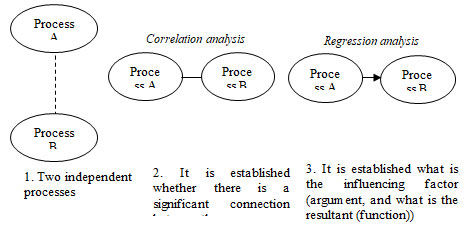
Figure 1 shows that in the first case two completely independent processes do not depend on each other and even more so do not affect each other. The process of correlation analysis was considered in the second case, which allows determining the significance of the interprocess communication. It was established in the third case of regression analysis what is the influencing factor (argument) and what is the resultant (function) (Germanovich et al. 2020).
The results of the calculations performed on the example of two northern districts of the Omsk region are presented in Table 1, 2 and Figure 2. The results of the regression analysis of the indicators of the agricultural sector of the Bolsherechensky district are presented in Table 1.
Table 1. Regression analysis results of Bolsherechensky district
| Regression statistics | |||||||
| Multiple R | 0.759273 | ||||||
| R-square | 0.576496 | ||||||
| Normalized R-square | -0.27051 | ||||||
| Standard error | 13,173.79 | ||||||
| Observations | 10 | ||||||
| Analysis of variance | |||||||
| df | SS | MS | F | F Significance | |||
| Regression | 6 | 708,730,503.6 | 118,121,750.6 | 0.680626 | 0.685675 | ||
| Balance | 3 | 520,645,890.5 | 173,548,630.2 | ||||
| Total | 9 | 1,229,376,394 | |||||
| Coefficients | Standard error | t-statistics | P-value | Lower 95% | Upper 95% | Upper 95.0% | |
| Y-intersection | 46,527.5 | 242,648.6872 | 0.191748425 | 0.860184 | -725,689 | 818,743.9 | 8,217,289 |
| Technical crops, hectares | -7.50574 | 13.27819842 | -0.565267783 | 0.611406 | -49.7629 | 34.75142 | 465.8034 |
| Cattle and poultry for slaughter (slaughter weight), tons | 20.05001 | 50.7424937 | 0.395132437 | 0.719164 | -141.435 | 181.5353 | 1,562.552 |
| Cattle, tons | -93.0692 | 68.27955297 | -1.36306089 | 0.266151 | -310.365 | 124.2268 | 1,857.085 |
| Poultry, tons | 128.5035 | 156.167652 | 0.822856084 | 0.470901 | -368.492 | 625.4987 | 3,024.157 |
| Honey, tons | 2,540.029 | 4,445.23048 | 0.571405547 | 0.607728 | -11,606.7 | 16,686.74 | 93,773.51 |
The main indicators of the activity of agricultural enterprises in the northern districts of the Omsk region were laid down as the main indicators underlying the correlation and regression analysis, which are considered in the context of the crop production industry and the livestock industry. When conducting this analysis, it was also possible to determine the most promising industry for them not only in the context of municipalities but in the northern regions and the region as a whole. Based on the results obtained, the linear function will be as follows:
y = 46,527.5 – 7.5 *X1 +0.41 *X2 + 20.05 * X3 – 93.06 * X4 + 128.50* X5 +2,540.02 * X6
The resulting indicator in the subsequent calculations is the profit indicator of agricultural enterprises in the region. The coefficient of determination R2 was 0.57, which indicated the reliability of the results obtained since the value was higher than the standard 0.5. The results of the regression analysis of the indicators of the agricultural sector of the Bolsheukovsky district are presented in Table 2.
Table 2. Results of regression analysis of Bolsheukovsky district
| Regression statistics | |||||||
| Multiple R | 0.870236953 | ||||||
| R-square | 0.757312355 | ||||||
| Normalized R-square | 0.611699768 | ||||||
| Standard error | 652.4313585 | ||||||
| Observations | 9 | ||||||
| Analysis of variance | |||||||
| df | SS | MS | F | F Significance | |||
| Regression | 3 | 6,641,513 | 22,213,838 | 5.200,871,51 | 0.0537159 | ||
| Balance | 5 | 2,128,333 | 425,666.7 | ||||
| Total | 8 | 8,769,846 | |||||
| Coefficients | Standard error | t-statistics | P-value | Lower 95% | Upper 95% | Upper 95.0% | |
| Y-intersection | 6,329.223301 | 1,820.703 | 3.476252 | 0.017,729,92 | 1,648.9561 | 11,009.49 | 1,648.956 |
| Milk, tons | -0.793855302 | 0.367252 | -2.16161 | 0.083,0178,7 | -1.7379059 | 0.150195 | -1.73791 |
| Wool, tons | -1,055.342724 | 542.5966 | -1.94499 | 0.190,937,015 | -2,450.1316 | 339.4462 | -2,450.13 |
| Honey, tons | 18.16580847 | 71.6226 | 0.253632 | 0.80,987,871 | -165.94594 | 202.2776 | -165.946 |
Based on the results obtained, the linear regression analysis function of the Bolsheukovsky district will be as follows:
y = 6,329.22 – 0.79 *X1 – 10,055.34 *X2 + 18.16 * X3
The coefficient of determination R2 was 0.75, which also indicated the reliability of the results obtained since the value was higher than the standard 0.5. The results of the regression analysis and the linear functions obtained on its basis allowed determining the most promising areas for agricultural sectors in the context of each municipality.
A regression analysis method was applied to determine the promising areas of economic activity for the considered districts of the Omsk region, which allowed determining the most significant areas of activity of agricultural enterprises in these districts of the Omsk region, which affect the dependent variable – profit. At the initial stage, the necessary information was collected on the activities of agricultural enterprises in the areas under consideration (Germanovich et al. 2020).
The “profit” indicator is used as a dependent variable (Y) – a variable describing the effectiveness of processes (Table 3).
Table 3. Results of correlation analysis
| Bolsherechensky | Bolsheukovsky | |||
| Correlation
coefficient |
constraint | Correlation
coefficient |
constraint | |
| Profit | 1 | – | 1 | – |
| Grain and leguminous crops, tons | 0.191 | Weak | -0.215 | Weak |
| Technical crops, ha | 0.044 | Weak | -0.152 | Weak |
| Fodder crops, ha | -0.358 | average | 0.168 | Weak |
| Potatoes, t | 0.285 | Weak | -0.602 | Average |
| Vegetable and berry crops, t | 0.229 | Weak | -0.356 | Average |
| Cattle and poultry for slaughter, t | 0.048 | Weak | 0.033 | Weak |
| Cattle, tons | -0.202 | Weak | 0.049 | Weak |
| Pigs, t | 0.210 | Weak | 0.006 | Weak |
| Sheep and goats, t | -0.340 | average | -0.186 | Weak |
| Poultry, t | 0.157 | Weak | 0.249 | Weak |
| Milk, t | 0.128 | Weak | -0.405 | Average |
| Wool, t | -0.282 | Weak | -0.233 | Weak |
| Eggs, thousand pcs. | 0.015 | Weak | 0.171 | Weak |
| Honey, t | 0.191 | Weak | -0.232 | Weak |
As part of the identification of promising areas and new projects for the development of agriculture in the northern regions of the Omsk region, it was important to consider their effectiveness. One of the performance indicators was profit, its growth. The cultivation of poultry for meat and the production of honey, cultivation of fodder crops, the cultivation of livestock and poultry (for slaughter) were identified in the Bolsherechensky district, based on correlation analysis to assess the impact on profit. We presented the data of the calculation of profit growth as a result of the development of promising areas of agriculture in the Bolsherechesnky district of the Omsk region. Figure 2 shows the dynamics of profit generation by agricultural organizations and farms of the Bolsherechensky district as a result of the development of promising areas (Germanovich et al. 2020).
Figure 2: Dynamics of profit generation by agricultural organizations and farms
of Bolsherechensky district as a result of development
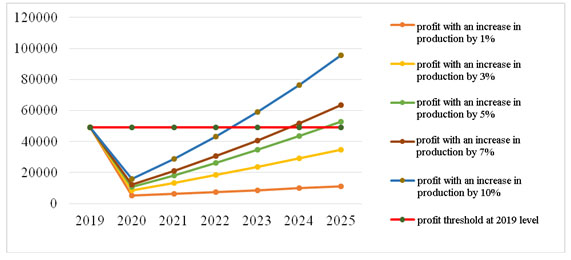
As a result of the analysis, it can be concluded that, in aggregate, the development of promising areas of agriculture allocated for the district was possible if funds were invested in increasing production in the amount of 7 percent or more. With an increase in production below the threshold value, which was determined by the level of 2019, it was possible not to get a positive result. There was no increase in profit and its increase to the level of 2019 until 2025 with an annual increase in production volumes by 1% and 3%.
Thus, it was recommended to increase the production volumes of the selected promising areas of agricultural development by at least 5% per year. Otherwise, there was no return on the invested funds for the development of promising areas. Figure 3 shows the dynamics of profit generation by agricultural organizations and farms of the Bolsheukovsky district as a result of the development of such promising areas as honey production (Piltakyan and Mokrushin 2020).
Figure 3: Dynamics of profit generation by agricultural organizations and farms of Bolsheukovsky
district as a result of the development of promising areas, thousand rubles.
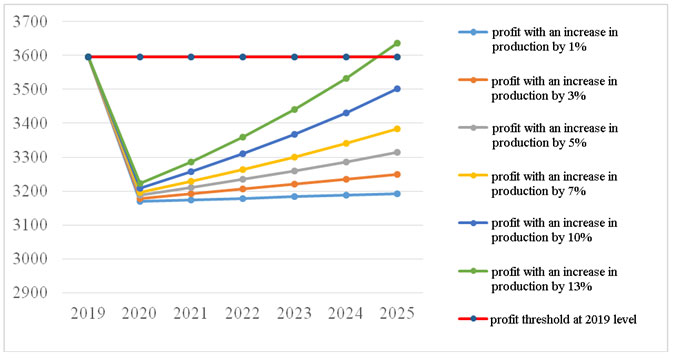
There was no increase in profit and its increase to the level of 2019 until 2025 with an annual increase in production volumes by 1%, 3%, 5%, 7%, and 10%. Thus, it was recommended to increase the production volumes of the selected promising areas of agricultural development by at least 13% per year. Piltakyan and Mokrushin (2020) determine that the rational use of strategic planning tools in public administration would not only significantly increase the efficiency of using budget funds, but also the effectiveness of strategic planning subjects.
Chupina, Zarubina and Simachkova (2020) defined the need to develop effective tools and mechanisms for managing the development of the region, and their implementation in the strategic planning system reflected in strategic documents at the regional level. Shpakova (2019) assessed the level of socio-economic development of the region in the context of the effectiveness of strategic planning and the quality of strategic documents. Thus, the author argued that for further development it is necessary to determine objective potential opportunities, main trends, risks, and, in general, the basis on which this development will be carried out (Shpakova 2019; Chupina, Zarubina and Simachkova 2020; Piltakyan and Mokrushin 2020).
The very assessment of the results achieved should answer the question about the effectiveness of the methods and tools that were used in the implementation of the previous strategic plan. We cannot but agree with Shpakova (2019) that such “work on mistakes” will allow choosing the right tools for the implementation of the new strategic plan. Valentik (2018) identified “points of growth” as the tools of strategic planning at the regional level (Valentik 2018; Shpakova 2019). The author argued that the theory and methodology of strategic planning developed based on the current Federal Law “On Strategic Planning in the Russian Federation” do not define clear contours of such a category as “points of growth”.
This category would make it possible to actively use the ways to boost the economy of the regions, which defined it as one of the main tasks of the spatial vector of strategic planning in the country (Valentik 2018). Suglobov et al. (2017) highlighted the need to ensure the economic security of the country’s regions within the framework of planning the development of the territory. Therewith, it was necessary to use characteristic and accessible tools for this concerning a specific territory (Suglobov et al. 2017).
Rastvortseva (2010) used a multifactorial regression model in her research, which allowed determining the reasons for the deviation of the socio-economic efficiency of individual regions from the average level for the surveyed population (Rastvortseva 2010). Makarova (2019) in her research used the regression analysis method, which allowed determining priority strategic directions for improving the level of economic security of the region (Mnakarova 2019).
The analysis of literary sources allows talking about a broad consideration of strategic planning tools in economics, but despite this, the consideration of correlation and regression analysis as a tool for determining promising directions in strategic planning of territories was not considered in a direct aspect. It should also be noted that correlation and regression analysis was not used in modern strategic documents at the regional level (Slepov et al. 2021).
As the theoretical and practical results of the study devoted to the problem of strategic planning of sustainable development of agricultural territories show, there was no common point of view among specialists in approaches to defining tools concerning the management of the region. Quite often we observed that the main approaches and techniques used in foreign practice in the formation of regional development strategies are copied without adaptation to the situation in Russia (Kiseleva et al. 2019).
We believed that the use of strategic planning tools for regional development is conditioned by the need to analyze environmental factors and select strategic development goals. As a rule, regional development tools allow economic entities to fully explore the prospects for entering other regional markets, as well as assess the risks associated with choosing priorities for regional development and sustainable development of agricultural territories (Slepov et al. 2021).
In our opinion, the use of correlation and regression analysis as a tool for determining promising directions in strategic planning of the northern districts of the Omsk region can be the main one for operational support of the effectiveness of decision-making. Based on the data obtained as a result of the study, we identified areas that have the potential for development and, accordingly, improvement of the socio-economic situation in the region as a result of taking into account the results obtained when developing strategic plans for the municipal district.
Thus, the use of this tool would increase the level of sustainable development of agricultural territories of municipal districts in particular and the region as a whole. The results of the study presented by us show that the scientific determination of promising areas of agriculture, as well as the determination of thresholds for increasing production volumes, will allow obtaining a positive result in the socio-economic sustainable development of the region. We believed that the method of correlation and regression analysis can be used in the development of strategic documents, both at the level of municipalities and at the level of the region (Slepov et al. 2021).
CONCLUSION
The findings of the present study conclude that with the use of correlation and regression analysis tools, it was possible to determine their effectiveness based on calculations carried out to determine the most promising directions in the agricultural sector for the northern regions of the Omsk region. The proposed approach to the strategic planning of the region will allow approaching the identification of promising and priority areas objectively since the analysis of socio-economic development strategies developed in the regions currently does not allow determining the degree of application of various tools in the process of developing strategies.
REFERENCES
Baraz, VR (2005). Correlation-regression analysis of the relationship between indicators of commercial activity using Excel. Ekaterinburg: State Educational Institution of Higher Vocational Education USTU–UPI.
Chupina, IP, Zarubina, EV and Simachkova, NN (2020). Strategy of socio-economic development of regions. Agrarnoe obrazovanie i nauka Vol 2 Article 14.
Dvoichenkova, GP, Chernysheva, EN, Dzyubuk, IM, et al. (2021). Environmental Culture Development In Population. Laplage em Revista Vol 7 No Extra C Pages 414-430.als.
Germanovich, AG, Vasilieva, ON, Ordynskaya, ME, et al. (2020). Impact of tourism on sustainable development of rural areas: International experience. Journal of Environmental Management and Tourism Vol 11 No 4 Pages 965-972.
Kiseleva, IA, Nevrov, II, Pikalov, AV, et al. (2019). Economic safety of the regions: Technology, trends, and risks. International Journal of Recent Technology and Engineering Vol 8 No 3 Pages 5572-5579.
Kopylova, YuV (2019). Systematization of strategic planning tools for the socio-economic development of the region. Fundamentalnye issledovaniya Vol 5 Pages 50-56.
Makarova, TV (2019). Improving the mechanism for the development of the economic security of the region on the basis of resource potential: dissertation of the candidate of economic sciences 08.00.05. Moscow.
Piltakyan, KS and Mokrushin, AA (2020). Strategic planning tools for the socio-economic development of the region In the collection: Problems and prospects of socio-economic development of the regions of the South of Russia. Collection of scientific papers based on the materials of the Sixth All-Russian Scientific and Practical Conference under scientific editorship of A.A. Tamov Pages 123-128.
Putin, V (2014). The Federal Law, 28 June 2014, no. 172-FL On Strategic Planning in the Russian Federation Available online: https://rg.ru/2014/07/03/strategia-dok.html (accessed on 25 November 2020). (In Russian).
Rastvortseva, SN (2010). Management of socio-economic efficiency of regional development: dissertation of Doctor of Economics: 08.00.05. Saint Petersburg.
Shpakova, RN (2019). Strategies for the socio-economic development of regions: from assessing the achievement of goals – to assessing effectiveness Vestnik evraziiskoi nauki Vol 11 No 2 59.
Slepov, VA, Kosov, ME, Zotov, AE, et al. (2021). An empirical approach to the regulation of regional economic interaction systems Laplage em Revista Vol 7 No Extra C Pages 439-450.
Suglobov, AE, Tolebaeva, BT and Kukeeva, MZh (2017). Application of an indicative approach in the analysis of threats to the economic security of regions Voprosy regionalnoi ekonomiki Vol 33 No 4 Pages 71-76.
Tereshchenko, OV, Kurilovich, NV and Knyazeva, EI (2012). Multivariate statistical data analysis in the social sciences. BGU Belarus.
Valentik, ON (2018). Growth points as a tool for strategies for the development of Russian regions Vestnik Vladimirskogo gosudarstvennogo universiteta imeni Aleksandra Grigorevicha i Nikolaya Grigorevicha Stoletovykh. Seriya: Ekonomicheskie nauki Vol 17 No 3 Pages 50-64.
Yatsenko, MP, Melnikova, TV, Leopa, AV, et al. (2020). Sustainable development and perspectives of universalistic trends in the modern world. Revista Inclusiones Vol 7 No 3 Pages 212-222.

