1Praj Matrix, R & D Center, Division of Praj Industries Ltd., 402/403/1098, Urawade, At: Pirangut; Taluka: Mulshi, District: Pune, Maharashtra, India.
2Department of Health and Biological Sciences, Symbiosis International Deemed University, Gram Lavale; Taluka: Mulshi, District: Pune, Maharashtra, India.
3Department of Pharmaceutical Biotechnology, Poona College of Pharmacy, Bharati Vidyapeeth Deemed University, District: Pune, Maharashtra, India.
Corresponding author email: aarohikulkarni@praj.net
Article Publishing History
Received: 04/04/2020
Accepted After Revision: 25/05/2020
Complex microbial interactions govern rumen functionality. We report use of quantitative PCR (qPCR) and rumen simulation technique to study the effect of probiotics, PF 1 and PF 2 on Prevotella ruminicola, Fibrobacter succinogenes, Ruminococcus flavefaciens, Selenomonas ruminantium, and Streptococcus bovis followed by volatile fatty acid and fiber reduction. Probiotic PF 2 up-regulated R. flavefaciens by 60.54%, down-regulated F. succinogenes, and doubled the concentration of propionic acid from 111 ± 16 mg/L to 251 ± 12.58 mg/L (P<0.05). PF 2 dosage improved the fiber digestibility; with fiber reduction from 37.42 ± 0.5 to 6 ± 0.05% w/w (P<0.05). Principal component analysis revealed a direct relationship between probiotic, days, and number of copies of targeted microbes (P<0.05). It demonstrated a positive correlation between P. ruminicola and S. bovis with butyric and propionic acids. In contrast, a strong negative correlation seen established between butyric and propionic acids with F. succinogenes and fiber content. We report that, rumen microbial shifts possess unique pattern upon probiotic interventions, revealing distinct fiber digestibility. To our knowledge; this is the first report of rumen bacterial quantification upon probiotic intervention using qPCR.
In Vitro Studies, Probiotics, Principal Component Analysis, Quantitative Pcr, Rumen, Rusitec
Aphale D, Natu A, Laldas S, Sawale S, Harsulkar A, Kulkarni A. Probiotic Composition Influences the Major Rumen Microbial Shifts and Fermentation Profile as Evaluated Using Quantitative PCR and in Vitro Rusitec System. Biosc.Biotech.Res.Comm. 2020;13(2).
Aphale D, Natu A, Laldas S, Sawale S, Harsulkar A, Kulkarni A. Probiotic Composition Influences the Major Rumen Microbial Shifts and Fermentation Profile as Evaluated Using Quantitative PCR and in Vitro Rusitec System. Biosc.Biotech.Res.Comm. 2020;13(2). Available from: https://bit.ly/2YgPxEv
Copyright © Aphale et al., This is an open access article distributed under the terms of the Creative Commons Attribution License (CC-BY) https://creativecommns.org/licenses/by/4.0/, which permits unrestricted use distribution and reproduction in any medium, provide the original author and source are credited.
INTRODUCTION
The ruminal microbial community is diverse. The ruminants possess a unique digestive system, attributed towards fibrous feed fermentation, prior to the classical enzymatic phase. The reticulorumen hosts a highly specific anaerobic microbiome, that performs fiber degradation and is critically influenced by microbial and biochemical characteristics of the rumen. Phyla Bacteroidetes and Firmicutes dominate among bacterial, archaeal, fungal, and protozoal species Fibrobacter succinogenes, Ruminococcus flavefaciens, Ruminococcus albus, Butyrivibrio fibrisolvens, Prevotella ruminicola, Streptococcus bovis, and Eubacterium ruminantium display major fibrolysis functions. Where, non-fibrolytic Selenomonas ruminantium has association with fibrolytic bacteria. The rumen microbiome complexity uplifts their sensitivity to environmental factors (Ghorbani et al., 2002, Weimer 2015).
In this context, an intensive farming practice demonstrates usage of high fermentable carbohydrates, aiming to enhance the animal performance. It causes disturbance of the rumen microbial balance that eventually leads to severe metabolic disorders, and impairs animal health and productivity (Chaucheyras-Durand, 2012). Therefore, there has been an increased interest towards animal probiotic application since few decades that has resulted into improved pH regulation, prohibition of pathogenic bacteria, with maintenance of animal health and productivity (Beauchemin, 2006). Besides having probiotic assisted benefits to the ruminants, decipheration of critical changes in major rumen bacteria is being considered as equally significant, although previous researches focused understanding the dietery intervention effect on the rumen microbiome (Huws et al., 2018; Abbasi et al., 2019).
It created an urge to understand the complex networking of the rumen microbiome. Despite several attempts to isolate the rumen bacterial strains over the past 50 years, the majority of rumen bacteria are yet to be identified and characterized. Recent advances in molecular techniques have reported a predominance of uncultured bacteria in the rumen (Neves et al., 2017). Advanced molecular techniques explored rumen bacteria, wherein; determination of bacterial abundance targeting the inter-species specificity is preferred (Aphale and Kulkarni, 2018). While, quantitative PCR (qPCR) is of choice for rumen microbial quantification (Fremah et al., 2018).
For these microbial ecology studies, rumen is an ideal yet complex environment. However, native complexity of rumen limits the establishment of external strains. Also, monitoring an intervening effect in the animal systems is cumbersome and time consuming. Thus, rumen simulation technique (RUSITEC) is most suitable for preliminary evaluation purpose. It allows studying multiple treatments in short time. Duarte et al., (2017) and Abbassi et al., (2018) used a RUSITEC system to understand the effect of forage and low protein diet on rumen microbiome. Wetzels et al., (2018) used a RUSITEC system for studying an effect of Clostridium perfringens.
The present research aims to quantify P. ruminicola, F. succinogenes, R. flavefaciens, S. ruminantium, and S. bovis upon probiotic interventions using qPCR and a RUSITEC system. The present study analyses volatile fatty acids (VFA), pH, and fiber profile among control and test samples; the principal component analysis (PCA) of which collectively inferred about probiotic assisted microbial changes and its relationship with fiber digestibility.
MATERIAL AND METHODS
PF 1 and PF 2 probiotic strains:The in-house probiotic formulations, PF 1, contained Bacillus subtilis (MTCC 2414), Bacillus amyloliquifaciens (MTCC 10456) and Propionibacterium freudenreichii (NCIM 2111), whereas, PF 2 contained Bacillus licheniformis (NCIM 2051).
Probiotic formulation
Glycerol stock of B. subtilis, B. amyloliquifaciens, and B. licheniformis was inoculated into 100 mL nutrient broth (HiMedia). Whereas, P. freudenreichii was inoculated into 100 mL deMan, Rogosa and Sharpe (MRS) broth (HiMedia) respectively. It was incubated at 37°C for 24−48 h. The cell broth was centrifuged at 4000 × g for 30 min and pellet was mixed with 1% pre sterilized maltodextrin and 0.5% carboxymethyl cellulose (1:1, v/v). The resulting lyo-slurry was lyophilized using Heto PowerDry LL3000 Freeze Drier, at −55°C for 36–48 h and total viable count was estimated, expressed as colony forming units (CFU)/g.
RUSITEC experiment:The RUSITEC has four cylindrical chambers treated as independent fermentation vats, designated A−D in the present study. The experimentation involved ‘control’ which had not been exposed to probiotic intervention. To begin with, sheep rumen digesta was obtained from slaughterhouse under controlled environmental conditions. It was diluted to four liter using artificial saliva (NaHCO3, 9.80 g/L; Na2HPO4, 4.97 g/L; KCl, 0.57 g/L; NaCl, 0.47 g/L; MgCl2, 0.123 g/L; CaCl2, 0.04 g/L) and was heated to 39 ± 2°C before use. The experiment was initiated with inoculation of 800 mL diluted rumen content in each of the chambers of one liter capacity. Crude rumen solids (80 g) were suspended in each chamber, packed in a nylon bag of 100 μm pore size. Chamber A was designated as the control whereas B–D chambers were challenged with probiotics. The assembly was fitted into the water bath maintained at 38 ± 2°C. The rumen content inside the chambers was stirred at 20 rpm. Artificial saliva was infused at a rate of 0.20 mL/min. Saliva feeding was commenced after 6 h of stabilization.
After 24 h, nylon bags were removed. Mixed cattle feed was provided for chambers A–D, every 24 h, at the dosage of 1 g/d. Chambers B–D were supplemented with 0.1 g PF 1 and PF 2 in separate experiments with independent controls. Fermentation gas was collected in gas bags. Three experimental replications were performed to determine the results of probiotic interventions in vitro.
Community DNA extraction:The fermented RUSITEC fluid of d3 and d7, from A–D chambers was gauze filtered and centrifuged at 4200 × g for 30 min. The pellet (200 mg) was subjected to community DNA extraction using QIAamp DNA Stool Mini Kit (Qiagen, 51504). The quality of DNA was determined using 0.8% (w/v) agarose gel electrophoresis and absorbance ratios at A260nm/A280nm and A260nm/A230nm using NanoDrop spectrophotometer.
Standard PCR:Primer specificity of the target genes was validated through standard PCR using Bio-Rad thermal cycler. The 20 µL reaction had 0.2 µL Q5 Hot Start High-Fidelity DNA Polymerase system (M0493, New England Biolabs), 0.2 mM of each dNTPs (N0446S, New England Biolabs), 100 ng DNA template, and 10 nM of forward/reverse primer each (Table 1). The PCR program used was: 98°C for 10 min; 35 cycles of 98°C for 10 s; optimized annealing temperature (Table 1) for 30 s; 72°C for 1 min; and a final extension step of 72°C for 10 min. Amplification was determined by 2% (w/v) agarose gel electrophoresis and SYBR Safe DNA gel stain (Invitrogen) where purity was visualized as a single band with absence of primer dimer and non-specific products.
Table 1. Species-Specific 16S rRNA Gene Primers used for the Quantification of Ruminal Bacteria using Real-Time PCR Assay
| Targeted rumen bacteria | Primer | 5’-3’ sequence | Ta (°C)* | Amplicon size (bp) | Reference |
| Prevotella ruminicola | PR-F | GGTTATCTTGAGTGAGTT | 50 | 485 | (Singh et al., 2014) |
| PR-R | CTGATGGCAACTAAAGAA | ||||
| Fibrobacter succinogenes | FS-F | GTTCGGAATTACTGGGCGTAAA | 60 | 121 | (Denman et al., 2006) |
| FS-R | CGCCTGCCCCTGAACTATC | ||||
| Ruminococcus flavefaciens | RF-F | CGAACGGAGATAATTTGAGTTTACTTAGG | 50 | 132 | (Denman et al., 2006) |
| RF-R | CGGTCTCTGTATGTTATGAGGTATTACC | ||||
| Selenomonas ruminantium | Sel-Mit-F | TGCTAATACCGAATGTTG | 57 | 513 | (Singh et al.,2014) |
| Sel-Mit-R | TCCTGCACTCAAGAAAGA | ||||
| Streptococcus bovis | SB-F | ATGTTAGATGCTTGAAAGGAGCAA | 60 | 90 | (Klieve et al.,2003) |
| SB-R | CGCCTTGGTGAGCCGTTA |
* Ta provided in above table is optimized annealing temperature used in quantitative PCR studies
Preparation of 16S rRNA gene standards:Absolute quantification involved standard curves prepared with gel extracted amplicons of the 16S rRNA gene amplified from P. ruminicola, F. succinogenes, R. flavefaciens, S. ruminantium, and S. bovis using specific primers (Table 1). Standard PCR was performed using Bio-Rad thermal cycler. The 20 µL reaction consisted of 0.2 µL Q5 Hot Start High-Fidelity DNA Polymerase system (M0493, New England Biolabs), 0.2 mM of each dNTPs (N0446S, New England Biolabs), 100 ng DNA templates, 10 nM of forward and reverse primer each. The PCR program used was: 98°C for 10 min; 35 cycles of 98°C for 10 s; optimized annealing temperature (Table 1) for 30 s; 72°C for 1 min; and a final extension step of 72°C for 10 min. The amplification was determined by 2% (w/v) agarose gel electrophoresis. The elution of DNA fragments was performed using Macherey Nagel NucleoSpin Gel and PCR Clean-up Kit (740609.50 MN). The concentration of gel extracted products was determined at A260nm/A280nm and A260nm/A230nm using NanoDrop spectrophotometer.
Real-time PCR assay conditions:Quantitative PCR was performed using CFX 96 Bio-Rad real-time PCR system. Indicator rumen bacteria were quantified by targeting 16S rRNA gene. The target gene was amplified from community DNA using primer sets (Table 1). The assay involved optimization of primer and template DNA concentration, reaction volume and reaction conditions. A 10 μL reaction in 96-well plate was run in triplicates (Bio-Rad). It consisted of 5 µL 2× QuantiTect SYBR Green RT-PCR Master Mix (QuantiTect SYBR Green RT-PCR Kit, Qiagen, 204243), forward and reverse primers (0.5 µM for P. ruminicola, and S. ruminantium, 0.3 µM for S. bovis, R. flavefaciens, and F. succinogenes) and DNA template (50 ng for P. ruminicola, S. ruminantium, S. bovis; 60 ng for R. flavefaciens; 100 ng for F. succinogenes) respectively. The PCR program used was: 95°C for 15 min; 40 cycles of 94°C for 15 s; optimized annealing temperature (Table 1) for 30 s and elongation at 72°C for 1.5 min for P. ruminicola, S. ruminantium followed by 72°C for 30 s for R. flavefaciens, F. succinogenes, and S. bovis respectively. Amplicon specificity was determined using melt curve analysis of qPCR end products by increasing the temperature at a rate of 0.5°C every 0.05 s from 60°C–95°C.
Real-time PCR: specificity and sensitivity:Real time PCR amplicons were confirmed by 2% (w/v) agarose gel electrophoresis. To minimize variations, and screen for impurities or dimers; triplicates of each template DNA and a negative control were loaded on each plate. Sensitivity of the qPCR was determined using serially diluted gel eluted products of 16S rRNA gene corresponding to targeted rumen bacteria. The dynamic range consisted of 10 fold dilutions from 101 to 1010.
The correlation between the 16S rRNA gene dilutions and threshold cycle (Ct) values in qPCR were analyzed by plotting a standard curve. Logarithms of the DNA concentrations were plotted against the Ct value with linear correlation coefficient (R2), slope, and reaction efficiency. Only assays that fell in the range of 90–110% efficiency, clear melt curves with slope of −3.3 to −3.5 and R2 ≥ 0.99 were considered. The mean, standard deviation (SD), and coefficient of variation (CV) were calculated separately for each 16S rRNA gene dilution in order to determine the intra-assay variation. The results for counting of each species were expressed as the number of copies/g of rumen content using the formula available in (http://scienceprimer.com/copy-number-calculator-for-realtime-pcr).
Volatile fatty acid, pH, and fiber digestion profiling:The effluent collected per day during fermentation (60 mL) was analyzed for VFA (acetic, propionic, butyric, iso-butyric, iso-valeric, and valeric acids, mmol/L) and pH. The fiber digestibility calculation was based on d0 and d7 residual fiber analysis (Neubert et al., 1940).
Statistical analysis:Multivariate one-way analysis of variance model plotting response of VFA against probiotic intervention was used to determine significant differences between acetic, propionic, and butyric acids profile among three independent RUSITEC replication experiments. Differences between means were considered significant at a P value of 0.05. Significant differences between fiber digestion of control, PF 1, and PF 2 were analyzed using one–way analysis of variance at CI of 95%. Statistical analysis was performed using Minitab 17.1.0 (Minitab Inc.).
Bioinformatics analysis:Bioinformatics analysis was performed using R packages (version 3.1.4). Principal component analysis was performed for targeted rumen bacteria using “devtools” and “factoextra” packages available in R plots package list with number of copies dataset generated upon probiotic interventions across different time period. In addition, PCA analysis was conducted to analyze correlation between number of copies, VFA, and fiber profiling dataset of day 7 after probiotic interventions.
RESULTS AND DISCUSSION
The microbial community inhabiting the rumen is extremely diverse. The microbes live in a symbiotic relationship and functionally interact with the host, playing an imperative role in maintaining a stable intra-ruminal environment and bacterial ecosystem. Rumen fibrinolysis though involves protozoa, archaea, and fungi; it’s mainly driven by three predominant bacterial species including F. succinogenes, R. albus, and R. flavefaciens (Li et al., 2017). In conjunction, non-fibrolytic P. ruminicola has been reported to synergize with fibrolytic bacteria through interspecies hydrogen transfer and removal or exchange of metabolites. S. ruminantium one of the major non-fibrolytic bacteria also reported for synergism with R. flavefaciens and F. succinogenes towards propionic acid driven fermentation (Sawanon et al., 2017). This synergism triggers fiber fermentation in the rumen for efficient digestion in the ruminant animals.
These changes, the functionalities, and mechanism of action of rumen microorganisms are recently being addressed using molecular biology tools and techniques. Qualitative investigation into the presence or absence rumen bacteria has been reported earlier (Aphale and Kulkarni, 2018). In this line, qPCR serves as one of the established platform for direct quantitation of microorganisms. Tajima et al., (2001) reported qualitative and quantitative shifts of ruminal P. ruminicola, Prevotella bryantii, Prevotella albenis, F. succinogenes, Ruminococcus amylophilus, S.ruminantium-Mitsuokella multiacida, Treponema bryantii, S. bovis, Eubacterium ruminantium, Anaerovibrio lipolytica, Succinivibrio dextrinosolvens, and R. flavefaciens due to diet dependent changes. Lettat et al., (2012) reported the effect of Propionibacterium and Lactobacillus based probiotics on sheep acidosis where, qPCR based quantitation of F. succinogenes, Ruminococcus albus, R. flavefaciens, genus Prevotella, and Streptococcus was performed. Schofield et al., (2018) reported the beneficial effects of B. amyloliquifaciens H57 probiotic mixture using qPCR.
Bacteria-based probiotics are comprised of a variable number of species and strains of beneficial bacteria known to have positive implications on animal health and performance. Bacterial probiotics have been reported to improve the rumen-predominant microorganisms (Chiquette et al., 2012). Probiotics also reduce the risk of rumen acidosis in the dairy cows receiving a combination of Lactobacillus and Enterococcus mixture. Qadis et al., (2014) reported that, lactic-acid bacteria based probiotics promote the rumen microbiome stability that in turn improves the dry matter intake, weight gain, and health of the animal (Qadis et al., 2014).
In the current study, we have targeted the qPCR based quantification of P. ruminicola, F. succinogenes, R. flavefaciens, S. ruminantium, and S. bovis upon PF 1 and PF 2 probiotic dosage, using in vitro RUSITEC system. Duarte et al., (2017) and Guyader et al., (2017) have reported the dietery intervention studies using a RUSITEC system. However, the probiotic intervention experiments have not been reported earlier using in vitro RUSITEC system. The probiotic formulations developed in-house had a bacterial composition of B. subtilis, B. amyloliquifaciens, P. freudenreichii (PF 1) and B. licheniformis (PF 2), with CFU/g of: 7×10⁶ CFU/g, 5×10⁶ CFU/g, 4.7×10⁶ CFU/g, and 6.2×10⁷ CFU/g, respectively.
For the purpose of current qPCR study, we chose PCR products of 16S rRNA gene as indicated in Table 1. While the design algorithm for qPCR utilizes many criteria, amplicon size between 50−210 bp is one of the pivotal prerequisite. Also, community DNA extraction targeted from control, PF 1, and PF 2 samples yielded 50 ng/µL, 60 ng/µL, and 75 ng/µL community DNA with absorbance ratios of 1.8 ± 0.01 (A260nm/A280nm) and 2.3 ± 0.05 (A260nm/A230nm) respectively.
We report that, the primers used in this study lie between 90−132 bp thus fitting into the key criteria. This was reiterated through standard PCR results (Figure 1), which confirmed the presence of targeted rumen bacteria with amplicons in desired size range (Table 1). The successful detection of targeted microbes reveals their key functionalities within the rumen, associated with fibrolysis (Sawanon et al., 2017).
Figure 1: Standard PCR of Targeted Rumen Bacteria upon PF 1 and PF 2 Intervention. The PCR Amplicons Constitute Interventions by PF 1, Lane: 1 blank, Lane 2: Prevotella ruminicola, Lane 3: Selenomonas ruminantium, Lane 4: Fibrobacter succinogenes, Lane 5: Ruminococcus flavefaciens, Lane 6: Streptococcus bovis, Lane 7: Ladder, 100 bp (N3231S, New England Biolabs) and PF 2, Lane 8: S. bovis, Lane 9: R. flavefaciens, Lane 10: F. succinogenes, Lane 11: S. ruminantium, Lane 12: P. ruminicola, Lane 13: Ladder, 100 bp (N3231S, New England Biolabs)
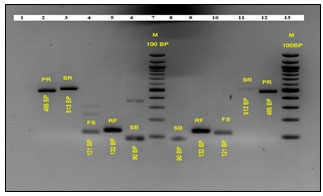
Standard PCR of d7 fermented RUSITEC samples revealed the presence of P. ruminicola (485 bp), S. ruminantium (513 bp), F. succinogenes (121 bp), R. flavefaciens (132 bp), and S. bovis (90 bp) as represented in Figure 1.
Real-time PCR performed to quantitatively determine population size of targeted rumen bacteria was analyzed using standard curve method (Brankatschk et al., 2012). The parameters included slope, intercept, and reaction efficiency (E %). Its details along with melting temperature (Tm, °C) and intra-assay variation (mean SD and mean CV) are presented in Table 2.
Table 2. Assay Performances of Day 3 and Day 7 with Five Targeted Rumen Bacteria under Control and Test Conditions
| Time
(d) |
Prevotella ruminicola | Fibrobacter succinogenes | Ruminococcus flavefaciens | Selenomonas ruminantium | Streptococcus bovis | |||||||||||||||||||||||
| *C | †PF 1 | ‡PF 2 | C | PF 1 | PF 2 | C | PF 1 | PF 2 | C | PF 1 | PF 2 | C | PF 1 | PF 2 | ||||||||||||||
| Tm (°C) | §d0 | 84.0 | 82.5 | 78.5 | 84.5 | 78.5 | ||||||||||||||||||||||
| §d3 | ||||||||||||||||||||||||||||
| §d7 | ||||||||||||||||||||||||||||
| Inter-cept | d0 | 2.25 | 1.22 | 1.92 | 3.98 | 1.10 | ||||||||||||||||||||||
| d3 | 2.25 | 1.22 | 1.92 | 3.98 | 1.10 | |||||||||||||||||||||||
| d7 | 2.25 | 1.52 | 4.75 | 6.21 | 1.86 | |||||||||||||||||||||||
| Slope | d0 | −3.26 | −3.29 | −3.36 | −3.50 | −3.25 | ||||||||||||||||||||||
| d3 | −3.26 | −3.29 | −3.36 | −3.50 | −3.25 | |||||||||||||||||||||||
| d7 | −3.50 | −3.35 | −3.46 | −3.30 | −3.36 | |||||||||||||||||||||||
| E (%) | d0 | 102.43 | 101.22 | 94.36 | 92.74 | 103.00 | ||||||||||||||||||||||
| d3 | 102.43 | 101.22 | 94.36 | 92.74 | 103.00 | |||||||||||||||||||||||
| d7 | 93.07 | 98.58 | 98.51 | 100.92 | 98.19 | |||||||||||||||||||||||
| ¶Mean SD | d0 | 0.11 | 0.005 | 0.04 | 0.07 | 0.11 | ||||||||||||||||||||||
| d3 | 0.13 | 0.02 | 0.04 | 0.005 | 0.04 | 0.10 | 0.11 | 0.14 | 0.08 | 0.18 | 0.08 | 0.005 | 0.02 | 0.05 | 0.15 | |||||||||||||
| d7 | 0.09 | 0.05 | 0.03 | 0.18 | 0.09 | 0.10 | 0.13 | 0.17 | 0.12 | 0.13 | 0.06 | 0.08 | 0.07 | 0.03 | 0.06 | |||||||||||||
| **Mean CV | d0 | 0.58 | 0.02 | 0.17 | 0.27 | 0.46 | ||||||||||||||||||||||
| d3 | 0.63 | 0.11 | 0.20 | 0.02 | 0.19 | 0.54 | 0.47 | 0.54 | 0.31 | 0.73 | 0.31 | 0.01 | 0.06 | 0.17 | 0.53 | |||||||||||||
| d7 | 0.40 | 0.20 | 0.20 | 0.86 | 0.37 | 0.40 | 0.70 | 0.80 | 0.60 | 0.40 | 0.20 | 0.20 | 0.28 | 0.16 | 0.26 | |||||||||||||
*C: Control, †PF 1: Probiotic 1 formulation, ‡PF 2: Probiotic 2 formulation, §d0: Day 0, §d3: Day 3 and §d7: Day 7, ¶Mean SD: Mean Standard deviation, **Mean CV: Mean coefficient of variation. Mean SD and Mean CV were calculated for intra-assay variations of quantitative PCR
Specificity and sensitivity of entire qPCR analyses displayed a slope in the range of − 3.2 to − 3.5 having reaction efficiency between 93.07 to 103% respectively. Single sharp peak observed in the melt curve analysis indicated no primer-dimer formation or non-specific amplification, which was also confirmed by 2% (w/v) agarose gel electrophoresis. Linear correlation coefficient (R2) was observed to be ≥ 0.99, stated the qPCR precision. The generated standard curve covered a linear range of three to eight orders of magnitude for each selected bacteria and showed linearity over the entire range of quantification, which is in alignment with minimum information for publication of quantitative real-time PCR experiments (MIQE) guidelines (Bustin et al., 2009).
Figure 2a, 2b, and 2c represent the total number of targeted bacteria in control and test groups. Population shifts were compared with d0.
Figure 2: Copy Number Estimation of Targeted Rumen Bacteria using Quantitative PCR. Figure depicts Population Comparison of (a) day 0 vs. Day 3 and Day 7 under Control Conditions (b) Day 0 vs. Day 3 and Day 7 upon PF 1 Intervention (c) Day 0 vs. Day 3 and Day 7 upon PF 2 Intervention
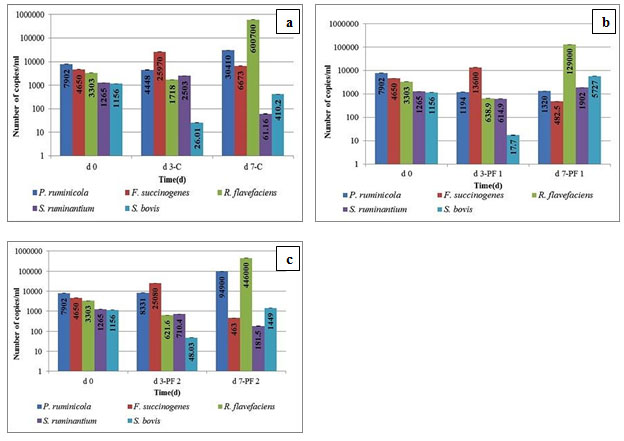
Probiotic PF 1 decreased the proteolytic, cellulolytic, and amylolytic bacterium, P. ruminicola population by 19.93%, whereas the same was increased by 27.69% by PF 2 dosage, after a drastic decrease on d3 unlike the case of PF 1 where the decrease persists. This signifies the ability of the population of this microbe to demonstrate dramatic shift. Since this microbe serves three key functions, a much higher (doubling in numbers) demonstrated by PF 2 from d7 onwards indicates the reinstatement of functionality associated with it. B. licheniformis as a compositional element of PF 2; has been reported for higher milk yield, protein, ruminal digestibility, and total VFA concentration in ruminants (Qiao et al., 2010).
One of the major fibrolytic bacteria; P. ruminicola may be a part of this induction. B. licheniformis supplementation leads to higher VFA and acetic acid concentrations; probably because it stimulates increase in population of cellulose digesting bacteria and thereby high fiber degradation (Ghorbani et al., 2002). Also, population of P. ruminicola was stable on d3 with either of PF 1 and PF 2 intervention with no log reduction as compared to control. This supports the fact about establishment of rumen consortia in distinguishing and complex manner where each bacterium behaves differently.
In addition, the similar response pattern was noted for S. ruminantium where; 5.70% reduction observed after PF 1 dosage, had 27.18% increase after PF 2 intervention. The probiotic PF 1 and PF 2 led to rise in S. bovis population by 22.68% and 3.20% respectively. S. ruminantium is a common Gram-negative rumen bacterium that can account for up to 51% of the total viable bacterial counts within the rumen (Abdelmegeid et al., 2018). It utilizes the succinate-propionic acid pathway to transform lactic acid into propionic acid, generating the milk (Wang et al., 2017). A previous research by Henderson et al., (2013) report that, lactate produced by S. bovis and Lactobacillus spp. serves as the major fermentable substrate for S. ruminantium and Megasphaera elsdenii. Lactate metabolism further generates acetic acid, propionic acid, and butyric acid (Gonzalez-Garcia et al., 2017). Induction of the propionic acid pathway in the present study indicates that, the population shifts towards a buffered stable rumen of milch cattle where lactic acidosis is avoided. Result indicates that, this intervention would lead to improved milk yield in the field conditions (Mendelez et al., 2018).
Propionic acid is the most important substrate for gluconeogenesis and its concentration in the rumen is dependent on the number and type of propionic acid-generating bacteria present, particularly M. elsdenii and S. ruminantium (Wang et al., 2012). In this context, significantly higher d7 population of S. ruminantium after PF 1 and PF 2 dosage suggests possible population induction of S. ruminantium by S. bovis. In contrast, there was a reduction in F. succinogenes population by 26.82% and 27.31% after PF 1 and PF 2 administration. Moreover, PF 1 ad PF 2 intervention led to 45.23% and 60.54% rise in R.flavefaciens population.
Phylum Bacteroidetes abundances were strongly and positively correlated with propionic acid levels. Similarly, a positive correlation was observed between Firmicutes and butyric acid levels (Moran and Shanahan 2014). Figure 3a, 3b, and 3c represents VFA, fiber digestion, and pH profiling evaluation.
Figure 3: Fermentation Profile of in vitro RUSITEC Studies; (a) Volatile Fatty Acid Profile of Control, PF 1, and PF 2 Samples from Day 0 to Day 7 (b) Fiber Digestion Profile of Day 0 vs. Day 7 after PF 1 and PF 2 Intervention (c) pH Profile of Control vs. PF 1 and PF 2 Interventions from Day 1 to Day 7
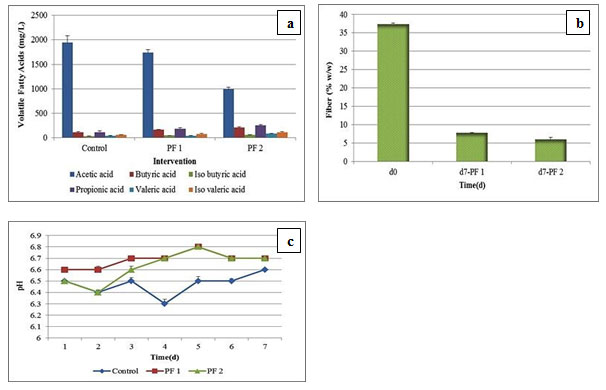
Among all VFA analyzed, there was a reduction in the acetic acid concentration with PF 1 (1743 ± 52 mg/L) and PF 2 (990 ± 45.82 mg/L) interventions in comparison with control (1943 ± 140.32 mg/L). A linear rise in the propionic acid and butyric acid concentrations was observed with PF 1 (180 ± 21 mg/L, 158 ± 12.58 mg/L) and PF 2 (251 ± 12.58 mg/L, 203 ± 15.27 mg/L) dosage, in comparison with control (111 ± 27.53 mg/L, 106 ± 16 mg/L). We observed a significant difference (P < 0.05) between acetic acid, butyric acid, propionic acid concentration, and type of probiotic intervention applied. PF 1 dosage led to increase in the iso-butyric acid concentration from 30.93 ± 2.72 mg/L to 43.24 ± 1.77 mg/L, whereas PF 2 intervention increased the same to 54.50 ± 1.34 mg/L respectively. A similar trend was observed for iso-valeric acid and valeric acid respectively.
In detail, 58.48 ± 3.15 mg/L of iso-valeric acid under control condition was increased to 76.82 ± 5.84 mg/L upon PF 1 dosage and 112.94 ± 9.06 mg/L upon PF 2 administration. Whereas, 37.19 ± 2.39 mg/L of valeric acid was shifted to 41.61 ± 1.43 mg/L upon PF 1 intervention, and 80.59 ± 5.42 mg/L with PF 2 dosage respectively. In support with this; highest production of propionic acid, butyric acid, iso-butyric acid, iso-valeric acid, and valeric acid was observed after PF 2 dosage in the current study. Therefore, the VFA profile indicates that; microbial shifts described in the present research has correlations with the proportions of the VFA produced. Here, S. ruminantium might induce fibrolytic bacteria towards establishment of synergistic relationship through an interaction termed ‘cross-feeding ‘or non-fibrolytic S. ruminantium may possibly involve in the rumen fiber digestion (Sawanon et al., 2017).
In addition, the administration of lactic acid bacteria (LAB) based probiotics is thought to help the rumen microflora for adaptation towards the presence of lactic acid, thereby prevents lactate accumulation in rumen (Qadis et al., 2014). In accordance with this hypothesis, the current research observed an up-regulation of S. bovis and S. ruminantium following PF 1 and PF 2 administrations and thereby indirectly decreased lactate accumulation.There was a fiber reduction observed upon PF 1 and PF 2 dosage, from 37.42 ± 0.5% w/w to 7.8 ± 0.26% w/w and 6 ± 0.05 % w/w respectively. We also observed a significant difference (P < 0.05) between type of probiotic and efficiency of feed digestion. There was no major change in the pH as observed during the course of fermentation from d1 to d7 with PF 1 and PF 2 interventions as compared to control.
In addition; the PCA of targeted microbial copies across different time period and probiotic interventions is represented in Figure 4a. Figure 4b depicts an interrelationship between the targeted microbial copies, VFA, and fiber.
Figure 4 (a): Correlation Analysis of Targeted Rumen Bacteria upon Probiotic Interventions and Different Time Periods. Principal Component Analysis (PCA) of the Targeted Rumen Bacteria from in vitro RUSITEC Studies (b) PCA of the Targeted Rumen Bacteria, Volatile Fatty Acid Profile and Fiber Analysis of Day 7
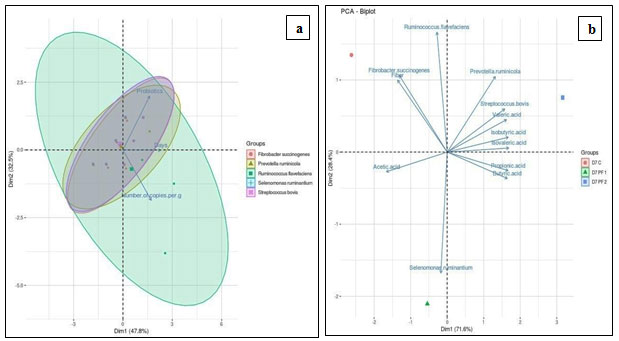
Figure 4a demonstrated total 80.5% variance, explained by PC1 and PC2 axis in the dataset. The analysis explained that, the experimental parameters; probiotic, days, and number of copies are directly related to each other (P<0.05). The eclipse among targeted microbes revealed highest variation in R. flavefaciens across the experimental period and the treatments evaluated. Population of R. flavefaciens was seen up-regulated upon PF 1 and PF 2 dosage, by 45.23% and 60.54% respectively, a highest increase noted among all targeted bacteria. It remarks slow establishment of R. flavefaciens in the rumen. PCA analysis also illustrated highest variation of R. flavefaciens which was noteworthy. Sawanon and Kobayashi (2006) reported an improved fiber digestion with co-culture of S. ruminantium and R. flavefaciens, where succinic acid from R. flavefaciens is converted into propionic acid, resulting into improved rumen functions. A similar relationship was under supposition for the combination of S. ruminantium and F. succinogenes. Evaluation of this synergy can be a key towards high fiber degradation, as F. succinogenes is considered to be the most important fibrolytic species.
Principal component analysis (Figure 4b) revealed total 100% variance, explained by both the axis in the dataset. The significance level (P<0.05) was used in the present analysis. The results showed that; R. flavefaciens and F. succinogenes had strong positive correlation with fiber content of day 7 under control condition. PF 2 intervention revealed strong positive correlation of P. ruminicola and S. bovis with valeric, iso-valeric, and iso-butyric acids respectively. Here, P. ruminicola and S. bovis also had positive correlation with butyric and propionic acids.
The present study demonstrating population rise of P. ruminicola and S. bovis after PF 2 intervention have also revealed positive effect on butyric (106±16 mg/L to 203±15.27 mg/L) and propionic acid (111± 27.53 mg/L to 251±12.58 mg/L) levels. Whereas, butyric and propionic acids had strong negative correlation with F. succinogenes and fiber content. It states that, PF 1 and PF 2 mediated reduction of F. succinogenes is associated with rise in propionic and butyric acid levels; resulting into efficient fiber digestion. It’s also predicted that, probiotic assisted seven days effect may have reduced the F. succinogenes population, because antagonistic effects of probiotic bacterial strains onto rumen inherent flora have been reported by Chiquette et al., (2012). PF 1 intervention demonstrated strong negative correlation of acetic acid with P. ruminicola, S. bovis, valeric, iso-valeric, and iso-butyric acids respectively. The current study depicting, PF 1 mediated acetic acid reduction, is attributed to rise of S. bovis population. Combined together, it has resulted into increase in other VFA, conferring high fiber digestion.
Probiotics have been reported to improve anaerobiosis, stabilize pH, and supply nutrients to ruminal microbes in their microenvironment (Khattab et al., 2017). The current research of correlation analysis of total VFA, nutrient digestibility, pH, and qPCR of targeted rumen bacteria suggests that; bacterial probiotics influence specific VFA production in the rumen with selective and unique pattern of up or down-regulation of rumen microorganisms; buffering the rumen environment and overall rumen functions (Figure 3).
Earlier research reports the quantitative PCR shifts of the rumen bacteria, upon dietery or probiotic intervention using in vivo animal experiments. Pinloche et al., (2017) and Qadis et al., (2014) studied the effect of probiotic yeast and LAB bacteria on the rumen microbiome, VFA, and pH of cattle rumen and Holstein calves. To the best of our knowledge, this is the first report wherein, qPCR based profiling has been performed in a RUSITEC system to determine the rumen microbial shifts upon probiotic intervention. The current findings have added new dimension to the community analysis with distinguishing mark over specific rumen bacteria; revealing the effect of their critical shifts on entire rumen environment and ultimately over fiber digestion, VFA profile, pH etc. It has established broad insights about rumen population dynamics due to probiotics dosage. It has also been demonstrated that, high levels of fluctuations occur within initial seven days of rumen intervention. At the end of d7, symbiotic relationship established between rumen microorganisms leading to changed functionality and an outcome.
CONCLUSION
To conclude, the current findings add new dimension to the rumen microbial shifts upon probiotic intervention and reveal the effect on fiber digestion, VFA, and pH. The study depicts that; symbiotic relationship after d7 leads to distinct functionality. The study emphasizes differential modulation of rumen bacteria by combination of probiotic microbes, where B. licheniformis was major determinant of microbial shifts. The direct relation between probiotic, days, and number of copies demonstrated through PCA, highlighted highest variation in R. flavefaciens. The strong correlation between P. ruminicola and S. bovis towards increase in butyric, propionic, and other minor VFA was noteworthy. Also, antagonism between probiotic strains and F. succinogenes, as well as its strong negative correlation with butyric and propionic acids was deciphered. The gradual establishment of R. flavefaciens upon probiotic influence was noted. Therefore, the study explains how rumen bacteria respond to probiotic intervention, setting up a guideline for the product development.
ACKNOWLEDGEMENTS
The authors are grateful to Symbiosis International Deemed University, Lavale, Pune, for providing an opportunity to register as a Ph.D. student with the University. The authors also thank Praj Industries Ltd., Pune, Maharashtra, India and CTO, Praj Matrix, R&D Center, Division of Praj Industries Ltd., Pune, Maharashtra, India for permitting to conduct the research work at Praj Matrix.
Funding
This research did not receive any specific grant from funding agencies in the public, commercial, or not-for-profit sectors.
Conflict of Interest
The authors declare that they have no conflict of interest.
REFERENCES
Abbasi, I.H. Abbasi, F., El‑Hack, M., Swelum, A.A., Yao, J. and Cao, Y. (2018) Post-ruminal effects of rumen protected methionine supplementation with low protein diet using long term simulation and in vitro digestibility technique. AMB Expr, 8:36.
Abbasi, I.H.R., Abbasi, F., Liu, L., Liu, L., Bodinga, B.M., Abdel-Latif, M.A., Swelum, A.A., Mohamed, M.A.E. and Cao, Y. (2019) Rumen-protected methionine a feed supplement to low dietary protein: effects on microbial population, gases production and fermentation characteristics. AMB Expr, 9:93.
Abdelmegeid, M.K., Elolimy, A.A., Zhou, Z., Lopreiato, V., McCann, J.C. and Loor, J.J. (2018) Rumen-protected methionine during the peripartal period in dairy cows and its effects on abundance of major species of ruminal bacteria. J Anim Sci Biotechnol, 9: 17.
Aphale, D., Kulkarni, A. (2018) Modifications and optimization of manual methods for polymerase chain reaction and 16S rRNA gene sequencing quality community DNA extraction from goat rumen digesta. Vet World, 11: 990–1000.
Beauchemin, K.A., Krehbiel, C.R. and Newbold, C.J. (2006) Enzymes, bacterial direct-fed microbial and yeast: Principles for use in ruminant nutrition. In: Mosenthin, R., Zentek, J., Ebrowska, T.Z. (Ed) Biology of nutrition in growing animals.
Brankatschk, R., Bodenhausen, N., Zeyer, J. and Burgmann, H. (2012) Simple absolute quantification method correcting for quantitative PCR efficiency variations for microbial community samples. Appl Environ Microbiol, 78: 4481−4489.
Bustin, S.A., Benes, V., Garson, J.A., Hellemans, J., Huggett, J., Kubista, M., Mueller, R., Nolan, T., Pfaffl, M.W., Shipley, G.L., Vandesompele, J. and Wittwer, C.T. (2009) The MIQE guidelines: minimum information for publication of quantitative real-time PCR experiments. Clin Chem, 55: 611−622.
Chaucheyras-Durand, F., Chevaux, E., Martin, C. and Forano, E. (2012) Use of yeast probiotics in ruminants: Effects and mechanisms of action on rumen pH, fiber degradation, and microbiota according to the diet. In: Rigobelo, E.C. (Ed) Probiotic in animals, Croatia: Intech, Rijeka, 119-152.
Chiquette, J., Allison, M.J. and Rasmussen, M. (2012) Use of Prevotella bryantii 25A and a commercial probiotic during subacute acidosis challenge in mid lactation dairy cows. J Dairy Sci, 95: 5985–5995.
Denman, S.E., Christopher, S. and Sweeney, Mc. (2006) Development of a real-time PCR assay for monitoring anaerobic fungal and cellulolytic bacterial populations within the rumen. FEMS Microbiol Ecol, 58: 572–582.
Duarte, A.C., Holman, D.B., Alexander, T.W., Durmic, Z., Vercoe, P.E. and Chaves, A.V. (2017) The type of forage substrate preparation included as substrate in a RUSITEC system affects the ruminal microbiota and fermentation characteristics. Front Micrbiol, 8:704.
Fremah, S.A., Ekwemalor, K., Asiamah, E.A., Ismail, H., Ibrahim, S. and Worku, M. (2018) Effect of probiotic supplementation on growth and global gene expression in dairy cows. J Appl Anim Res, 46: 257–263.
Ghorbani, G.R., Morgavi, D.P., Beauchemin, K.A. and Leedle, J.A. (2002) Effects of bacterial direct-fed microbials on ruminal fermentation, blood variables, and the microbial populations of feedlot cattle. J Anim Sci, 80: 1977–1986.
Gonzalez-Garcia, R.A., McCubbin, T., Navone, L., Stowers, C., Nielsen, L.K. and Marcellin, E. (2017) Microbial propionic acid production: Review. Fermentation, 3: 21
Guyader, J., Ungerfeld , E.M. and Beauchemin, K.A. (2017) Redirection of metabolic hydrogen by inhibiting methanogenesis in the rumen simulation technique (Rusitec). Front Microbiol, 8: 393
Henderson, G., Cox, F., Kittelmann, S., Miri, V.H., Zethof, M., Noel, S.J., Waghorn, G.C. and Janssen, P.H. (2013) Effect of DNA extraction methods and sampling techniques on the apparent structure of cow and sheep rumen microbial communities. PLoS ONE 8:e74787.
http://scienceprimer.com/copy-number-calculator-for-realtime-pcr
Huws, S.A., Creevey, C.J., Oyama, L.B., Mizrahi, I., Denman, S.E., Popova, M., Munoz-Tamayo, R., Forano, E., Waters, S.M., Hess, M., Tapio, I., Smidt, H., Krizsan, S.J., Yanez-Ruiz, D.R., Belanche, A., Guan, L., Gruninger, R.J., McAllister, T.A., Newbold, C.J., Roehe, R., Dewhurst, R.J., Snelling, T.J., Watson, M., Suen, G., Hart, E.H., Kingston-Smith, A.H., Scollan, N.D., do Prado, R.M., Pilau, E.J., Mantovani, H.C., Attwood, G.T., Edwards, J.E., McEwan, N.R., Morrisson, S., Mayorga, O.L., Elliott, C. and Morgavi, D.P. (2018) Addressing global ruminant agricultural challenges through understanding the rumen microbiome: Past, present, and future. Front Microbiol, 9: 2161.
Khattab, S.A., Tawab, A.M. and Fouad, M.T. (2017) Isolation and characterization of anaerobic bacteria from frozen rumen liquid and its potential characterizations. Int J Dairy Sci, 12: 47−51.
Klieve, A.V., Hennessy, D., Ouwerkerk, D., Forster, R.J., Mackie, R.I. and Attwood, G.T. (2003) Establishing populations of Megasphaera elsdenii YE 34 and Butyrivibrio fibrisolvens YE 44 in the rumen of cattle fed high grain diets. J Appl Microbiol, 95: 621–630.
Lettat, A., Noziere, P., Silberberg, M., Morgavi, D.P., Berger, C. and Martin, C. (2012) Rumen microbial and fermentation characteristics are affected differently by bacterial probiotic supplementation during induced lactic and subacute acidosis in sheep. BMC Microbiol, 12: 142.
Li, F., Wang, Z., Dong, C., Li, F., Wang, W., Yuan, Z., Mo, F., Weng, X. (2017) Rumen bacteria communities and performances of fattening lambs with a lower or greater subacute ruminal acidosis risk. Front Microbiol, 8: 2506.
Melendez, P., Severino, K., Marin, M.P. and Martin, D. (2018) The effect of a product with three gluconeogenic precursors during the transition period on blood metabolites and milk yield in Chilean Holstein cattle. J Appl Anim Res, 46: 613−617.
Moran, C.P. and Shanahan, F. (2014) Gut microbiota and obesity: role in aetiology and potential therapeutic target: Best Pract Res Clin Gastroenterol, 28: 585–597.
Neubert, A.M., Vanamburgh, F. and St, John, J.L. (1940) Determination of crude fiber. Ind Eng Chem Anal Ed, 12: 451–451.
Neves, A., Li, F., Ghoshal, B., McAllister, T. and Guan, L.L. (2017) Enhancing the resolution of rumen microbial classification from metatranscriptomic data using kraken and mothur. Front Microbiol, 8: 2445.
Pinloche, E., McEwanm N., Marden, J.P., Bayourthe, C., Auclair, E. and Newbold, C.N. (2017) The effects of a probiotic yeast on the bacterial diversity and population structure in the rumen of cattle. PLoS ONE, 8: e67824.
Qadis, A.Q., Goya, S., Ikuta, K., Yatsu, M., Kimura, A., Nakanishi, S. and Sato, S. (2014) Effects of a bacteria-based probiotic on ruminal pH, volatile fatty acids and bacterial flora of Holstein calves. J Vet Med Sci, 76: 877–885.
Qiao, G.H., Shan, A.S., Ma, N., Ma, Q.Q. and Sun, Z.W. (2010) Effect of supplemental Bacillus cultures on rumen fermentation and milk yield in Chinese Holstein cows. J Anim Physiol Anim Nutr, 94: 429–436.
Sawanon, S. and Kobayashi, Y. (2006) Synergistic fibrolysis in the rumen by cellulolytic Ruminococcus flavefaciens and non-cellulolytic Selenomonas ruminantium: Evidence in defined cultures. Animal Sci J, 77: 208–214.
Sawanon, S., Koike, S. and Kobayashi, Y. (2017) Evidence for the possible involvement of Selenomonas ruminantium in rumen fiber digestion. FEMS Microbiol Lett, 325: 170–179.
Schofield, B.J., Lachner, N., Le, O.T., McNeill, D.M., Dart, P., Ouwerkerk, D., Hugenholtz, P. and Klieve, A.V. (2018) Beneficial changes in rumen bacterial community profile in sheep and dairy calves as a result of feeding the probiotic Bacillus amyloliquifaciens H57. J Appl Microbiol, 124: 855–866.
Singh, K.M., Pandya, P.R., Tripathi, A.K., Patel, G.R., Parnerkar, S., Kothari, R.K. and Joshi, C.G. (2014) Study of rumen metagenome community using qPCR under different diets. Meta Gene, 2:191–199.
Tajima, K., Aminov, R.I., Nagamine, T., Matsui, H., Nakamura, M. and Benno, Y. (2001) Diet-dependent shifts in the bacterial population of the rumen revealed with real-time PCR. Appl Environ Microbiol, 2766–2774.
Wang, X., Li, X., Zhao, C., Hu, P., Chen, H., Liu, Z., Liu, G. and Wang, Z. (2012) Correlation between composition of the bacterial community and concentration of volatile fatty acids in the rumen during the transition period and ketosis in dairy cows. Appl Environ Microbiol, 78: 2386−2392.
Weimer, P.J. (2015) Redundancy, resilience, and host specificity of the ruminal microbiota: implications for engineering improved ruminal fermentations. Front Microbiol, 6: 296.
Wetzels, S.U., Eger, M., Burmester, M., Kreienbrock, L., Abdulmawjood, A., Pinior, B., Wagner, M., Breves, G. and Mann, E. (2018) The application of rumen simulation technique (RUSITEC) for studying dynamics of the bacterial community and metabolome in rumen fluid and the effects of a challenge with Clostridium perfringens. PLoS ONE 13: e0192256.

