1Department of Physiology, Vidyasagar College, Kolkata, India.
2Department of Biotechnology and Bioinformatics, Sambalpur University, India.
Corresponding author email: res_biol@rediffmail.com
Article Publishing History
Received: 15/05/2021
Accepted After Revision: 24/08/2021
L-glutamic acid is a non-essential, proteinogenic amino acid. Its large-scale industrial production using fermentation strategies was initiated in 1957. L-glutamic acid has a huge industrial demand which accounts for about more than fifty lakhs tons /annum throughout the globe. Japan, United States, South Korea, China and Europe are some major producer countries. Several trials have been made to scale-up the process by optimization of different parameters by one factor at a time. But recent studies revealed that Response Surface Methodology (RSM) is the most effective tool for process optimization as it involves multiple factors at a time. For this paper, Response Surface Methodology (RSM) was used for statistical optimization of fermentation conditions that influence the yield of L-glutamic acid by a biotin auxotrophic mutant Corynebacterium glutamicum X680.
Response surface optimization of Box-Behnken design (BBD) was applied to evaluate the effects of culture conditions including some medium composition components. Among the variable screened, inoculum age, temperature, glucose concentration and urea concentration had significant effects on product yield. Production was significantly (p<0.05) increased. Inoculum age, 48.92 h; temperature, 29.99oC; glucose,11.56% and urea, 1% could result in highest L-glutamic acid production of 25.61 mg/ml by Corynebacterium glutamicum X680 as predicted by RSM which is very close to the actual value 25.7mg/ml that confirmed its validity. RSM appeared as a very effective tool for optimization of L-glutamic acid production by this mutant. This research has been conducted to bolster future researches with credible information and updated references. This paper can act as a primary source for future studies to begin their research from.
Corynebacterium glutamicum X680, Fermentation, L-glutamic acid,
Response surface methodology, Statistical optimization.
Ganguly S, Pattnaik S. Optimization of Culture Conditions for L-Glutamic Acid Overproduction by Mutant Corynebacterium Glutamicum X680 Using Response Surface Methodology. Biosc.Biotech.Res.Comm. 2021;14(3).
Ganguly S, Pattnaik S. Optimization of Culture Conditions for L-Glutamic Acid Overproduction by Mutant
Corynebacterium Glutamicum X680 Using Response Surface Methodology. Biosc.Biotech.Res.Comm. 2021;14(3). Available from: <a href=”https://bit.ly/37JOpyg“>https://bit.ly/37JOpyg</a>
Copyright © Ganguly and Pattnaik This is an open access article distributed under the terms of the Creative Commons Attribution License (CC-BY) https://creativecommns.org/licenses/by/4.0/, which permits unrestricted use distribution and reproduction in any medium, provide the original author and source are credited.
INTRODUCTION
L-glutamic acid is a proteinogenic, non-essential amino acid. It was first discovered by Ritthausen in (1866) on hydrolysis of gliadin (Ritthausen 1866). In (1908), a Japanese scientist Kikunae Ikeda observed that glutamate was essential for a meal to taste good (Ikeda 1908). He isolated glutamic acid from kelp like sea weed broth, locally called ‘konbu’ (Laminaria japonica) in Japan. Later it was also found in asparagus, hydrolysate of wheat gluten, tomato, cheese etc. He identified L-glutamic acid as a separate food additive with a distinct taste which was a century later identified as the fifth basic taste modality ‘umami’ (Lindemann et al. 2002).
Next, in the year (1909), monosodium salt of glutamic acid was commercialized as monosodium glutamate (MSG) by Ajinomoto co. and gained the popular trade name Ajinomoto. Since then, it was used in the wide range of products within processed industry, as a flavoring agent to influence market economy (Ault 2004; Alharbi et al. 2020).
Several trials have been made to improve the commercial production of L-glutamic acid. Initially hydrolysis of protein was used but it turned out to be a cumbersome process. Later, its chemical synthesis was also tried, however, during the course of its synthesis, racemic mixture of DL isomers was generated from which separation of metabolically active L-isomer of glutamic acid was very difficult (Sano 2009; Alharbi et al. 2020).
Over and above its flavor enhancing capacity, it has several commercial values. It is a precursor of multiple amino acids such as proline and arginine. It is also a neurotransmitter. So, excessive use of MSG as flavor enhancer may lead to development of neurotoxicity (Xiong et al. 2003). It has got several pharmaceutical and therapeutic uses. In cosmetic industry, glutamic acid and its derivatives are widely used (Hermann 2003; Lee et al. 2014; Alharbi et al. 2020).
A new dimension has opened through the discovery of L-stereo-specific glutamic acid over producer microorganism from Japanese soil in 1955-56 by a group of scientists of Kyowas Hakko Co. Inc headed by Dr. Shigezo Udaka (Kinoshita 1987). Multiple efforts led to development of several L-glutamic acid over producers through a series of successful research through several decades. But the major constrain of its industrial production lies upon its huge production cost. So, reduction of its production cost is another motto (Joseph and Rao 1973; Kishimoto et al.
1980; Nanninga and Gottschal 1985; Tsuchida et al. 1987; Neubeck et al. 1993; Amin 1994; Das et al. 1995; Bona and Moser 1997; Gourdon and Lindley 1999; Kumagai 2000; Delaunay et al. 2002; Choi et al. 2004; Takeno et al. 2007; Engels et al. 2008; Niaz et al. 2009; Tarek and Mostafa 2010; Nadeem et al. 2011; Zareian et al. 2012; Nishio et al. 2013; Shyamkumar et al. 2014; Vuoristo et al. 2015; Wendisch et al. 2016; Hirasawa and Wachi 2017; Sgobba et al. 2018; Wen and Bao 2019; Liu 2019).
Considering its huge industrial demands (which accounts for about more than fifty lakhs tons /annum throughout the globe), Japan, United States, South Korea, China and Europe are the major the major producer countries (Liu 2019). However, the huge market demand for L-glutamic acid in the fast-food industries in India is almost totally dependent on import. Each microorganism grows well within a definite range of environmental consortium which imparts the necessity for optimization of its culture conditions. Response surface methodology (RSM) is a strong statistical tool for analyzing the effects of multiple parameters on the process (Baş and Boyaci 2007; Mansouri et al. 2012; Zafar and Mahmood 2015).
Empirical optimization is a single dimensional study which requires a long time to conduct, whereas RSM reduces number of experimental trials and makes the whole process more compact and quicker. Moreover, it calculates complex interactions between the variables depending on the experimental trials which give more accuracy in the experimental results (Fahimitabar et al. 2021).
Alharbi et al. (2020) used RSM for optimization of L-glutamic acid production by Corynebacterium glutamicum and obtained 16.499g/L L-glutamic acid. Very recently, Fahimitabar et al. (2021) applied RSM for optimization of L-glutamic acid production using Corynebacterium glutamicum in batch culture (Alharbi et al. 2020; Fahimitabar et al. 2021). Present study was undertaken to investigate the influence of independent variables and their interactions on L-glutamic acid production by a biotin-auxotrophic mutant Corynebacterium glutamicum X680 in sub-merged fermentation process.
MATERIAL AND METHODS
Isolation, characterization and development of a biotin dependent L-glutamic acid overproducing strain Corynebacterium glutamicum X680 was done in our previous study (Ganguly 2019). This mutant was used throughout the present study. The growth medium for the mutant was composed of glucose, 2%; peptone, 0.05%; yeast extract, 0.1%; beef extract, 0.3%; K2HPO4, 0.1%; KH2PO4, 0.1%; MgSO4.7H2O, 0.025% and water, 1L. L-glutamic acid production was carried out in a medium composed of: glucose, 10%; urea, yeast extract, 0.2%; 0.8%; K2HPO4, 0.1%; KH2PO4, 0.1%; MgSO4.7H2O, 0.025% and water, 1L. The experiments were carried out at 300C for 72h incubation at pH7.0.
L-glutamic acid accumulated in the fermentation broth was analyzed by Thin Layer Chromatography (TLC) method using silica gel (Merk, Germany) using n-butanol: methanol: water as mobile phase in a ratio of 5:4:3 (v/v/v) and the spots were visualized using ninhydrin (0.2%) in alcohol followed by heating. The product was confirmed as L-glutamic acid by FT-IR (Fig 2).
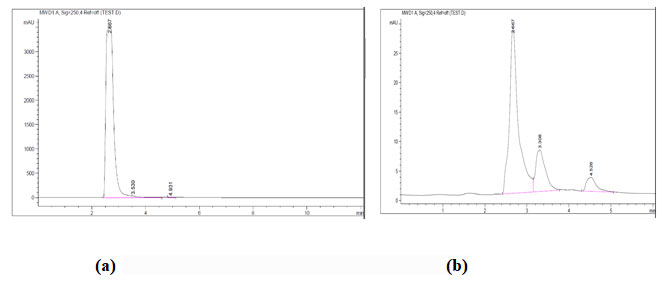
L-glutamic acid recovered from the fermentation broth was analyzed further by agilent 1200 Infinity HPLC (using a phenyl-hexyl column and 50mM N-methylmorpholine/acetate buffer with pH 7.4 containing 12% acetonitrile as elute solvent and detected by UV absorption at 636nm with a flow rate of 1ml/min for 2.5 min and 2ml/min for 1.5 min). After filtration through a membrane filter (0.22µm), the sample was analyzed by HPLC to measure the amount of L-glutamic acid relating to the standard calibration curve.
The first step in this study was to identify the levels of process parameters which have high influence on enzyme production (response). After preliminary screening, a Box–Behnken factorial design (BBD) was employed for further optimization of the effective level of four most influencing factors for production of L-glutamic acid. An experimental design comprising 29 experimental run was created using the four parameters at three equidistance level (−1, 0 and +1) on Design Expert 12 software (Stat ease Corp, USA). The response was tannase activity (U/ml). A polynomial quadratic equation was adopted to evaluate the contribution of each independent variable in this process.
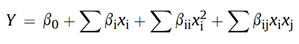
Where, Y is the predicted response; xi and xj are the independent variables in coded values that influence the response, βo the offset term; βi represent the linier effect of xi; βij represent the interaction effect between xi and xj; βii represent the quadratic effect of xi. Regression analysis and estimation of the coefficients were performed using Design Expert software (Stat ease Corp, USA).
RESULTS AND DISCUSSION
Overproduction of desired metabolite by submerged fermentation is not only dependent on the selection of suitable strain, but also optimization of culture conditions and downstream purification technology exert significant impact (Alharbi et al. 2020). In this present investigation, after preliminary OVAT analysis it was found that four factors viz. inoculum age, temperature, glucose concentration and urea concentration play pivotal role in L-glutamic acid production by the Corynebacterium glutamicum X680. Subsequently, the effects of these four factors were optimized through RSM according to BBD.
A total of 29 run with different combination of the four variables (in three equi-distance levels) along with the actual and predicted responses were presented in Table 1. ANOVA of the quadratic regression models suggested that the models were significant with a computed F-value of 183.93 for L-glutamic acid production and P-value (Prob> F) lower than 0.0001 (Table 2). A lower value for the coefficient of variance (P < 0.0001) suggests higher reliability of the experiment. The fitness of the model was also examined by the coefficient of determination (R2).
In the present study, R2 values were found to be 0.9946 that indicated the response models can explain 99.46% of total variations for L-glutamic acid production and the rest may occur due to chance. Analysis of the quadratic effect indicated that all variables significantly contributed to these responses (P < 0.05). The models also showed statistically insignificant lack-of-fit of 4.70 for L-glutamic acid. All the statistical indices suggested that the models were suitable to represent the real relationship among the selected factors for L-glutamic acid production by Corynebacterium glutamicum X680.
The mutual effects of any two factors on L-glutamic acid were also found encouraging. The most significant (P < 0.05) mutual interactions for L-glutamic acid production was in between inoculum age and urea concentration followed by temperature and glucose concentration which are revealed by AVOVA data (Table 2) and response surface-contour plots (Fig. 1).
Using Design Expert 12 numerical optimization subroutine design space was explored with the fitted quadratic model to arrive at an optimum fermentation condition. The optimized variables were found using a desirability objective function that assigns relative importance to the responses.
Solutions with higher desirability suggested inoculum age of 48.92 h, temperature of 29.99oC, glucose concentration of 11.56% and urea concentration of 1% could resulted in highest L-glutamic acid production of 25.25.61 mg/ml by Corynebacterium glutamicum X680. Under these conditions, confirmation experiments were conducted in three replicates and the result have good agreement with the predicted model which validate the suitability of the model (Guo et al. 2017; Fahimitabar et al. 2021).
Table 1. RSM for optimizing L-glutamic acid production by BBD
| Run | A: Inoculum age | B: Temperature | C: Glucose | D: Urea | Actual | Predicted |
| 1 | 48 | 32 | 14 | 1 | 16.2 | 16.42083 |
| 2 | 48 | 28 | 14 | 1 | 19.6 | 19.9375 |
| 3 | 48 | 30 | 12 | 1 | 25.4 | 25.48 |
| 4 | 48 | 30 | 12 | 1 | 25.6 | 25.48 |
| 5 | 48 | 30 | 14 | 0.7 | 18.9 | 18.73333 |
| 6 | 60 | 30 | 10 | 1 | 22.1 | 21.97917 |
| 7 | 36 | 32 | 12 | 1 | 18.7 | 18.38333 |
| 8 | 48 | 32 | 10 | 1 | 21.9 | 21.52083 |
| 9 | 48 | 30 | 12 | 1 | 25.4 | 25.48 |
| 10 | 36 | 30 | 14 | 1 | 19.2 | 19.32917 |
| 11 | 36 | 30 | 12 | 0.7 | 20.9 | 20.77083 |
| 12 | 48 | 30 | 14 | 1.3 | 16.7 | 16.5 |
| 13 | 36 | 30 | 10 | 1 | 18.6 | 18.92917 |
| 14 | 48 | 30 | 12 | 1 | 25.7 | 25.48 |
| 15 | 60 | 30 | 12 | 0.7 | 16.4 | 16.22083 |
| 16 | 36 | 30 | 12 | 1.3 | 15.1 | 15.2375 |
| 17 | 60 | 28 | 12 | 1 | 19.1 | 19.45 |
| 18 | 48 | 28 | 12 | 1.3 | 18.1 | 17.84583 |
| 19 | 48 | 28 | 10 | 1 | 19.6 | 19.3375 |
| 20 | 36 | 28 | 12 | 1 | 18.9 | 18.75 |
| 21 | 48 | 30 | 10 | 1.3 | 20.2 | 20.4 |
| 22 | 48 | 28 | 12 | 0.7 | 19.2 | 19.17917 |
| 23 | 48 | 30 | 12 | 1 | 25.3 | 25.48 |
| 24 | 48 | 32 | 12 | 1.3 | 17.9 | 17.92917 |
| 25 | 60 | 30 | 14 | 1 | 17.4 | 17.07917 |
| 26 | 60 | 32 | 12 | 1 | 18.3 | 18.48333 |
| 27 | 48 | 32 | 12 | 0.7 | 17.5 | 17.7625 |
| 28 | 48 | 30 | 10 | 0.7 | 19.1 | 19.33333 |
| 29 | 60 | 30 | 12 | 1.3 | 20.5 | 20.5875 |
Table 2. Statistical analysis of the BBD model
| Source | Sum of squares | df | Mean square | F-value | p-value | Comments |
| Model | 253.3
|
14
|
18.09
|
183.93
|
< 0.0001
|
Significant
|
| A-Inoculum age
|
0.48
|
1
|
0.48
|
4.88
|
0.0443
|
|
| B-Temperature
|
1.33
|
1
|
1.33
|
13.55
|
0.0025
|
|
| C-Glucose
|
15.19
|
1
|
15.19
|
154.39
|
< 0.0001
|
|
| D-Urea
|
1.02
|
1
|
1.02
|
10.38
|
0.0062
|
|
| AB
|
0.09
|
1
|
0.09
|
0.9149
|
0.355
|
|
| AC
|
7.02
|
1 | 7.02
|
71.39
|
< 0.0001
|
|
| AD
|
24.5
|
1 | 24.5
|
249.09
|
< 0.0001
|
|
| BC
|
8.12
|
1 | 8.12
|
82.57
|
< 0.0001
|
|
| BD
|
0.5625
|
1 | 0.5625
|
5.72
|
0.0314
|
|
| CD
|
2.72
|
1 | 2.72
|
27.68
|
0.0001
|
|
| A²
|
72.54
|
1 | 72.54
|
737.44
|
< 0.0001
|
|
| B²
|
73.63
|
1 | 73.63
|
748.51
|
< 0.0001
|
|
| C²
|
51.1
|
1 | 51.1
|
519.44
|
< 0.0001
|
|
| D²
|
100.27
|
1 | 100.27
|
1019.31
|
< 0.0001
|
|
| Residual
|
1.38
|
14 | 0.0984
|
|||
| Lack of Fit
|
1.27
|
10
|
0.1269
|
4.7
|
0.0746
|
not significant
|
| Pure Error | 0.108
|
4
|
0.027 | |||
| Cor Total
|
254.67
|
28
|
||||
Factor coding is Coded.
Sum of squares is Type III – Partial
The Model F-value of 183.93 implies the model is significant. There is only a 0.01% chance that an F-value this large could occur due to noise.
P-values less than 0.0500 indicate model terms are significant. In this case A, B, C, D, AC, AD, BC, BD, CD, A², B², C², D² are significant model terms. Values greater than 0.1000 indicate the model terms are not significant. If there are many insignificant model terms (not counting those required to support hierarchy), model reduction may improve your model.
The Lack of Fit F-value of 4.70 implies there is a 7.46% chance that a Lack of Fit F-value this large could occur due to noise. Lack of fit is bad — we want the model to fit. This relatively low probability (<10%) is troubling.
Figure 1: Three-dimensional Response Surface and contour plots showing most effective interactions among selected variables influencing L-glutamic acid production by Corynebacterium glutamicum X680 (a)Temperature vs inoculum age; (b) glucose vs inoculum age; (c) (c) Urea vs inoculum age; (d) Glucose vs temperature; (e) Urea vs temperature; (f) Urea vs glucose
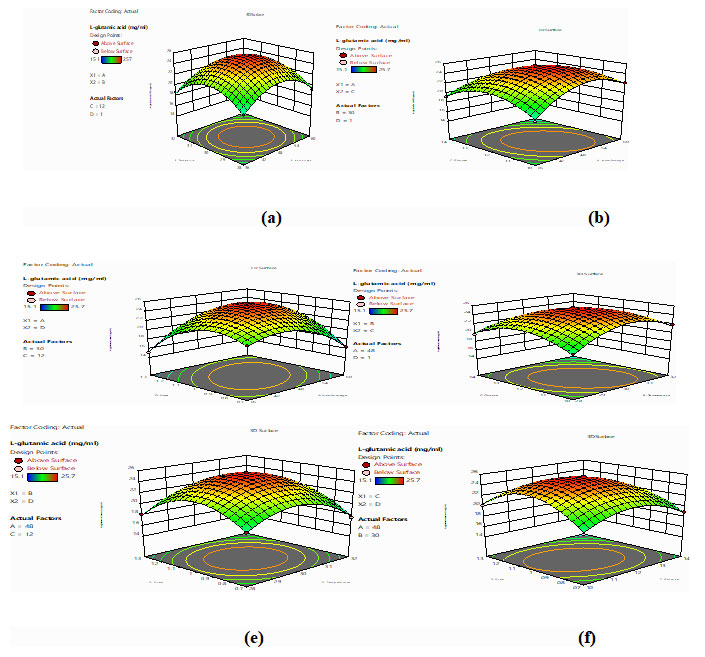
Figure 2: FT-IR for L-glutamic acid (a) Control; (b) Sample
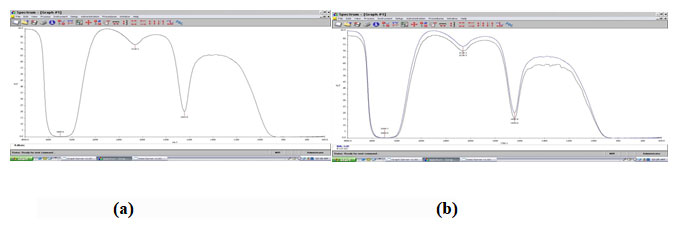
Figure 3: HPLC for L-glutamic acid. (a) Control, (b) Sample
Yang et al. (2014) optimized fermentation conditions using Streptomyces albus Y07 as a high yielding strain through RSM. Nor et al. (2017) made a comparative analysis on medium optimization for L-lysine-methionine production by a newly isolated strain Pendiococcus pentosaceus RF1 using one factor at a time, Response Surface Methodology and artificial neural network (Nor et al. 2017). RSM appeared as a very effective tool for this experiment. Medium optimization for ε-poly-L-lysine production by Streptomyces diastatochromogenes was carried out by Guo et al.
(2017) using RSM. Very recently, Alharbi et al. (2020) noted RSM as a very effective statistical tool for optimizing culture conditions for L-glutamic acid production by Corynebacterium glutamicum NCIM2168, however the production was 16.499g/L. Very recently, Fahimitabar et al. (2021) also applied RSM for optimization of L-glutamic acid by Corynebacterium glutamicum in batch fermentation. In our present study, it has been found that RSM appeared to be a very effective tool so far as the optimization of L-glutamic acid production by the mutant was concerned considering multifactorial interactions at a time (Fahimitabar et al. 2021).
CONCLUSION
The findings of the present study targets RSM that helps to point out the causal relationship between different factors and response using a reliable and robust mathematical model. For the validation of this model, statistical and regression analysis was done. It was found that among different variables involved, most effective variables are inoculum age, 48.92h; temperature, 29.990C; glucose, 11.6% and urea, 1%. Under theses optimum conditions, the predicted response for L-glutamic acid was to be 25.61mg/ml and the actual value was found 25.7mg/ml under the same conditions. These results implied the validity of the predicted value by RSM and experimental value was quite close.
ACKNOWLEDGEMENTS
This study was supported by Dr. Suman Halder, Department of Microbiology, Vidyasagar University, India through his technical assistance in data analysis. Also, authors thank The Bose Institute, Kolkata for arranging necessary instrumental support for sample analysis.
Conflict of interests: Authors declare no conflicts of interests to disclose.
REFERENCES
Alharbi NS, Kadaikunnan S, Khaled JM, et al. (2020) Optimization of glutamic acid production by Corynebacterium glutamicum using response surface methodology. Journal of King Saud University – Science vol 32 No 2 Pages. doi.org/10.1016/j.jksus.2019.11.034.
Ault A (2004) The monosodium glutamate story: the commercial production of MSG and other amino acids. J Chem Educ Vol 81 Number 3 Page 347. doi.org/10A.1021/ed081p347.
Baş B, and Boyaci IH (2007) Modeling and optimization I: Usability of response surface methodology. J Food Eng Vol 78 No 3 Pages 836–845. Doi.org/10.1016/j.jfoodeng.2005.11.024.
Bona R and Moser A (1997). Modelling of the L-glutamic acid production with Corynebacterium glutamicum under biotin limitation. Bioprocess Eng Vol 17 No 4 Pages139-142. doi.org / 10.1007 / PL00008961.
Choi SU, Nihira T, and Yoshida T (2004) Enhanced glutamic acid production of Brevibacterium sp. with temperature shift-up cultivation. J Biosci Bioeng Vol 98 No 3 Pages 211-213. doi.org/10.1016/S1389-1723(04)00268-3.
Das K, Anis M, Azemi MMN et al. (1995) Fermentation and recovery of glutamic acid from palm waste hydrolysate by Ion exchange resin column. Biotechnol Bioeng Vol 48 No 5 Pages551- 555. doi. org/10.1002/bit.260480519.
Delaunay S, Lapujade P, Engasser JM et al. (2002) Flexibility of the metabolism of Corynebacterium glutamicum 2262, a glutamic acid-producing bacterium, in response to temperature upshocks, J. Ind. Microbiol. Biotechnol. 28, 333-337. https://doi.org/10.1038/sj/jim/7000251.
Engels V, Lindner SN and Wendisch VF (2008) The global repressor SugR controls expression of genes of glycolysis and of the L-lactate dehydrogenase LdhA in Corynebacterium glutamicum. J Bacteriol Vol 190 No 24 Page 8033–8044. /doi.org/10.1128/JB.00705-08.
Fahimitabar A, Razavin SMH and Razaei SA (2021) Application of RSM for optimization of glutamic acid production by Corynebacterium glutamicum in batch culture. Heliyon Vol 7 No 6 Pages e07359. doi.org/10.1016/j.heliyon.2021.e07359.
Ganguly S (2019) Isolation, characterization and improvement on a wild strain of Corynebacterium glutamicum for L-glutamic acid production. J Indian Chem Soc Vol 96 No 6 Pages 705-710.
Guo F, Zheng H, Cheng Y, et al. (2017) Medium optimization for ε-poly-L-lysine production by Streptomyces diastatochromogenes using response surface methodology. Lett Appl Microbiol volume 66 No 2 Pages 124-131. doi.org/10.1111/lam.12812
Gourdon P and Lindley ND (1999) Metabolic Analysis of Glutamate Production by Corynebacterium glutamicum. Metab Eng Vol 1 No 3 Pages 224-231. doi.org/10.1006/mben.1999.0122.
Hermann T (2003) Industrial production of amino acids by coryneform bacteria, J Biotechnol Volume 104 Pages 155–172.doi.org/ 10.1016/s0168-1656(03)00149-4.
Hirasawa T and Wachi M (2017) Glutamate Fermentation-2: Mechanism of L-Glutamate Overproduction in Corynebacterium glutamicum. Adv Biochem Eng Biotechnol Volume 159 Pages57-72.doi.org/10.1007/10_2016_26.
Ikeda K (1908) Inventor and assignee A Prod Method Seas Mainly consists salt Lglutamic acid. Japanese Pat. 14805.
Joseph R and Rao TNR (1973) Glutamic acid fermentation employing starchy tubers as raw material. J Food Sci Technol Vol 10 No 4 Pages 160–164. ir.cftri.com/id/eprint/7170
Kinoshita S (1987) Amino acids and nucleotide fermentation: From their genesis to their current state. Developments in Industrial Microbiology Vol 28 Pages1-12.
Kishimoto M, Yoshida T and Taguchi H (1980) Optimization of fed-batch culture by dynamic programming and regression analysis. Biotech Lett Vol 2 Pages 403-408.
Kumagai H (2000) Microbial production of amino acids in Japan. Advances in Biochem Eng/Biotechnol Vol 69 Pages71-75.
Lee LR, Go TH, Lee SM, et al.(2014). In vitro evaluation of new functional properties of poly-γ-glutamic acid produced by Bacillus subtilis D7. Saudi J Biol Sci Vol 21 No 2 Pages153–158. doi.org/ 10.1016/j.sjbs.2013.09.004.
Lindemann B, Ogiwara Y, and Ninomiya T (2002) The discovery of umami. Chemical Senses Vol 27 No 9 Pages 843-844. doi.org/10.1093/chemse/27.9.843
Liu X (2019) Effects of proteases on L-glutamic acid fermentation. Bioengineered Vol 10 No 1 Pages646-658. doi.org/10.1080/21655979.2019.1688224.
Mansouri Y, Zinatizadeh AA, Mohammadi P, et al. (2012). Hydraulic characteristics analysis of an anaerobic rotatory biological contactor (AnRBC) using tracer experiments and response surface methodology (RSM), Korean Journal of Chemical Engineering, 29, 891–902. https://doi.org/10.1007/s11814-011-0269-0.
Nanninga HJ and J.C Gottschal JC (1985) Amino acid fermentation and hydrogen transfer in mixed cultures. FEMS Microbiol Ecol Vol 1 No 5 Pages 261-269. doi.org/10.1111/j.1574-6968.1985.tb01158.x.
Nadeem S, Muzammil, HM, Niaz B. et al. (2011) Optimising Carbon and Nitrogen Sources for L-Glutamic acid Production by Brevibacterium strain NIAB SS67. Pak J Zool Vol 43 No 2 Pages 285-290.
Neubeck M, Prenner E, Horvat P, et al. (1993) Membrane fluidity in glutamic acid-producing bacteria Brevibacterium sp. ATCC 13869. Arc Microbiol Vol 160 Pages101-107.
Niaz B, Muzammil HM, Nadeem S, et al. (2009) Optimization of Fermentation Conditions for Enhanced Glutamic Acid Production by a Strain of Corynebacterium glutamicum NIAB BNS-14. Pak J Zool Vol 41 No 4 Pages 261-267.
Nishio Y, Ogishima S, Ichikawa,M, et al. (2013) Analysis of L-glutamic acid fermentation by using a dynamic metabolic simulation model of Escherichia coli. BMC Systems Biology Vol 7 Pages92-103.
Nor MN, Mohamed MS, Loh TC, et al. (2017) Comparative analyses on medium optimization using One-factor-at-a-time, response surface methodology, and artificial neural network for lysine-methionine biosynthesis by Pediococcus pentosaseus RF 1. Biotechnol. Biotechnol. Equip Vol 31 Issue 5 Pages 935-947. doi.org/10.1080/13102818.2017.1335177.
Ritthausen H, Glutaminsäure UD (1866) Ueber die Glutaminsäure. J für Prak Chem Vol 99 No 1 Pages454–462.
Sgobba E, Blöbaum I and Wendisch VF (2018) Production of Food and Feed Additives from Non-food-competing Feedstocks: Valorizing N-acetylmuramic Acid for Amino Acid and Carotenoid Fermentation with Corynebacterium glutamicum. Frontiers Microbiology Vol 9 Article 2046. doi.org/10.3389/fmicb.2018.02046.
Sano C (2009) History of glutamate production. Am J Clin Nutr Vol 90 No 3 Pages728S-732S. doi.org/10.3945/ajcn.2009.27462F.
Shyamkumar R, Moorthy IMG, Ponmurugan K et al. (2014) Production of L-glutamic Acid with Corynebacterium glutamicum (NCIM2168) and Pseudomonas reptilivora (NCIM2598): A Study on Immobilization and Reusability. Avicenna J Med Biotechnol Vol 6 No 3 Pages 163–168. PMID: 25215180
Takeno S , Ohnishi J, Komatsu T, et al. (2007) Anaerobic Growth and Potential for Amino Acid Production by Nitrate Respiration in Corynebacterium glutamicum. Appl. Microbiol Biotechnol Vol 75 Pages1173-82. doi.org/10.1007/s00253-007-0926-8.
Tarek M and Mostafa HE (2010) Screening of potential infants’ lactobacilli isolates for amino acids production. Afr J Microbiol Res Vol 4 No 4 Page 226–232.
Tsuchida T, Kubota K, Yoshihara Y, et al. (1987) Fermentative Production of L-Glutamine by Sulfaguanidine Resistant Mutants Derived from L-Glutamate Producing Bacteria. Agric Biol Chem Vol 51 No 8 Pages2089-2094. doi.org/10.1080/00021369.1987.10868368.
Vuoristo KS, Mars AE, Sangra JV, et al. (2015) Metabolic engineering of the mixed-acid fermentation pathway of Escherichia coli for anaerobic production of glutamate and itaconate. AMB Expr Vol 5 Page 61-71. creativecommons.org/licenses/by/4.0 /
Wen J and Bao J (2019) Engineering Corynebacterium glutamicum triggers glutamic acid accumulation in biotin-rich corn stover hydrolysate. Biotechnology for Biofuel Vol 12 Page 86-96.
Wendisch VF, Jorge JMP , García FP et al. (2016) Updates on Industrial Production of Amino Acids Using Corynebacterium glutamicum.
World J Microbiol Biotechnol Vol 32 Page 105. doi.org/10.1006/mben.1999.0122
Xiong JS, Branigan D and Li M (2009). Deciphering the MSG controversy. Int J. Clin. Exp. Med. 2, 329-336. PMCID: PMC2802046.
Yang Y, Wang H, Wang H, et al. (2014) Optimization of Fermentation conditions of €- poly L-lysine by Response Surface Methodology. Advanced Materials Research Vol 934(2014) Pages 96-103.
Zafar A and Mahmood ZA (2015) Microbial amino acids production. In book: MICROBIAL BIOTECHNOLOGY – Progress and Trends, CRC Press Chapter 9(1), 25. https://www. researchgate. Net / publication / 272179932.
Zareian M, Ebrahimpour A, Bakar FA, et al. (2012) A Glutamic Acid-Producing Lactic Acid Bacteria Isolated from Malaysian Fermented Foods. Int J Mol Sci Vol 13 Pages 5482–5497.doi.org/10.3390/ijms13055482.

