S.Palanivel Rajan*![]() and M.Paranthaman
and M.Paranthaman![]()
Department of Electronics and Communication Engineering, M.Kumarasamy College of Engineering, Karur, Tamilnadu, India.
Corresponding author email: drspalanivelrajan@gmail.com
Article Publishing History
Received: 11/10/2019
Accepted After Revision: 30/11/2019
Heart sound (HS) impede with lung sounds in a manner that obstructs the prospective of respiratory sound analysis in terms of diagnosis of respiratory disease. Lung sound (LS) signal measurements are taken to aid in the diagnosis of various diseases. Their elucidation is difficult however due to the presence of hindrance generated by the heart. Sound samples are recorded using Electronics stethoscope consist of both HS and LS where LS is separated from the HS for Asthma analysis at the crucial stage of the disorder. This proposal involves two main segments namely Respiratory Sound separation and analysis of the resultant LS. The separation of LS involves detection, annulment, localization and alignment of HS segments, modeling and prediction of LS. The recorded sound is given as output to the HS detection block and the segments of HS are detected using Multi resolution Analysis (MRA).
Heart Sound, Lung sound, Adaptive Filters, LabVIEW, Electoroculogram (EOG) ,Cursor control, Human Computer Interaction (HCI), LabVIEW.
Rajan S. P, Paranthaman M. Novel Method for the Segregation of Heart Sounds from Lung Sounds to Extrapolate the Breathing Syndrome. Biosc.Biotech.Res.Comm. 2019;12(4).
Rajan S. P, Paranthaman M. Novel Method for the Segregation of Heart Sounds from Lung Sounds to Extrapolate the Breathing Syndrome. Biosc.Biotech.Res.Comm. 2019;12(4). Available from: https://bit.ly/345otcJ
Copyright © Rajan and Paranthaman This is an open access article distributed under the terms of the Creative Commons Attribution License (CC-BY) https://creativecommns.org/licenses/by/4.0/, which permits unrestricted use distribution and reproduction in any medium, provide the original author and source are credited.
INTRODUCTION
Consistently 100 to 150 million individuals around the globe experience the ill effects of asthma and this number is expanding. Every year 1, 80,000 individuals kick the bucket because of asthma around the world. In India 15-20 million individuals have been evaluated to be influenced by Asthma.(Babu, 2019). Auscultation is a standout amongst the most vital non-intrusive and straightforward analytic devices for identifying issue in the respiratory tract like lung illnesses (AyeshaRumana.2014). It is characterized as the demonstration of listening for sounds inside the body, chiefly for learning the state of the lungs, heart and different organs (Palanivel Rajan, 2014). Sicknesses, for example, asthma, and tuberculosis can be related to this technique through the examination of lung and tracheal sounds. Research on the diagnosis of respiratory pulmonary conditions like bronchitis, sleep apnea, asthma has established the utility of the stethoscope’s acoustic signal in common day to day practice. However, despite their effectiveness, these instruments only provide a limited and subjective perception of the respiratory sounds. The drawbacks of using stethoscopes and listening to the sounds using the human (ear area) their inability to provide an objective study of the respiratory sounds detected, their lack of sufficient sensitivity and (c) the existence of the imperfect system of nomenclature (Thato, 2008).In the last few decades, improvements in electronic recording and the development of computer-based methods have made quantitative studies of lung and tracheal sound signals possible as well as overcome many limitations of human ear subjective auscultation. Modern digital processing techniques, along with advancements in computer analysis, have become an established research method for the investigation of respiratory sounds (Palanivel Rajan 2019).
Automated respiratory sound analysis can quantify changes in lung sounds, de-noise the signals of interest from any artifacts and nosiness, store records of the measurements made, and produce graphical representations of characteristic features of the respiratory sounds to help with the diagnosis and treatment of patients suffering from various lung diseases (Xie, 2019).
In view of the fact that lung sounds have quite low frequency and low intensity, interfering sounds (i.e., heart sounds) from the lung sounds prior to any diagnostic analysis. Efficacy of stethoscope plays an important role in the diagnosis of respiratory pulmonary conditions like bronchitis, sleeapnea, asthma in common day to day practice. Asthma is a persistent lung disease, a very common respiratory condition also known as reactive air way disease. Asthma causes an inflammation and constriction of bronchial walls leading to a series of complications in breathing. Asthma can be diagnosed by the presence of the signs and symptoms. Confirmed diagnosis is performed using pulmonary function tests, chest x-rays and blood tests.The authors offered some diagnostic methods to be had for asthma by assessing the breathing patterns for asthmatic patient and also paying attention the need for the computational analysis of breathing pattern, alternate solution to diagnose asthma at the primary stage (Huang, 2019).
In the past decades developments of electronic recording using computer–based method have made recent researches in the area of lung and tracheal sound signal analysis. Recent advancements in computer analysis and modern digital signal processing techniques have established more research methodologies in the investigation of respiratory sound. Biological signals are often noisy and non stationary. These factors tremendously complicate analysis of bio-signals. Respiratory sounds present on invasive measures of lung air way conditions. However, features of lung sounds (LS) may be contaminated by heart sounds (HS) because lung and heart sounds overlap in terms of time domain and spectral content .Generally, all LS originate from air ways during inspiration expiration cycles .The LS propagating through lung tissues in the par enchyma can be heard over the chest wall using a sound-transducer. The tissue acts as a frequency filter like structure whose characteristics vary according to pathological and indeed physiological changes, (Palanivel Rajan, 2017).
Auscultation is one of the most important non-invasive and simple diagnostic tools for detecting disorders in the respiratory tract like lung diseases. However, despite their effectiveness, these instruments only provide a limited and subjective perception of the respiratory sounds. The drawbacks of using stethoscopes and listening to the sounds are using the human ear area, and their inability to provide an objective study of the detected respiratory sounds. They lack sufficient sensitivity and the existence of imperfect system of nomenclature. (Vijayprasath, 2015).
Besides the fact that normal and abnormal lung sounds are mixed in the air ways and therefore pose a problem of classification of respiratory diseases, semi-periodic HS from heart beat activity invariably interferes with the LS and therefore masks or inhibits clinical interpretation of LS particularly over low frequency components.( Gnitecki, 2007) The main frequency components of HS are in the range 20-100Hz. This is the range in which LS have major components .Therefore, since HS and LS overlap in frequency and are somewhat non-stationary, the major problem being faced in separating HS from LS is doing so without tempering with the main characteristic features of the LS.
Generally, LS are produced during inspiration and expiration cycles, and are found in the frequency range 20 – 1200 Hz. There are two types of lung sound, namely, normal and abnormal lung sounds. Normal breath sounds can be categorized into three classes: bronchial, bronchi vesicular, and vesicular sounds. Each class of sounds is detected during auscultation according to the characteristics described in (Gao, 2010).HSs are clearly audible in lung sounds recorded on the anterior chest and may be heard to a less ere tent in lung sounds recorded over posterior lung lobes.
High-pass filtering of lung-sound recordings to reduce heart sounds would remove significant components of lung sounds. Filtering techniques are categorized as linear adaptive filters and filters employing time-frequency based methods. Several filtering schemes are outlined within these two categories. In (Gnitecki, 2003), a recursive least squares (RLS)based adaptive noise cancellation (ANC) filtering technique is proposed to separate or reduce the HS from LS. Here, a band pass filtered version of the recorded HS was used as the reference signal. Time frequency (TF) filtering techniques have also been proposed for HS reduction in LS (Palanivel Rajan, 2013). Methods of heart sound localization are indicated in conjunction with the studies of heart-sound cancellation. Same researchers confirm that the adaptive filter is more effective in reducing noise from time series data than linear filters, wavelet shrinkage, and chaos based noise reduction schemes. The simplest method to reduce HS effects is to apply a high pass filter with cut-off frequency from 50-150Hz (Schuttler, 1997).
More complex methods to reduce HS from breath sound recordings have been described in the literature as adaptive filtering techniques (Potdar, 2012), wavelet denoising, and combination of HS localization and removal and LS prediction.
Respiratory sounds present non invasive measures of lung air way conditions (Mayorga, 2019). However, features of lung sounds may be contaminated by heart sounds because lung and heart sounds overlap in terms of time domain and spectral content. Heart sounds are clearly audible in lung sounds recorded on the anterior chest and may be heard to a lesser extent in lung sounds recorded over posterior lung lobes.
Lung sounds are produced by vertical and turbulent flow within lung air ways during inspiration and expiration of air [. Lung sounds recorded on the chest wall represent not only generated sound in lung airways brutal so the effects of thoracic tissues and sound sensor characteristics on sound transmitted from the lungs to a data acquisition system . Lung sounds exhibit a Power Spectral Density (PSD) that is broad band with power decreasing as frequency increases (Hadjileontiadis, 1998).
The logarithm of amplitude and the logarithm of frequency are approximately linearly related in healthy subjects provided that the signals do not contain adventitious sounds. As the flow in lung airways increases, sound intensity increases and several mathematical relations between lung sounds and airflow have been proposed. It is important to note that inspiratory and expiratory lung sounds differ in terms of both amplitude and frequency range. At comparable flows, aspiratory lung sounds will exhibit greater intensity than expiratory sounds. (Mohanapriya, 2013).
Heart sounds are produced by the flow of blood into and out of the heart and by the movement of structures involved in the control of this flow. The first heart sound results when blood is pumped from the heart to the rest of the body, during the latter half of the cardiac cycle, and it is comprised of sounds resulting from the rise and release of pressure within the left ventricle along with the increase in ascending aortic pressure . After blood leaves the ventricles, the simultaneous closing of the semi lunar valves, which connect the ventricles with the aorta and pulmonary arteries, causes the second heart sound.
The Electrocardiogram (ECG) represents the depolarization and repolarization of heart muscles during each cardiac cycle, (Gao, 2011). Depolarization of ventricular muscles during ventricular contraction results in three signals known as the Q, R, and S-waves of the ECG .The first heart sound immediately follows the QRS complex. In health, the last30–40% of the interval between successive R-wave peaks contains a period that is void off instant second heart sounds.
Characteristics of heart sound signals have been assessed in terms of both intensity and frequency. Though peak frequencies of heart sounds have been shown to be much lower than those of lung sounds, comparisons between lung sound recordings acquired over the anterior right upper lobe containing and excluding heart sounds show that PSD in both cases is maximal below150 Hz.(Xie, 2019).
MATERIAL AND METHODS
A New Approach using the HS Filtering Technique
The method was analyzed using Advanced Signal Processing tool kit of LabVIEW. Lung sound is separated from Heart recordings using wavelet analysis tools and time series analysis tools. The Discrete Wavelet Transform (DWT) is applied to the recorded RS signal and locates the HS segments automatically and accurately using multiscale products. Initially, detection, localization and cancellation of HS included segments are performed using wavelet analysis tools. Time series analysis tools are used in modeling and predicting the HS removed portions of original RS Signal decomposition is done by wavelet functions. For each wavelet, wavelet transform calculates the inner products of the analyzed signal and localized in both time and frequency domains, so non-stationary signals are processed only using wavelet signal processing. Based on adaptive time frequency resolution of wavelet signal processing, multi resolution analysis on non-stationary signals is carried out. Simultaneous long term and short term variations can be studied using wavelet transform-based multiscale analysis,( Palanivel Rajan, 2014)
Multi scale product of wavelet approximation coefficients is computed in detecting the heart sounds. In wavelet decomposition three scales were used by considering fifth-order Symlet wavelet as the mother wavelet. The behavior of signal and noise is totally different in the wavelet domain. Concept of Lipschitz regularity is used in analyzing the behavior of signal and noise.
The singularities are identified by multiplication of the DWT coefficients between the decomposition levels. In HS segment detection in RS signal is done by obtaining the multi scale product of the wavelet coefficients. The specified level of the signal is decomposed by Multi resolution Analysis VI and signal reconstruction is performed for the selected frequency bands (Sathesh, 2012)
The next step proposed is the HS localization. This Approach relies on the different behavior presented by the HS and RS across the wavelet scales. It uses the multi scale product at level 3 as a measure to detect singularities that in our case represent HS– included segments within the RS record. It is important to mention that the segment size that includes HS and is removed in this HS cancellation method is variable instead of being fixed sized blocks.( Thato, 2007).
Wavelets functions are used in signal decomposition. The inner products of the analyzed signal and a family of wavelets are computed using wavelet transform. In time and frequency domain, wavelets are localized. So wavelet signal processing is best suited for non-stationary signals.
RESULTS AND DISCUSSION
During breathing lung sounds propagate through the lung tissue and can be heard over the chest wall. The tissue acts as a frequency filter with special characteristics based on Pathological changes. Therefore, auscultation and acoustical analysis of lung sounds are primary diagnostic assessments for respiratory diseases.
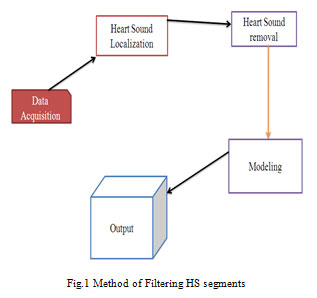 |
Figure 1: Fig.1 Method of Filtering HS segments |
The main components of Heart Sounds (HS) are in the range 20–100Hz, in which the lung sound has major components. High Pass Filtering (HPF) with an arbitrary cut-off frequency between 70 and 100 Hz is not efficient in this case because lung sounds have major components in that region particularly at low flow rates. Therefore, HS reduction from lung sounds without altering the main characteristic features of the lung sound has been of interest for many researchers (Tung, 2011).
There are dissimilar methods that have been applied for filtering heart sounds from lung-sound recordings as those that require a separate noise reference and those that do not, namely linear adaptive filters and filters employing time-frequency based methods respectively. These methods are compared on the basis of reduction in heart sounds and alteration to lung sounds by filtering.
There are four main components to a linear adaptive filter: the input or “reference” signal; the output of the adaptive filter; the desired filter response or “primary” signal; and the estimation error, which is the difference between the filter output and desired response. The term “linear” refers to the physical implementation of a linear adaptive filter, which employs the principle of super position between its input and output signals. In reality, the internal structure of a linear adaptive filter is highly non linear. A recursive algorithm within the adaptive filter updates filter parameters with each iteration (in discrete time operation) so as to minimize the estimation error.
Noise cancellation and linear prediction are the two main classes of linear adaptive filters that have been applied to lung sound recordings for reducing heart sounds. Linear prediction serves to develop a model of a signal based on its past or future values. In adaptive noise cancellation, the primary input contains both the noise to be removed by the adaptive filter, and the signal of interest. The reference signal represents the noise portion of the primary input; thus, the filter output is a signal that models the noise in the input, and the signal of interest is determined by subtracting the filter output from the primary input. Following schemes of adaptive filters are used: Least Mean Squares (LMS), Fourth-Order Statistics (FOS), Recursive Least Squares (RLS), Block Fast Transversal (BFT), and Reduced Order Kalman (ROK).
Short-Time Fourier Transform (STFT) and wavelets provide means of examining signals simultaneously in both time and frequency domains. STFT or spectrogram, presents intensity of data within segments of constant time and frequency resolution. If data are non-stationary, window sizes must be chosen such that data within the windows are at least wide-sense stationary. This limits window size and hence spectral resolution. Wavelet Transform (WT) analysis provides more flexibility in terms of resolution and does not require that data be stationary.
To localize heart sounds, the spectrogram was threshold within 10–110Hz per breath phase using a threshold incorporating the mean and standard deviation of average power calculated for both inspiratory and expiratory lung sounds (separately).Segments that corresponded to heart sounds were either completely removed from the spectrogram, or band-stop filtered using a 20–300 Hz band; in each case, gaps were created. Two dimensional interpolations, accounting for frequency and phase, were applied within each gap to recreate lung sounds based on the lung sounds occurring before and after the gap. Time domain signals were reconstructed using inverse STFT, and results were assessed using PSD comparisons between filtered and unfiltered data.
A study involving heart-sound localization and removal from lung sounds using WT also employed complete elimination of regions containing heart sounds as determined via thresholding. Three scales were used in wavelet decomposition with the fifth-order Symlet wavelet as the mother wavelet. The product of two adjacent decomposition bands, or the “multi scale product,” was calculated for heart sound localization, and five standard deviations plus the mean value of lung sounds outside of heart-sound regions defined the threshold for heart-sound localization. After removal of regions within each wavelet resolution level that corresponded to multi scale products that exceed the threshold, the lung sounds within these regions were modeled using either AR or MA modeling.
Wavelet-like multi resolution analysis for heart-sound localization was applied in another study in which sub bands were created by filtering lung-sound recordings using half band low pass and high-pass filters and decimating each filtered sequence by a factor of two. This procedure was repeated for each low-pass-filtered sub band, creating N levels, each successive level having half the bandwidth, twice the frequency resolution, and half the time resolution of its predecessor, which is what results from WT as well. Using the time delay estimation scheme based on BFTF (block fast transversal filtering), time delays were determined within sub band levels four and five, which consistently matched. This delay was then applied to each of eight sub band of the reference heart-sound signal, and eight corresponding sub bands of the primary input (lung sounds containing heart sounds) were adaptively filtered for heart-sound removal. The filter output and error signals per sub band were reconstructed using an inverse scheme.
Daubechies quadrature mirror filters of eight coefficients were used for WT calculation in two studies employing wavelets for the removal of heart from lung sounds. In that method, (Huang, 2019) a threshold was applied to wavelet coefficients within each of 11 scales, which was defined by the standard deviation of the WT multiplied by a constant adjusting multiplicative factor chosen experimentally based on data recordings from individual subjects. The coefficients were separated per scale as those larger than the threshold and those smaller than the threshold. Reconstruction of coherent and residual signals from these groups of coefficients was performed across scales, representing the heart sounds (noise) and lung sounds (denoised data), respectively. The procedure was repeated in an iterative manner on the residual signals until the difference between the expected values of two re-successive residuals was less than a small constant (chosen as 0.00001). This stopping criterion implies that these waveforms were correlated and any coherent signal was no longer significantly present in (Huang, 2019). After the last iteration, the coherent parts obtained at each iteration of the procedure were summed, forming the heart sounds removed from lung sounds.
As the first step of HS cancellation, the LS segments including HS must be identified. The premise of the proposed method in this paper is the HS localization technique. This approach relies on the different behaviors presented by the HS and LS across the wavelet scales. It uses the multi scale product at level3 to detect singularities that in our case represent HS-included segments within the LS record. It is important to mention that the segment size that includes HS and is removed in this HS cancellation method is variable instead of being fixed sized blocks. This algorithm is explained in detail in (Mayorga, 2019).
Once the HS segments were localized and removed from the set off wavelet coefficients, the next step is to estimate the removed data. The length of the removed segment was different depending on the detected HS segment above the threshold. On average it was 100ms. In (Babu, 2019), estimating the removed data is done by linear prediction, using either Autoregressive (AR) or Moving Average (MA) models. A Rand MA models are two common signal processing tools used to predict past or future values of a time-limited signal. The predicted samples are basically weighted linear combinations of the signal known values. It is too simple to as some that lung sounds are stationary during the entire duration of are aspiratory cycle (inspiration/expiration) especially at the vicinity of the onset so breathe. Therefore, correct selection of the order as well as the type of linear prediction model (AR or MA) must be done carefully to ensure the data used for prediction of the gaps are indeed stationary (Babu, 2019).In this paper, regardless of the flow rate, ARMA modeling and prediction is used.
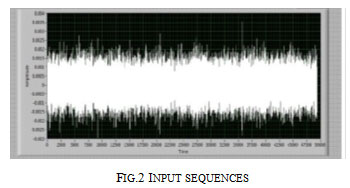 |
Figure 2: Input sequences |
The input wave shape of original and abnormal recorded sample is shown in figure 2 is employed in investigation the heart sounds by getting the multiscale product of ripple approximation coefficients as shown in figure 3. Figure 4 shows the design of front panel for cancellation of heart sounds from respiratory sounds linear predictive filter. Localization of heart sound in original signal and abnormal signal by from the singularities within the HS segments were performed by linear prediction and modeling. It is found that Adaptive filtering and use of wavelets are the best methods for locating heart sounds without noise.
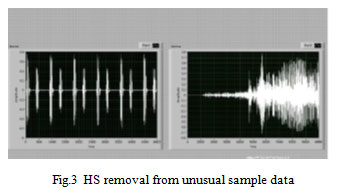 |
Figure 3: HS removal from unusual sample data |
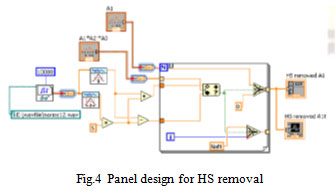 |
Figure 4: Panel design for HS removal |
CONCLUSION
Once HS segments are identified then the medical experts can easily identify the prone diseases. We are planning to develop a simple model using LabVIEW since LabVIEW is a graphical programming environment used by millions of engineers and scientists to develop sophisticated measurement, test, and control systems using intuitive graphical icons and wires that resemble a flowchart. The software tool implemented in the design for data acquisition is LabVIEW, selected primarily for its vast graphical capabilities and flexibility in design.
REFERENCES
Ayesha Rumana.T, Smitha.M, (2014) Separation of Respiratory sound from Heart sound for Asthma analysis, International Journal of Research in Applied science and Engineering Technology, pp 7-14
Babu K.A, B. Ramkumar and M. S. Manikandan, (2019) Empirical Wavelet Transform Based Lung Sound Removal from Phonocardiogram Signal for Heart Sound Segmentation, ICASSP 2019 – 2019 IEEE International Conference on Acoustics, Speech and Signal Processing (ICASSP), Brighton, United Kingdom, pp. 1313-1317.
Gao,J.,Hu,J.and Tung,W (2011) Facilitating joint chaos and fractal analysis of Biosignal through nonlinear adaptive filtering. PLoSOne, e24331.
Gao J.B., Sultan H., Hu J. and Tung W.W. (2010) Denoising nonlinear time series by adaptive filtering and wavelet shrinkage: A comparison. IEEE Signal Processing Letters, pp 237-240.
Gnitecki.J, Moussavi.Z, (2007) Separating heart sounds from lung sounds, IEEE in Engineering in Medicine and Biology Magazine, pp 20-29.
Gnitecki,J., Moussavi,Z. and Pasterkamp,H. (2003) Recursive least squares adaptive noise cancellation filtering for heart sound reduction in lung sounds recordings. Proceedings of the 25th Annual International Conference of the IEEE, Engineering in Medicine and Biology, pp 2416-2419.
Hadjileontiadis.L.J. and Panas. S.M. (1998) a wavelet-based reduction of heart sound noise from lung sounds. International Journal of Medical Informatics, pp183-190.
Huang, H D. Yang, X. Yang, Y. Lei and Y. Chen, Portable multifunctional electronic stethoscope,(2019) IEEE 3rd Information Technology, Networking, Electronic and Automation Control Conference (ITNEC), Chengdu, China, pp. 691-694.
Mayorga P, J. A. Valdez, C. Druzgalski and V. Zeljković, (2019) Separation of Cardiopulmonary Acoustic Indicators, 2019 Global Medical Engineering Physics Exchanges/ Pan AmericanHealth Care Exchanges (GMEPE/PAHCE), Buenos Aires, Argentina, pp. 1-1.
Mohanapriya.S, Vadivel.M, Automatic retrival of MRI brain image using multi queries system, (2013) International Conference on Information Communication and Embedded Systems (ICICES), INSPEC Accession Number: 13485254, Electronic ISBN: 978-1-4673-5788-3, DOI: 10.1109/ICICES.2013.6508214, pp. 1099-1103, 2013.
Palanivel Rajan .S, R. Sukanesh, S. Vijayprasath (2014) Assessment of Relationship between Heart Rate Variability and Drowsiness of Post Operative Patients in Driving Conditions, Health MED, vol.8, no.2, pp. no: 211-211.
Palanivel Rajan S, V.Kavitha,(2017) Diagnosis of Cardiovascular Diseases using Retinal Images through Vessel Segmentation Graph, Current Medical Imaging Reviews (Bentham Science Publisher), Online ISSN No.: 1875-6603, Print ISSN No.: 1573-4056, Vol. No.: 13, Issue : 4, pp. 454-459, (Impact Factor–0.613)
Palanivel Rajan S, R. Sukanesh,(2013) Viable investigations and real-time recitation of enhanced ECG-based cardiac telemonitoring system for homecare applications: A systematic evaluation, Telemedicine and e-Health, Vol.19, No.4, pp. no: 279.
Palanivel Rajan S, Vivek C, (2019) Analysis and design of microstrip patch antenna for radar communication”, Journal of Electrical Engineering & Technology, Online ISSN No.: 2093-7423, Print ISSN No.: 1975-0102, DOI : https://doi.org/10.1007/s42835-018-00072-y.
Palanivel Rajan S, (2014) A Significant and Vital Glance on Stress and Fitness Monitoring Embedded on a Modern Telematics Platform, Telemedicine and e-Health Journal, ISSN: 1530- 5627 (Online ISSN: 1556-3669), Vol. No.: 20, Issue No.: 8, pages: 757-758.
Potdar,R.M., Anup,M., Vinni,S. and Tripti,R. (2012) Performance evaluation of different adaptive filtering algorithms for reduction of heart sound from lung sound. International Journal of Engineering and Advanced Technology (IJEAT), pp 61-67.
Sathesh,K. and Muniraj N.J.R. (2012) Survey on separation of heart sounds from lung sounds by adaptive filtering. International Journal of Microsystems Technology and its Applications (IJMTA), pp1-10.
Schuttler,F., Penzel,T. and Wichert,P.V. (1997) Digital recording and computer-based analysis of lung sounds. Proceedings of the 18th Annual International Conference of the IEEE Engineering in Medicine and Biology Society. pp 2301-2302.
Thato,T. and Saeid,S. (2007) Separation of heart sound signal from lung sound signal by adaptive line enhancement. Proceedings of 15th European Signal Processing Conference (EUSIPCO) ,pp 1231-1235.
Thato,T. (2008) Digital signal processing algorithms and techniques for the enhancement of lung sound measurements. Ph.D.Thesis, Lough borough University, Lough borough.
Tung,W.W., Gao,J. B., Hu J. and Yang L. (2011) Recovering chaotic signals in heavy noise environments. Physical Review E, pp 171-182.
Vijayprasath. S. Palanivel Rajan S (2015) Performance Investigation of an Implicit Instrumentation Tool for Deadened Patients Using Common Eye Developments as a Paradigm, International Journal of Applied Engineering Research, ISSN: 0973-4562, Vol.10, No. 1, pp.925-929.
Xie Y, Xie K and Xie S,(2019) Underdetermined Blind Source Separation for Heart Sound Using Higher-Order Statistics and Sparse Representation, in IEEE Access, vol. 7, pp. 87606-87616.

