1*Women Scientist (WOS B, DST), Department of Zoology, Km. Mayawati Government Girls P.G. College, Badalpur, Gautam Budha Nagar (U.P.) – 203207
2Mentor/Supervisor, Associate. Professor and Head, Department of Zoology,
Km. Mayawati Government Girls P.G. College, Badalpur, Gautam Budha Nagar (U.P.) – 203207
Corresponding author email: azminqv@gmail.com
Article Publishing History
Received: 06/10/2019
Accepted After Revision: 10/12/2019
In this research was developed low-cost gravitational force based colorimetric microfluidic device for diagnostic purpose. Microfluidic system was developed by using discarded pen refills. The refill was filled with three layers of polymer. Bottom of the refill wasfilled with the polymer polyvinyl chloride (PVC). Second layer from the bottom i.e the layer above PVC layer wasfilled with silica gel immobilized with horse radish peroxidase (HRP), glucose oxidase (GOD) and o- dianisidine (dye). Whereas, third and the top most layer wasfilled with untreated silica gel. One drop of blood waspoured at the inlet of microfluidic devices. Without applying any external power, blood moved through the silica packed region by the gravitational pull and capillary action of silica gel. Serum separation started within 30 seconds and subsequently within 2 min., serum successfully separated from the blood by pure silica gel. The separated serum then came in contact with the silica gel immobilized with enzymes and dye. The colour of the silica beads immobilized with enzymes and dye changed from white to orange when came in contact with glucose in serum. Determination of the glucose in the blood was carried out on a desktop scanner. The developed microfluidic device does not require (i) pump or device to propel the fluid (ii) any type of special mesh or sieve to separate the serum from the blood. Microfluidic device developed is cheap and suitable for low cost setting areas.
Gravitational Force-Based Microfluidic Device, Point-of-Care Diagnostics, Blood Glucose Assay, Silica Gel, Low Cost
Naqvi A, Sharma D. C, Gautam H. Low-Cost Gravitational Force Based Colorimetric Microfluidic Device for Assaying Blood Glucose. Biosc.Biotech.Res.Comm. 2019;12(4).
Naqvi A, Sharma D. C, Gautam H. Low-Cost Gravitational Force Based Colorimetric Microfluidic Device for Assaying Blood Glucose. Biosc.Biotech.Res.Comm. 2019;12(4). Available from: https://bit.ly/36lLqcK
Copyright © Naqvi et al., This is an open access article distributed under the terms of the Creative Commons Attribution License (CC-BY) https://creativecommns.org/licenses/by/4.0/, which permits unrestricted use distribution and reproduction in any medium, provide the original author and source are credited.
INTRODUCTION
The field of microfluidics is characterized by the study and manipulation of fluids at the submillimetre length scale. Most of the microfluidic devices often require one or more pumps to propel fluid through microchannels or additional power supply as driving force (Araci and Quake, 2012) which makes the system quite expensive and complicated. Gravitational pulls based microfluidic devices are cheap and simple to operate (Huh et al., 2007). However, these devices are hard to develop since they are based on only gravitational force. Rhee et. al. have described the hydrodynamic and gravitational force-based positioning of cells within microfluidic devices that can be implemented without special equipment or fabrication steps (Rheem et al., 2007). Yao et al. (2004) have developed a gravity and electric force driven microfluidic device for cell sorting (Yao et al., 2004). Most of the work related to gravitational pull based microfluidic device reported till now are mainly related to the area of cell sorting and particle separation. There are hardly any reports on the gravitational pull based microfluidic devices, which are used for detecting glucose in the blood, (Sackmann et al., 2014).
Diabetes is one of the principal causes of death and disability in the developing world and is highly responsible for heart disease, kidney failure, and blindness. It is a major cause of mortality in the age group of 20–79 years. Based on its rapidly increasing incidence, diabetes has been declared a global epidemic by the World Health Organization (WHO) (Derek et al., 2006). Frequent testing of physiological blood glucose levels to avoid diabetic emergencies is crucial for the confirmation of effective treatment. There have been continuously increasing research efforts in the field of glucose monitoring during the last few decades. The frequent monitoring of blood glucose is critical for diabetic management, as the maintenance of physiological glucose level, i.e., 4–8 mM (72–144 mg/dL), is the only way that a diabetic can lead a healthy lifestyle by avoiding life-threatening diabetic complications, such as diabetic retinopathy, kidney damage, heart diseases, stroke, neuropathy and death.
The most widely used glucose monitoring devices are blood glucose meters which are based on minimally-invasive fingerstick tests that have a substantial market. Several continuous glucose monitoring systems (CGMS), which are presently more than five years old, can also detect glucose at low levels (Bode et al., 2008). Most of the CGMS employ minimally-invasive approaches that involve the use of subcutaneous sensors to determine the glucose concentration in interstitial fluid. Therefore, they cause discomfort to patients, require more frequent calibration by fingerstick tests and cannot be used for more than a few days, as the sensor is prone to biofouling. However, the main limitation is their extremely high cost, which is beyond the reach of most diabetics. Besides this, it also requires calibration with blood glucose testing and change of the sensor after a few days. This strictly limits their use to only selected clinical scenarios, where they are critically required.
Glucose oxidase (GOD)-based glucose biosensors have prevalently held the glucose sensor research and development over the last four decades and the market place as well. This is due to the good stability of GOD that makes the glucose/glucose oxidase system a very convenient model for glucose detection. There is a high demand for sensitive and reliable blood glucose monitoring in biological and clinical aspects. However, the high cost of glucose sensors available in the market is one of the main disadvantages of enzyme-based glucose determination. Therefore, the development of a low-cost detection system that can reduce the operational cost, calibration and warm-up period has been the subject of concern.
This paper reports a silica gel based on a low-cost glucose detection system in discarded pen refills. Silica serves as a well-established dispersing material for proteins because it is non-toxic, chemically and biologically inert, subject to negligible hydration swelling, hydrophilic, and inexpensive to synthesize (Nassif et al., 2003; Chiriac et al., 2010).In the present work, a low cost colorimetric microfluidic device for detection of glucose was developed. Capillary force has driven microfluidic system was developed by using discarded pen refills of 2.66 mm width and 4 cm height. Pen refills are generally made up polypropylene polymer. Polypropylene is inert and is insoluble in most of the organic solvent, hence is suitable for the present work. Refill was packed with three layers of polymer. Bottom of the refill was filled with polyvinyl chloride (PVC) 20 mg to prevent the leakage of fluid from the refill. The strong and linear nature of the polymer prevents the dispersion of the liquid from the loaded refill. Second layer i.e the layer above PVC layer was filled with 5mgof treated silica gel i.e silica gel immobilized with Horseradish peroxidase (HRP), Glucose Oxidase (GOD) and o- dianisidine (dye), henceforth named as treated silica. Whereas, third and the topmost layer was filled with pure silica gel. In the present study, pure silica gel was used to separate the serum from the blood within a short period of time. Whereas treated silica was used for detecting glucose in the blood. Glucose oxidase oxidizes glucose into D- glucono -1,5 lactone with the formation of hydrogen peroxide. Horseradish peroxidase enzyme further breaks hydrogen peroxide to water and oxygen. Oxygen then reacted with an oxygen acceptor dye (OPD) which itself converted to a coloured compound, the amount of which can be measured colorimetrically.
To check the workability of the device, glucose was detected in the blood samples. Four microliters of freshly drawn human blood was carefully dropped at the inlet of the microfluidic device. Without applying any external power, blood moves through the silica packed region by capillary force. The movement of blood cells was impeded by small pores between the packed-beads. The hydrophilic surface of the packed beads induced the capillary flow of serum. After dropping 4μl of whole human blood, the serum separation started within 30 seconds and serum was successfully separated within 2 minutes by the silica gel. The separated serum then came in contact with the treated silica beads and the colour of the treated silica beads changed from white to orange when in contact with glucose in serum (Fig. 1).
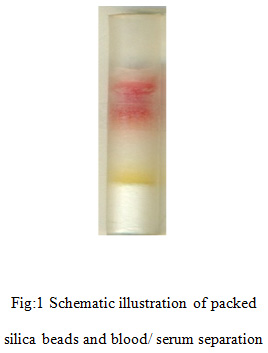 |
Figure 1: Schematic illustration of packed silica beads and blood/ serum separation |
Determination of the glucose in the blood was carried out on a desktop scanner (HP photo smart C6388) by placing the tube in the scanner to get the image. From Adobe Photoshop the mean value of each R, G and B of the scanned image was obtained which was then converted to HSB (Hue, Saturation, and Brightness) using freely available “Macbeth colour calculator” software. The image was then quantified as the saturation percentage. We have termed “saturation” as “colour-saturation” to make it clear as well as to differentiate it from a conventional chemical understanding of saturation (Parween and Nahar, 2013).
MATERIALS AND METHODS
Horse radish peroxidase (HRP) was purchased from Sigma (USA). Glucose Oxidase (GOD) was purchased from Boehringer Mannheim GmbH, Silica was purchased from Sisco Research Laboratories Pvt. Ltd., D- Glucose, o-dianisidine (dye) and polyvinyl chloride (PVC) were of analytical grade and purchased either from SRL, Glaxo or Merck (India). All buffer solutions were freshly prepared in triple distilled water before use.
Phosphate Buffered Saline (PBS) was prepared by mixing 0.85 % NaCl to 0.01 M phosphate buffer (pH 7.2). A 1.5mg/ ml stock solution of enzyme HRP and GOD was prepared in PBS and stored in the refrigerator for further use. Citrate-buffer (pH 5) was prepared by mixing 0.025 M citric acid and 0.05 M di-sodium-hydrogen phosphate in 100 ml distilled water. o-dianisidine (dye) was prepared in Citrate buffer and Glucose solution was prepared in distilled water.Human blood was obtained from a healthy volunteer as well as from diabetic one and Blood sugar was checked with a Blood Glucose meter (ACCU-CHEK).
Microfluidic device fabrication
The microfluidic device was made from discarded pen refill. Gravity-driven microfluidic system was developed by using discarded pen refills having 2.66 mm width and 4 cm height. Refill was washed with acetone to remove the ink remaining in the refill and dried. Bottom of the refill was sealed with parafilm at the end to prevent the leakage of the liquid. A 20 mg of PVC was filled at the bottom of the refill to prevent the diffusion of colour. Above the PVC layer,10 mg dried treated silica was loaded and subsequently, 40 mg of pure silica was loaded onto the treated silica. Refills were then ready for glucose estimation.
Optimization of the amount of Glucose Oxidase (GOD) for immobilization onto the pure silica gel to get treated silica gel
Petri plate containing 50 mg pure silica gel was taken and mixed with HRP (20 µg/ 50 µl PBS)and dye (400 µg/50 µl buffer). This mixture was divided into 4 parts each having 10 mg of the mixture. Four parts of the prepared mixture were taken and varying amounts of GOD corresponding to 5, 6, 7 and 8 µg/10 µl PBS was added respectively to get treated silica. Treated silica gels were then kept for drying in the dark.Four clean refills were taken and one end of each refill was closed with parafilm. PVC (20 mg/refill) was then filled in the refill as a bottom layer of the device. Then, 10 mg of treated silica containing varying amounts of GOD was loaded into the refill separately. Subsequently, 40 mg of pure silica was loaded onto the treated silica to get four separate refills containing varying amount of HRP loaded refill.
To get the optimum amount of GOD, 4 µl of glucose solution (200 mg/dl) was poured into each refill and subsequently PBS (76 µl) was poured into each refill (Fig. 2a).
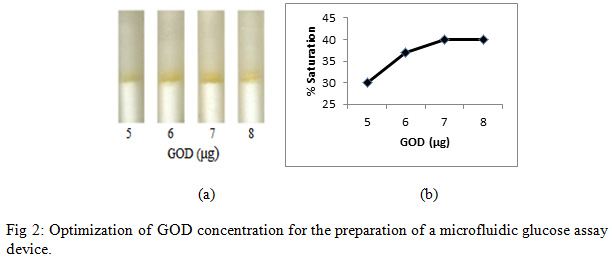 |
Figure 2: Optimization of GOD concentration for the preparation of a microfluidic glucose assay device |
After 8 minutes, the refills were scanned on a desktop scanner (HP photo smart C6388) to get an image. From Adobe Photoshop, the mean value of R, G and B of the scanned image was obtained which was then converted to HSB (Hue, Saturation, and Brightness) using freely available “Macbeth colour calculator” software. The image was then quantified as the saturation percentage.
Optimization of the amount of HRP for immobilization onto treated silica gel from pure silica gel
Petri plate containing 50 mg pure silica gel was taken and mixed with GOD (35 µg/50 µl) and dye (400 µg/50 µl). This mixture was divided into 4 parts each having 10 mg of the prepared mixture. Four parts were taken and varying amounts of HRP corresponding to 2, 3, 4 and 5 µg/ 10 µl PBS buffer was added separately and respectively. These mixtures were then kept for drying in dark.Four clean refills were taken and one end of each refill was closed with parafilm. PVC (20 mg/refill) was then filled in the bottom layer of the refill. 10 mg of treated silica with varying amount of HRP was loaded into the refill separately. Subsequently, 40 mg of pure silica was loaded onto the silica mixture to get four separate fully loaded refill of varying HRP concentration.
To get the optimum amount of HRP, 4 µl of glucose solution (200 mg/dl) was poured to each refill and subsequently PBS (76 µl) was poured into each refill (Fig. 3a).
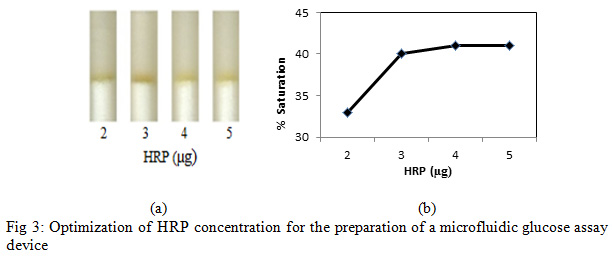 |
Figure 3: Optimization of HRP concentration for the preparation of a microfluidic glucose assay device |
After 8 minutes, the refills were scanned on a desktop scanner (HP photo smart C6388) to get the image and saturation percentage was calculated as described above.
Optimization of the amount of o-phenyledenediamine (dye) for immobilization onto silica gel
Petri plate containing 50 mg pure silica gel was taken and mixed with GOD (35 µg/50µl) and HRP (20 µg/50 µl). This mixture was divided into 4 parts each having 10 mg of the prepared mixture. Four parts were taken and varying amounts of dye corresponding to 40, 60, 80 and 100 µg/10 µl citrate buffer was added. Four Petri plates containing mixtures were then kept for drying in dark.Four clean refills were taken and one end of each refill was closed with parafilm. PVC (20 mg/refill) was then filled in the bottom layer of the refill (device). 10 mg of dried treated silica with varying amount of dye was loaded into each refill respectively. Subsequently, 40 mg of pure silica was loaded onto the silica mixture to get a fully loaded refill.
For detection, 4 µl of glucose solution (200 mg/dl) was poured into each refill and subsequently PBS (76 µl) was poured into each refill (Fig. 4a).
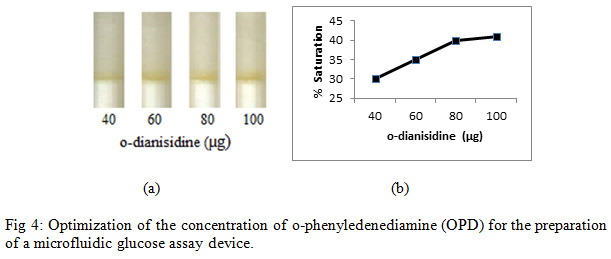 |
Figure 4: Optimization of the concentration of o-phenyledenediamine (OPD) for the preparation of a microfluidic glucose assay device |
After 8 minutes, the refills were scanned on a desktop scanner (HP photo smart C6388) to get the image and saturation percentage was calculated as described above.
Determination of glucose in a synthetic sample
Treated silica was prepared by adding HRP (40 µg/100 µl), GOD (70 µg/100 µl) and dye (800 µg/100 µl) with 100 mg of pure silica gel. Treated silica was filled into the different tubes as described in earlier sections.Four µl of varying concentration of D-glucose (50, 80, 100,150, 200, 250, 300 and 400 mg/dl) was added to each refill and subsequently, PBS (76 µl) was poured into each refill (Fig. 5a).
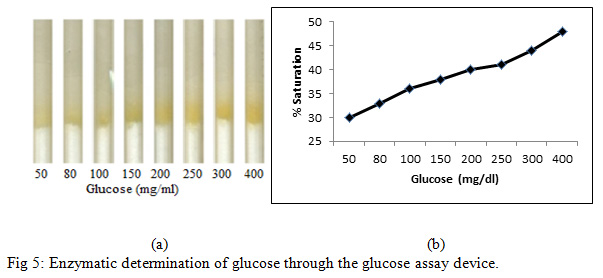 |
Figure 5: Enzymatic determination of glucose through the glucose assay device |
After 8 minutes, the refills were scanned on a desktop scanner (HP photo smart C6388) to get the image and saturation percentage was calculated as described above.
Determination of Glucose in blood samples with added synthetic glucose.
Treated silica was prepared by adding HRP (40 µg/100 µl), GOD (70 µg/100 µl) and dye (800 µg/100 µl) with 100 mg of pure silica gel. Treated silica was filled into different tubes as described in earlier sections.Fresh blood sample from a fasting individual was taken and glucose level was measured in a blood sample with a digital glucose meter which was found to be 80 mg/dl. Varying concentrations of synthetic glucose (0, 20, 70, 120, 170, 220, and 320 mg/dl) was added in 4 µl of blood sample to get seven samples of varying concentration containing 80, 100, 150, 200, 250, 300, 400 mg/dl glucose respectively. For detection, to each refill, 4 µl of prepared samples were poured and subsequently, PBS (76 µl) was poured into each refill (Fig. 6a).
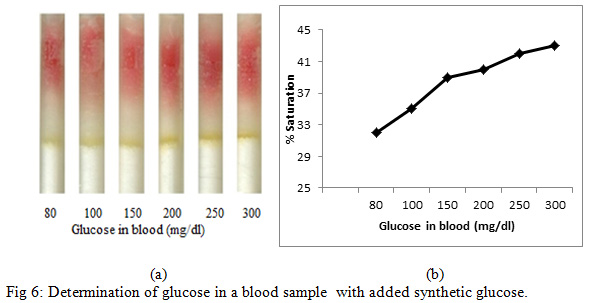 |
Figure 6: Determination of glucose in a blood sample with added synthetic glucose |
After 8 minutes, the refills were scanned on a desktop scanner (HP photo smart C6388) to get the image and saturation percentage was calculated as described above.
Determination of Glucose in blood samples without adding synthetic glucose
Treated silica was prepared by adding HRP (40 µg/100 µl), GOD (70 µg/100 µl) and dye (800 µg/100 µl) with 100 mg of pure silica gel. Treated silica was filled into different tubes as described in earlier sections.Four µl of a blood sample from three individuals, (i) from fasting individual (ii) from non- fasting individual (iii) from a diabetic individual, was poured into each refill respectively for detection and PBS (76 µl) was subsequently poured into the refills (Fig. 7a).
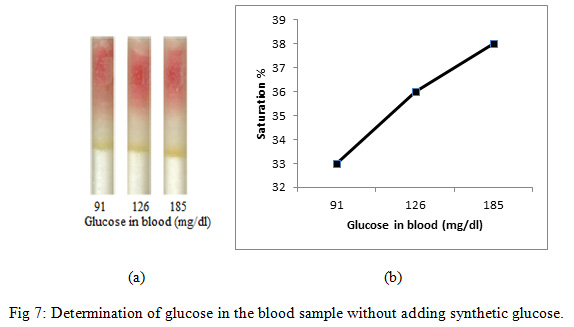 |
Figure 7: Determination of glucose in the blood sample without adding synthetic glucose |
After 8 minutes, the refills were scanned on a desktop scanner (HP photo smart C6388) to get the image and saturation percentage was calculated as described above.
Determination of R.G.B. values
The colour formed after the reaction was scanned with a desktop scanner. The scanned image was opened in Adobe Photoshop Version 7.0. The area of colour was selected using a rectangular marquee. After the region was selected, the median of R.G.B. values for each refill was noted.
Determination of Saturation
Saturation of each reading was calculated by Macbeth calculator. This is used for calculating hue, saturation and brightness. Saturation was calculated by providing R.G.B. values calculated from Adobe Photoshop. Saturation was noted down for each refill.
Preparation of graphs based on concentration and saturation values
Graphs were prepared by plotting saturation percentage depending on the colour obtained against their concentrations as shown in Figs. 2b, 3b, 4b, 5b, 6b and 7b.
RESULTS AND DISCUSSION
The most common way to check glucose levels involves pricking a fingertip with an automatic lancing device to obtain a blood sample and then using glucose strips of glucose meter to measure the blood sample’s glucose level. Glucose test strips of glucose meter are expensive due to expensive enzymes, precious metals, chemicals, and other materials that makeup test strips.We proposed gravitational force driven and capillary action based low-cost microfluidic device for assaying blood glucose. The proposed microfluidic device was made out of discarded pen refills of 2.66 mm width and 4 cm height. Pen refills are generally made up polypropylene polymer which is inert in nature and is insoluble in most of the organic solvent. Pen refills filled with the polymer viz. silica, was utilized as a multipurpose polymer i.e. it was used for separating sera from blood as well as used for detecting glucose when GOD was immobilized onto it.
Silica serves as a well-established dispersing material for proteins because it is non-toxic, chemically and biologically inert, subject to negligible hydration swelling, hydrophilic, and inexpensive. In the present study, pure silica gel was used to separate the serum from the blood within a short period of time [14]. Whereas treated silica i.e silica gel immobilized with GOD, HRP and dye was used for detecting glucose in the blood. Glucose oxidase oxidized glucose into D- glucono -1,5 lactone with the formation of hydrogen peroxide. Horseradish peroxidase enzyme further broke hydrogen peroxide to water and oxygen. Oxygen then reacted with an oxygen acceptor dye (OPD) which itself was converted to a coloured compound, the amount of which can be measured colorimetrically.
Figure 1 shows the Schematic illustrations of packed silica beads and blood/serum separation. Without applying any external power, blood moved through the silica packed region by capillary force and serum separation started within 30 seconds and successful serum separation took place within 2 min of loading.
Enzymatic determination of Glucose onto the treated silica gel was carried out and was noted that the treated silica gel (silica immobilized with GOD, HRP and dye) could detect the glucose concentration successfully. In order to obtain an optimum amount of HRP, GOD and dye and to get best treated silica gel, three separate experiments were carried out. As shown in Figure 2, an optimum amount of GOD required to prepare treated silica gel was0. 7 µg per 50 mg silica gel, whereas the optimum amount of HRP required iswas0.4 µg per 50 mg silica (Figure 3). O-dianisidine (dye) required to act appropriately with the optimum amount of HRP and GOD was found to be 80 µg per 50 mg silica (Figure 4).
Figure 5 shows the enzymatic determination of glucose onto the treated silica gel (silica immobilized with GOD, HRP and dye). Standard plot was made using varying glucose concentration. It is noted from Figure 5 that the percentage (%)saturation increases with an increase in glucose concentration.Determination of Glucose in the blood sample with added synthetic D-glucose was further carried out. In this experiment, blood sample was taken from fasting individual and glucose level was checked with a digital glucose meter. The blood glucose level in the fasting individual was found to be 55 mg/dl. Four microliter of blood sample was taken from the same fasting individual (with glucose level 55 mg/dl) in seven different eppendorf and varying glucose concentration of 25, 45, 95, 145, 195, 245 and 345 mg/dl was added in the blood sample to get seven sample of varying concentration of 80, 100, 150, 200, 250, 300, 400 mg/dl respectively. These prepared samples were then poured in the loaded pen refills and % saturation was determined (Fig. 6).
On comparing the % saturation of Figure 5 (wherein the % saturation of only synthetic glucose is demonstrated and standard glucose plot is made) with that of Figure 6, it is very clear that the amount of sugar can be calculated using Figure 4, since the results are comparable.Further, we also detected the blood glucose level in three individual, where we did not add any synthetic sugar in human blood (Fig. 7). In this case we took a blood sample from (i) fasting individual (ii) non- fasting individual (iii) the diabetic individual. It is very clear from Figure 7 that the detection of the sugar can be carried out with the help of a glucose standard plot (Figure 5), since the results are comparable.
CONCLUSION
A simple, rapid and economical microfluidic device for assaying blood glucose level was developed. The developed glucose detection system is far simpler and cheaper than the systems/machine available in the market. With minor modifications in the treated silica region, the device can be used in other areas of diagnostics also.
ACKNOWLEDGEMENTS
Azmi Naqvi thanks the University Grant Commission, Government of India for the award of a “Post Doctoral Fellowship” for Women and Department of Science and Technology for the award of Woment Scientist award.
REFERENCES
Araci, I.E., Quake, S. R., 2012. Microfluidic very large scale integration (mVLSI) with integrated micromechanical valve. Lab. Chip, 2803-2806.
Bode, B., Silver, M. Weiss, R. and Martin, K., 2008. Evaluation of a continuous glucose monitoring system for home-use conditions. Manag. Care, 17, 40–45.
Chiriac, P.N, Nita, I, Nistor, L. and Sol, M., 2010. Gel Method Performed for Biomedical Products Implementation. Mini Rev. in Medicinal Chem. 10:990–1013.
Derek, Y., David, S. and Kelly, D. B., 2006. Epidemiologic and economic consequences of the global epidemics of obesity and diabetes. Nature Medicine, 12, 62 – 66.
Huh, D., Bahng, J.H., Ling, Y., Wei, H., Kripfgans, O. D., Fowlkes, J. B., Grotberg, J. B., and Takayama, S., 2007. A Gravity-Driven Microfluidic Particle Sorting Device with Hydrodynamic Separation Amplification. Anal. Chem., 79(4), 1369–1376.
Nassif, N, Coiffier,A, Coradin, T, Roux, C, Livage, J. and Bouvet, O., 2003. Viability of Bacteria in Hybrid Aqueous Silica Gels. J. of Sol-Gel Sci. and Technol. 26:1141–1144 .
Parween S. and Nahar, P., 2013 Image-based ELISA on an activated polypropylene micro test plate—A spectrophotometer-free low-cost assay technique, Biosensors and Bioelectronics, 48,287–292.
Rhee, S.W., Taylor, A. M., Cribbs, D. H., Cotman, C.W. and Jeon, N. L., 2007. External force-assisted cell positioning inside microfluidic devices. Biomed Microdevices, 9(1):15-23.
Sackmann, E.K., Fulton, A. L. and Bebee, D.J., 2014. The present and future role of microfluidics in biomedical research, Nature, 507, 181–189.
Yao, B., Yao, Lao, G.A., Feng, X., Wang W., Chen, L.X., Wang, Y.M. and Yao, Y. M., 2004. A microfluidic device based on gravity and the electric force driving for flow cytometry and fluorescence activated cell sorting, Lab Chip, 4(6), 603-7.

