1, 3, 4. Water Technology Center, Prof. Jayashankar Telangana Agriculture University,Rajendranagar, Hyderabad-30.
2M S Swaminathan School of Agriculture, Paralakhemundi, Centurion University of Technology and Management
(CUTM) Gajapati – 761211, Odisha.
5College of Agricultural Engineering, Acharya N.G.Ranga Agricultural University, Bapatla, Andhra Pradesh
6Programme Planning and Evaluation Group (PPEG), NRSC, Hyderabad.
Article Publishing History
Received: 10/05/2020
Accepted After Revision: 19/06/2020
An Investigation on irrigation performance assessment of Janpad major, Left bank canal, Nagarjuna Sagar Project (NSP), Andhra Pradesh, India using remote sensing and GIS was conducted during rabi (2008-09) at Water Technology Center, ANGRAU, Rajendranagar, Hyderabad. Multi temporal remote sensing (RS) data-based crop inventory and generation of NDVI was carried out over the Janpad major command of NSP, using Indian Remote Sensing Satellite (IRS-P6) and Linear Imaging and Self Scanning –III (LISS-III) data. In this study, six comparative indicators for the assessment of irrigation system performance were applied to Janpad major command area, during rabi season (2008-09). The irrigation intensity (%), out put per cropped area (t/ha), out put per unit cultivable command (t/ha), water utilization index (ha/M.m3), water productivity (kg/m3) were computed. Overall consumption rate (Efficiency) was computed by comparing the crop water requirement with the water release data. Irrigation intensity, output per unit cropped area and out put per unit cultivable command was 96 %, 4.44 t ha-1 and 4.27 t ha-1 respectively for the Janpad major command. Water utilization index, overall consumption rate (Efficiency) and Water productivity was found as 124 ha/M.m3, 67.7 per cent and 0.64 kg m-3, respectively Above set of performance indicators describes the performance of an irrigation project for decision making. With satellite remote sensing and calculating actual ET of the crop and overall consumption rate (OCR) helps the policy makers in irrigation water supply as per crop. By knowing the supply and demand of irrigation water of a project is necessary for better irrigation efficiencies and improving the water productivity of irrigation project.
Satellite data, irrigation intensity, water utilization index, water productivity.
ddy CH. K, Reddy M. D, Neelima T. L, Kumar K. A, Mani A, Ramana K. V. Irrigation Performance Assessment of Janpad Major of Nagarjuna Sagar Project Using Remote Sensing and GIS. Biosc.Biotech.Res.Comm. 2020;13(2).
Reddy CH. K, Reddy M. D, Neelima T. L, Kumar K. A, Mani A, Ramana K. V. Irrigation Performance Assessment of Janpad Major of Nagarjuna Sagar Project Using Remote Sensing and GIS. Biosc.Biotech.Res.Comm. 2020;13(2). Available from: https://bit.ly/2Nzemqc
Copyright © Reddy et al., This is an open access article distributed under the terms of the Creative Commons Attribution License (CC-BY) https://creativecommns.org/licenses/by/4.0/, which permits unrestricted use distribution and reproduction in any medium, provide the original author and source are credited.
INTRODUCTION
India is amongst the largest irrigator countries in the world. In most of the existing irrigation schemes there is a serious lack of reliable and adequate information on system performance. Periodical assessment of irrigation project is needed to find out irrigation potential utilized vis-à-vis the potential created. System performance monitoring, evaluation, and diagnostic analysis are keys for the improvement of irrigation projects. A set of performance indicators describes the system performance of irrigation schemes in different dimensions for the benefit of decision-makers. The temporal and spatial variations of such indicators will help in improving the system performance.
Remote sensing provides an opportunity to measure the crop yield without field measurements and this opens the possibility to study the variability of water productivity within an irrigation system. Neelima et al.,2015 and Kumar et al. 2015 assessed the irrigation performance of Jurala irrigation project and Nagarjuna Sagar Project in 2008-10 using LISS III and AWiFS data using RS based crop inventory and NDVI values. Ayat Elnmer et al. (2018) assessed the irrigation performance of the Nile Delta using remote sensing using indicators like adequacy index (AI), equity index (EI) and Dependability (PI), Water productivity (WP), water depleted fraction (DF), relative evapotranspiration (RET) with LANDSAT ETM+ ETM+ images and SEBAL approach.
Remote sensing is now playing a major role in acreage estimation and to forecast crop yields primarily based upon statistical– empirical relationships between yield and vegetation indices (Thenkabail et al., 2002, Casa and Jones, 2005). . Wheat acreage estimation for Karnal district using the LISS – III satellite data (Urmil Verma and Haryana, 2011), Boro rice in Nagaon district of Assam (Raihan Ahmed and Haroon Sajjad, 2015), and yield of soybeans crop in some districts of M.P (Abhishek Kumar Maurya, 2016) and area, production and productivity of potato for 5 major potato growing states of India i.e. Bihar, Gujarat, Punjab, Uttar Pradesh and West Bengal was done using RS and GIS, (Kumar 2019).
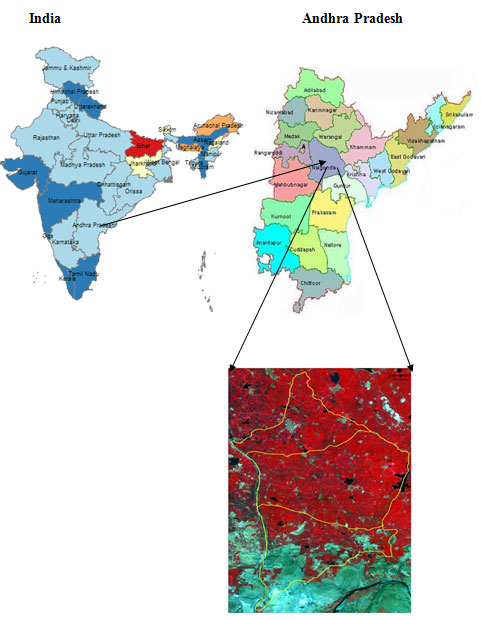
The Area under Janapad major located at 90.5 km (160 56′ 12.8″ E& 790 42′ 0.7″ N) on Left Bank canal of Nagarjunasagar project with the length of 24 km and designed discharge of 555.13 cusecs was selected for the study of. The ayacut area spreads in Nereducherla, Garidepally and part of Mattampally mandals of the Nalgonda district (Fig 1). It has a total geographical area of 13216 ha with 11 Water Users Associations. It is located in Southern Telangana Agro-Climatic Zone of Andhra Pradesh. It comes under Agro-Eco region 7-Hot Semi-arid eco region with red and black soils (K6 D2) (NBSS&LUP, 1992). By using IRS P6 WiFS (Wide Field Sensor) and IRS-1C WiFS and LISS3 which have a good periodicity, it is possible to construct growth profiles and retrieve yield related parameters at region level (Menon, 2012). Satellite remote sensing and Geographic Information System (GIS) offer great promise for natural resources management (Shanmugapriya et al., 2019).
Figure 1. Location map of Janpad command area, Nagarjuna Sagar left canal, Andhra Pradesh.
Irrigation performance assessment is the systematic spatial and temporal evaluation of irrigation systems to diagnose problems and is considered as the most critical element for improving irrigation management (Abernethy and Pearce, 1987).Irrigation performance assessment was carried out for various projects in India. The irrigation performance assessment of Jurala (Neelima et al., 2013 ) and Krishna Western Delta in Andhra Pradesh was carried by using satellite data indicated that there was reduction in the total cropped area by 17,383 ha in 2005-06 compared to 1998-99 (Prasad et al., 2006). However, such information is not available intensively at irrigation major of Nagarjuna Sagar multipurpose irrigation project. Hence, the research project on irrigation performance assessment of Janpad major left bank canal, Nagarjuna Sagar Project using Remote Sensing and GIS was taken up to assess the irrigation potential utilized vis-à-vis the potential created, agricultural production and productivity achieved and how efficiently the irrigation being managed.
MATERIAL AND METHODS
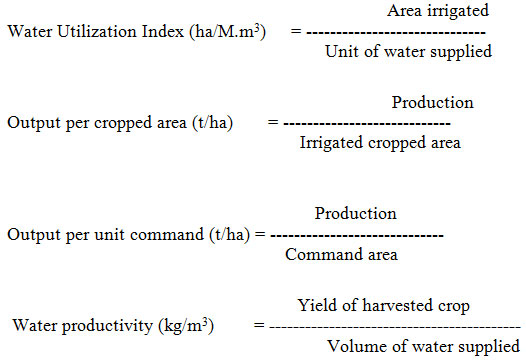
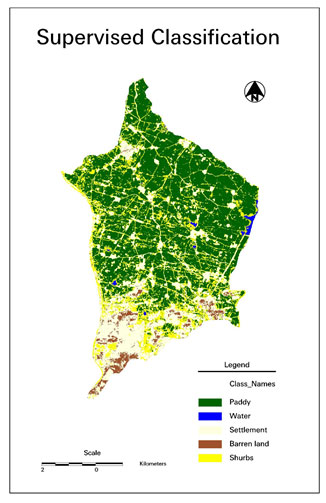
The performance indicators are computed for the Janpad major command area. The main output considered is crop production and the major inputs are water and land. Six basic comparative performance indicators namely irrigation intensity, overall consumption rate, water utilization index, output per unit cropped area, output per unit command area, and water productivity were computed. Computation of these indicators require data on cropped area, command area, potential evapotranspiration, water diverted by the canal, rainfall and production. The multispectral data from LISS-III sensor of IRS –P6 (Resourcesat-1) were acquired on 21-2-09, 17-3-09 and 10-4-09 and geo-coded false colour composites (FCC) were utilized for delineation of major crops grown in the study area. The Supervised classification for the images taken on Feb, Mar and April 2009 was done. The training windows were defined for various crops and other land use classes based on the ground truth information. Multiple training sites for each class were identified in order to represent the variability with in the same class.
The image was classified using maximum likelihood algorithm. Rice mask map was generated based on classified image. The pixels thus generated were multiplied with 24 m x 24 m to estimate paddy area. Crop cutting experiments were conducted (5 m × 2 m) randomly at selected points in the command area and the corresponding GPS reading were taken. Paddy grain weight at 14 per cent moisture was taken for developing yield model. Normalized Difference Vegetation Index (NDVI) proposed by Rouse et al., (1974) was used in this study. This index is very sensitive to the presence of green vegetation. It permits the prediction of agricultural crops in semi arid areas.
NDVI can be defined by following equation
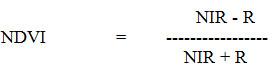
NIR and R are the reflectance in the near infra red and red regions, respectively.
The red and infra red channel data pertaining to the IRS P6 LISS III image were transformed in to NDVI image in ERDAS IMAGINE Modeler panel by running the NDVI model. The resultant NDVI image of the paddy crop was used for yield estimation. Maximum NDVI image derived using 2008-09 rabi season satellite data was used to establish the relationship between NDVI and paddy yield observed at CCE plots through the development of regression model.
Data on command area and water diverted were collected from Divisional executive engineer, Left bank canal, Nagarjunasagar project, Miryalguda, Nalgonda district, A.P., India. For computation of PET and water requirement, the weather data of ARI Rajendranagar was considered. Potential Evapotranspiration was computed using the Penman-Monteith method of CROPWAT computer model. These indicators were calculated as shown below:
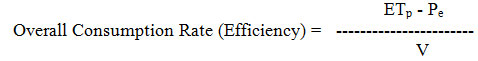
ETp is the potential evapotranspiration (m3) Pe is the effective rainfall (m3)
V is the total volume of water supplied to the command area (m3)
RESULTS AND DISCUSSION
Initial observations from field visits indicate that paddy constitute more than 96 per cent of the total cropped area. Other crops grown in the command area are chilies, cotton and citrus. The satellite derived crop estimates in Janpad major in NSP left canal command indicate that paddy occupies 11,750 ha while water bodies, settlements, barren lands and shrubs occupy 9630.6 ha (Table 1). The area under other crops is negligible and this area was considered under shrubs. The paddy area is more in middle reach followed by head and tail end. Paddy is the major crop in Janpad major command area, left bank canal, Nagarjuna sagar. Out of 4493.5 ha of head region of the command area, 3179 ha is paddy. Compared to paddy area, other crops are negligible. The water bodies, settlement, barren land and shrubs occupied 3.7, 508.5, 11.3 and 791.0 ha respectively.In middle reach out of 10255.1 ha, the paddy crop occupied 7460.90 ha. The water bodies, settlement, barren land and shrubs occupied 92.0, 1221.2, 2.9, and 1892.0 ha respectively.
Table 1. Satellite derived crop area (ha) in head, middle and tail reaches of Janpad major, NSP left canal during rabi 2008-09
| Crop | Head | Middle | Tail | Janpad Major command |
| Paddy | 3179.0 | 7046.9 | 1525.0 | 11750.9 |
| Water body | 3.7 | 92.0 | 17.2 | 113.0 |
| Settlement | 508.5 | 1221.2 | 2988.2 | 4718.0 |
| Barren land | 11.3 | 2.9 | 568.6 | 583.9 |
| Shrubs | 791.0 | 1892.0 | 1532.8 | 4215.9 |
| Total | 4493.5 | 10255.1 | 6631.9 | 21381.5 |
In tail end area, out of 6631.9 ha, the paddy occupied 1525.0 ha while considerable area was occupied by settlement (2988 ha), followed by shrubs. The water bodies occupied considerably less area. Neelima et al., (2014) estimated the irrigated area under Jurala Project command area and found that there was an increase in the paddy area from 70.7 to 72.4% and from 76.3 to 83.5% in the right main canal and left main canal respectively. Ahmed and Sajjad, (2015) estimated the crop acreage of Boro rice using NDVI, RVI and supervised classification in Nagaon district of Assam in single date Landsat 5 TM digital data coinciding with maximum crop growth (March, 2009) has been used for identification and estimation of crop acreage. Maurya, (2016) estimated the acreage and yield of soybeans crop in some districts of M.P. in the Kharif season 2007. NDVI was performed on all the October images (2007, 2006, 2005) using hybrid classification techniques.
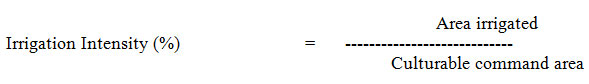
Irrigation intensity was estimated based on the satellite derived crop estimates as percent of the total culturable command area (CCA) i.e., ayacut in the command. The irrigation intensity of the head, middle and tail reach was observed to be 97, 97 and 90 % respectively (Table 2). On the other hand the irrigation intensity was only 96 % in Janpad major during rabi 2008-09. Further, in tail reach, decrease in irrigation intensity (90 %) was observed, this may be due to large area in the tail reach was under shrubs and rocky land. Prasad et al., (2006) has reported the irrigation intensity of 83 per cent under NIZ east canal command of Krishna western delta. Kumar, et al.., (2014) reported that the irrigation intensity varied from 92.39 to 123.19 for against target of 100 per cent in Nagarjuna sagar left canal command area during rabi 2008-09 and 2009-10, respectively.
Table 2. Irrigation intensity (%) at Head, middle and tail reach and entire Janpad major of NSP left canal during rabi 2008-09.
| Head | Middle | Tail | Janpad major command |
| 97 | 97 | 90 | 96 |
Overall Consumption Rate was derived by dividing water requirement estimated using Potential Evapotranspiration (ETp) minus Pe (effective rain fall) by volume of water applied to the Janpad command area. The water requirement was derived through CROPWAT model. The PET for paddy was 544.1 mm and for shrubs is 325 mm. The effective rainfall was 9.9 mm. The gross water requirement for paddy was observed to be 1584.4 mm.The Overall Consumed Rate (efficiency) estimated was 0.67 (Table 3). This is the Overall Consumed Rate (efficiency) which was derived without considering the conveyance and application losses. The higher OCR values in the selected distributary implies that insufficient water was supplied to that particular distributary. The OCR values in the Jural project command area ranged from 0.06 to 0.15and 0.02 to 0.12 during rainy season 2009 and 2010 respectively and thus there was no shortage of water supply to the command area (Neelima et al., 2015) and for Janpad and Mudimanikyam majors in Nagarjunasagar left canal area during 2010 was 0.52 and 0.40 (Kumar et al., 2014).
Table 3. Water Utilization Index, Overall Consumption Rate and Water Productivity of Janpad command area.
| Indicators | Janpad major command area |
| Water Utilization Index (ha/M m3) | 124 |
| Overall Consumption Rate | 0.67 |
| Water Productivity (kg/m3) | 0.647 |
Water Utilization Index (WUI) defined as area irrigated per unit volume is a measure of water delivery performance and constitutes one of the important spatial performance indicators of an irrigation system. WUI also forms basis for evaluating the adequacy of seasonal irrigation supplies in an irrigation system (Table 3). It is estimated based on the equivalent wet area and amount of water released in to the various irrigation units. The paddy irrigated area was 11750.9 ha and the water delivered to the major was 94.752 M.m3. The water utilization index was 124 ha/M.m3 or 3512 ha per one TMC which is less than the normal expected irrigation of 4000 ha of paddy irrigation (wetland) per TMC. Neelima et al. (2014) reported that in Jurala project command area in Telangana during 2009-10, area irrigated was much less per unit of canal irrigation water supplied (68.8 ha irrigated million m-3 water supplied) for the left main canal, compared to right main canal when better utilization of canal irrigation water was achieved (80.2 ha irrigated million m-3 water supplied).
Figure 2. Supervised classification image of Janpad major, NSP left canal, India of Feb21, Mar17 and Apri10, 2009
In Janpad major of NSP left canal command during rabi the paddy yields were highly variable at different sites obtained through crop cut experiments (CCE) and the yields ranged from 4.30 to 9.25 t/ha. Maximum NDVI image derived using Feb 21, 2009 satellite image was used to establish the relationship between NDVI and paddy yield observed at CCE plots through the development of linear regression model (Fig. 3). Yield prediction model Y= 8.5076(NDVI) + 2.8125 Y = Estimated yield (t ha-1) NDVI: NDVI of paddy crop.
Figure 3: Paddy yield model developed for Janpad major command area, NSP, India
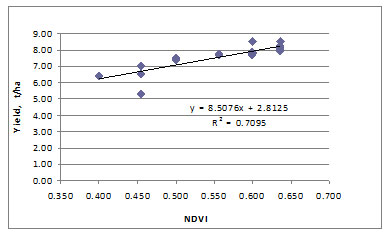
The yield prediction model was found to be significant R2 = 0.7095, which explain 71 % of the variability in yield estimation which is reasonable for crop yield estimation studies. The Paddy yield model generated for Janpad major of NSP left canal command for rabi 2008-09 was applied to generate paddy yield map. Using the model, the average yield of paddy in Janpad command was estimated to be 4.44 t/ha. The total production of paddy in Janpad major command was calculated by using the relationship Production= area (ha) × yield (t/ha). The estimated production of paddy in Janpad major was 52,174 tons.
The out put per cropped area for Janpad command area was computed by dividing the total production obtained by multiplying satellite derived yield (4.4 t/ha) with paddy area (11750.9 ha). The area under other crops (4 %) which are included in shrubs were not considered because it was scattered and negligible. The overall production of Janpad major was found to be 51704 tons. The out -put per culturable command area for Janpad command was computed by dividing the total production obtained by multiplying satellite derived yield (4.44 t/ha) with paddy area (11750.9 ha) of the command. The culturable command area is 12194 ha. The output per culturable command area for Janpad major was 4.27 t/ha. Similar result was observed by Upadhyaya (2005) for Patna Main Canal Command. Productivity of water is one of the irrigation performance indicator used in irrigation performance assessment as it can establish the relation between the amount of water supplied to irrigation command and the production of paddy realized from the command. The water productivity observed in command area was 0.647 kg/m3. A similar trend was reported by Prasad et al., (2006) (0.7 kg/m3) for Krishna western delta during 2005-06.
Taghvaeian et al., (2018) reported that by using Remote Sensing and GIS Techniques for assessing Irrigation Performance indicators based on the magnitude and uniformity of ground water depth was found to be functioning at an optimal level. This suggests that a set of performance indicators like Supply Demand Ratio, Over all Consumption Rate (OCR) and Water Utilization Index (WUI) can describe performance of irrigation schemes in different dimensions for the benefit of decision-makers. . It is clear that the Janpad major supposed to irrigate more area, however it is falling short of 12 % of less area than expected. The estimated indicators provided information the performance of the Janpad major irrigation canal is under utilizing the irrigation water. Understanding the performance of irrigation by irrigation managers at farm levels has the potential to improve irrigation water use efficiently and contribute to more efficient use of water resources
CONCLUSIONS
A set of performance indicators describes the system performance of irrigation schemes in different dimensions for the benefit of decision-makers. Information generated on irrigation performance of the project can be used for improving better irrigation management. Further, such periodical studies are required for taking remedial measures which ultimately help in efficient management of the most important and scarce natural resource water in increasing the water productivity. Satellite measurements provide near real time data and can be revived and updated.
REFERENCES
Abernethy, C.L. and Pearce, G.R. (1987) Research needs in third world irrigation. Hydraulics Research Limited. Wallingford, U.K.
Casa, R. and Jones, H.G. (2005). LAI retrieval from multiangular image classification and inversion of a ray tracing model. Remote Sens Environ., 98: 414–428.
Kumar AK., Reddy, M.D., Uma Devi, M., Narender, N., Neelima, T.L., Ramulu, V., Praveen Rao, V. and Raghavaiah, R. (2014). Irrigation Performance Assessment of Left Bank Canal, Nagarjuna Sagar Project,India During Rabi Using Remote Sensing and GIS Agrotechnology, 3:1DOI: 10.4172/2168-9881.1000122
Kumar P.(2019). Analysis of remote sensing-based assessment of potato statistics and its comparison with government estimates, The International Archives of the Photogrammetry, Remote Sensing and Spatial Information Sciences, Volume XLII-3/W6
Maurya AK (2011). Estimation of Acreage & Crop Production through Remote Sensing & GIS Technique. Conference paper, geospatial world forum.
Menon, A.R.R. (2012). Remote sensing applications in agriculture and forestry. A paper from the proceedings of the Kerala environment congress, pp. 222-235.
National Bureau of Soil Survey and land Use Planning, (1992). Soils of Andhra Pradesh for optimizing land use. NBSS & LUP (ICAR), Nagpur.
Neelima, T. L., Ramana, K. V. and Reddy M. D. (2015) Book on Performance assessment of Jurala command area – RS and GIS. Lap Lambert Academic publishing. 100 p ISBN:978-3-659-33811-3.
Neelima, T. L., Ramana, K. V. and Reddy, M. D. (2013). Spatial and temporal rice yield variation in Jurala Irrigation Project using Remote Sensing and GIS Scholarly Journal of Agricultural Science Vol. 3(7), pp. 274-283.
Neelima, T. L., Ramana, K. V., Reddy, M. D, Uma Devi, M., Ramulu, V. and Ramanjaneyulu, A .V. (2014). Supply Demand Ratio and Water Utilization Index in Jurala Project Command Area, Andhra Pradesh, India. International Journal of Bio-resource and Stress Management 2014, 5(1):068-073.
Penman -Monteith method of CROPWAT computer model. FAO.
Prasad, P.R.K., Kalpana, D., and Satyanarayana, T.V. (2006). Irrigation performance assessment of Krishna western delta using remote sensing – A case study. Report of mission to ANGRAU Hyderabad and Bapatla, March 24 – April 4, 2006. Wageningen, Alterra, APWAM Technical report.
Raihan Ahmed and Haroon Sajjad. (2015) Crop acreage estimation of Boro Paddy using Remote Sensing and GIS Techniques: A Case from Nagaon district, Assam, India, Advances in Applied Agricultural Science Volume 03 (2015), Issue 03, 16-25.
Rouse, J.W., Hass, R.W., Schell, J. A., Deering, D.W., Harlan, J.C. (1974) Monitoring the vernal advancement and retrogradation of natural vegetation. NASA/GSFCT Type III final report, Greenbelt, MD, USA.
Saleh Taghvaeian, A.M., Christopher M.U., Neale, A.M., John C. Osterberg., Subramania I. Sritharan and Doyle R. Watts. (2018). Irrigation Performance: Case Study in Southern California. Journal of Irrigation and Drainage Engineering, © ASCE, ISSN 0733-9437. J. Irrig. Drain Eng., 2018, 144(6): 05018002Doi: https://doi.org/10.20546/ijcmas.2019.801.238
Shanmugapriya, P.S., Rathika, T., Ramesh and Janaki, P. (2019). Applications of Remote Sensing in Agriculture – A Review. International .Journal of Currernt Microbiology and Applied Sciences 8(01): 2270-2283.
Thenkabail, P.S., Smith, R.B. and De-Pauw, E. (2002). Evaluation of narrowband and broadband vegetation indices for determining optimal hyperspectral wavebands for agricultural crop characterization. Photogrammetric Engineering, 68: 607–621.
Upadhyaya, A., Sikka, A. K., Singh, A. K., Kumar, J., (2005) Performance evaluation of Patna main canal command. http:// obisv2.IWMI.org/guidelines/India.Bihar.
Verma V. (2011). Remote sensing-based wheat acreage and spectral-trendagrometeorological Yield Forecasting: Factor Analysis Approach, Statistics and Applications Volume 9, Nos. 1&2, 2011 (New Series), pp. 1-13.

