Kemerovo State University, Kemerovo, Russia
Article Publishing History
Received: 30/09/2021
Accepted After Revision: 25/12/2021
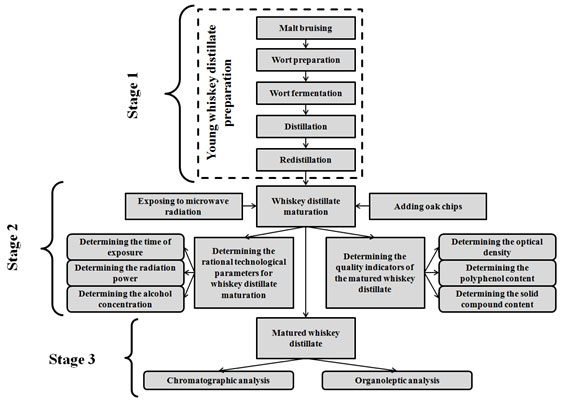
The paper aims to evaluate the quality indicators of the whiskey distillate during its maturation under the influence of microwave radiation based on the method of multiple regression analysis to determine the optimal technological parameters for its production. In the course of solving the problem of product import substitution, we tested the patented technology for producing strong alcoholic beverages at the stage of their aging, using oak chips with various degrees of heat treatment. One of the promising areas for intensifying the process of whiskey distillate maturation is applying “green technologies”, with microwave heating being one of them.
Positive results were obtained for the effect of microwave radiation on the process of target component extraction from oak chips with a water-alcohol solution. The duration of this extraction process was reduced by more than 2 times, which confirmed its intensity in relation to the classical method. The obtained regression models proved adequate, since the mean relative error varied within 10%. The chromatographic analysis of the whiskey produced at the optimal technological parameters showed that all physical and chemical properties and product safety meet the requirements of the applicable regulations and standards.
Extraction, Malt, Oak Chips, Physical And Chemical Properties, Rational Technological Modes.
Borodulin D. M, Prosin M. V, Shalev A. V, Golovacheva Y. S. Influence of Microwave Radiation on Whiskey Distillate Quality Indicators. Biosc.Biotech.Res.Comm. 2021;14(4).
Borodulin D. M, Prosin M. V, Shalev A. V, Golovacheva Y. S. Influence of Microwave Radiation on Whiskey Distillate Quality Indicators. Biosc.Biotech.Res.Comm. 2021;14(4). Available from: <a href=”https://bit.ly/3lcFtJa“>https://bit.ly/3lcFtJa</a>
Copyright © Borodulin et al., This is an open access article distributed under the terms of the Creative Commons Attribution License (CC-BY) https://creativecommns.org/licenses/by/4.0/, which permits unrestricted use distribution and reproduction in any medium, provide the original author and source are credited.
INTRODUCTION
The main raw materials for the production of whiskey and whiskey-based beverages are malted grain (barley, wheat, rye, corn); the other raw materials that affect the taste and aroma of whiskey – water and oak barrels where the aging process traditionally takes place – are equally important. In the classical production technology, the technological stage of whiskey distillates aging in oak barrels requires a certain amount of time. In addition, the barrels themselves require specific preparation, which makes both the barrels and the resulting product – whiskey – more expensive.
The analysis of Russian and foreign scientific literature published in the past ten years has shown that one of the promising areas for intensifying the process of whiskey distillate maturation is applying “green technologies”, which imply more eco-friendly production processes (concerning both the environment and the product itself) compared to the traditional technologies. The “green technologies” are implemented in the technological and innovative spheres to solve the issues of adapting alternative production processes to improve the technological chain as a whole (Dumitriu et al. 2019).
“Green technologies” include microwave heating (Cammarano et al. 2019). Studies of the extraction of polyphenol compounds using microwave heating and conventional solvent extraction showed that selective microwave heating can increase the yield and quality of the extracted polyphenols. It was found that at the same volume heating rate, there was no difference in the processing time and, consequently, in the theoretical energy requirements for the process (Galan et al. 2017; More and Gogate 2018; González-Centeno et al. 2019; Drevelegka and Goula 2020). The purpose of this paper is to evaluate the quality indicators of the whiskey distillate during its maturation under the influence of microwave radiation based on the method of multiple regression analysis to determine the optimal technological parameters for its production.
MATERIAL AND METHODS
The paper seeks to solve the following research tasks:
- A multiple regression analysis of the effect of any two independent variables (the time of whiskey distillate exposure to microwave radiation t; the power of microwave radiation N; alcohol concentration in the whiskey distillate C) on the dependent variables – the quality indicators of the obtained whiskey distillates (optical density (D), polyphenol content (PPh) and solid compound content (SC)) in the process of maturation under microwave radiation;
- A multiple regression analysis of the influence of all the independent variables (t), (N) and (C) on the dependent variables: (optical density (D), polyphenol content (PPh) and solid compound content (SC) in the whiskey distillate during its maturation under microwave radiation;
- A chromatographic analysis on the whisky obtained at the optimum process parameters;
- An organoleptic assessment of the quality of whiskey.
The research team studied the whiskey distillates samples meeting the standards of modern industrial and state standards. Heat-treated French oak chips of strong charring were selected as the solid phase. The chips had the same size of about 5×5×5 mm and did not contain bark particles. Alcohol concentration in the studied whiskey distillate samples was 45%, 60%, and 75 %. During the research, a number of measuring methods were used to evaluate the extract samples. Spectrophotometry was used to assess the optical density of the distillates, the Erumanis method was used to measure the content of polyphenol, and the content of solid compounds was measured by drying (Dyshlyuk et al. 2017; Korotkova et al. 2018; Borodulin et al. 2019a).
The optical density of the samples was analyzed to assess the change in their colour. The analysis was performed using the photoelectric colorimeter KFK-2, in sample pans with a layer thickness of 10 mm and a wave length of 540 nm against pure whiskey distillate. The work of the photoelectric colorimeter KFK-2 consists in allowing a stream of light pass through the studied solution and measuring the optical transmission coefficient. The arithmetic mean of three replicates (to three decimal places) was used as a final optical density value (Borodulin et al. 2019b). Specification of the photoelectric colorimeter KFK-2:
| · Spectral wavelength: | 315 ~ 980 nm |
| · Transmission coefficient measurement range: | 100 ~ 5% |
| · Absolute error: | not exceeding ± 1% |
| · Light source: | small halogen tube KGM 6.3-15 |
| · Cuvette working length (cuvette set No. 2): | 50, 30, 20, 10, 5 mm |
| · Input power: | not exceeding 75 V*A |
| · AC power supply: | (220±22) W, (50/60±0.5) Hz |
| · Overall dimensions: | not exceeding 435 х 335 х 330 mm |
| · Weight: | 14 kg |
The Erumanis method was used to measure the content of polyphenols. This method was based on the reaction of polyphenols with trivalent iron salts in an alkaline medium. The polyphenol content (PPh) in the samples was calculated by the formula: PPh = A−B+C×820, where A was the optical density of the solution in the main experiment; B was the optical density of the solution in the control sample 1; C was the optical density of the solution in the control sample 2; and 820 was the conversion factor for polyphenols (Borodulin et al. 2020; Page 2019; Phetxumphou et al. 2020).
The content of solid compounds was measured by drying. The studies were performed using a thermogravimetric humidity analyzer MS-70. Devices of this type were based on the principle of thermogravimetric measurements, where samples with a known initial mass were dried, residues were weighed and the relative change in mass was determined with accuracy to four decimal places. After setting the accuracy and drying temperature, the sample weight and completion temperature were determined automatically. When the drying speed reaches the set value, the measurement stops automatically. The value of the solid content in the sample was calculated automatically by the formula: SC = (MW / MD) ×100%, where MW was the mass of the wet sample, MD was the mass of the dried sample (Pradal et al. 2018; Phetxumphou et al. 2020).
Specification of the humidity analyzer MS-70:
- Scale capacity, g 71
- Weighing sensitivity, g 0,0001
- Moisture content error, % 0,01
- Drying temperature, °C 30-200
- Humidity accuracy, %, (sample size: >1 g) 0,5
- Humidity accuracy, %, (sample size: >5 g) 0,01
- Weights external calibration 20g or 50g
- In-memory measuring programmes, ea 20
- Memory size, measurements 100
- Response rate, s < 1
- Platform diameter, mm 85
- Overall dimensions, mm 215х320х173
- Power supply 220 W
- Operating temperature range, °C +5 ~ +40
- Operating humidity, % not exceeding 85
- Weight, kg 6
The chromatographic and organoleptic analysis of the studied whiskey samples was performed by the Federal Budgetary Institution “State Regional Standardization, Metrology and Testing Centre of Kemerovo Region”. Certain properties were assessed using the gas chromatograph “Crystallux-4000M” according to the modern industrial standards. To analyze the effect of microwave radiation on the quality of whiskey distillate samples, a full-factorial experiment was performed, during which the following parameters obtained within previous studies were varied:
– the time of whisky distillate exposure to microwave radiation (t = 1, 2, 3 min.);
– the power of microwave radiation (N = 450 W – LOW mode; 600 W – MEDIUM mode; 750 W – HIGH mode);
– alcohol concentration in the whiskey distillate (C = 45%, 60%, 75%).
Young whiskey distillates meeting the modern industrial standards were stored glass tanks. Similar amounts of French oak chips of strong charring were added to the distillates (1 g per 500 ml of the solution). After that the samples were exposed to microwave radiation of different power N (400 W, 600 W, and 750 W) for a different time t (1, 2, and 3 minutes). These radiation power values were selected since at a lower radiation power no visible differences are observed in the process of whiskey distillates maturation compared to the classical method (i.e., microwave radiation has no effect): the resulting quality indicators (optical density, polyphenol content and solid compound content) do not change.
Qualitative changes in the numerical values of the indicators under consideration were observed when whiskey distillates mature with exposure to microwave radiation with a power of 450 W. Therefore, processing whiskey distillates with microwave radiation at a lower power was not advisable. When the microwave radiation power exceeds 750 W, the whiskey distillate started to boil, which led to the loss of solution during evaporation. In this regard, to intensify the process of whiskey distillate maturation, it was exposed to the influence of microwave radiation at the power ranging within 450-750 W. The distillates exposed to microwave radiation matured for 9 months, after which the studied quality indicators were measured. The obtained values were put in the table. The multiple regression analysis of the obtained numeric values was performed using Statistica 10 software (“General regression models” module).
RESULTS AND DISCUSSION
The optical density (D), polyphenol content (PPh) and solid compound content (SC) of the studied samples were measured for different values of the variables: (t), (N), and (C). The data of the full-factorial experiment and the obtained numeric values are provided in Table 2. Possible measurement errors are due to the standard error of the measuring devices.
Table 2. Changes in qualities indicators depending on technological parameters
| Sample No. | Values of technological parameters | Optical density | Polyphenol content, mg/dm3 | Solid compound content, g | |||||
| Х1 | Х2 | X3 | t, min | N, W | C, % | D | PPh | SC | |
| 1 | -1 | -1 | -1 | 1 | 450 | 45 | 0.065±1% | 186.9±1% | 0.0009±0.01% |
| 2 | 0 | -1 | -1 | 2 | 450 | 45 | 0.066±1% | 200.6±1% | 0.00091±0.01% |
| 3 | 1 | -1 | -1 | 3 | 450 | 45 | 0.061±1% | 213.3±1% | 0.001±0.01% |
| 4 | -1 | 0 | -1 | 1 | 600 | 45 | 0.064±1% | 245.8±1% | 0.0013±0.01% |
| 5 | 0 | 0 | -1 | 2 | 600 | 45 | 0.053±1% | 272.1±1% | 0.00133±0.01% |
| 6 | 1 | 0 | -1 | 3 | 600 | 45 | 0.056±1% | 300.5±1% | 0.0014±0.01% |
| 7 | -1 | 1 | -1 | 1 | 750 | 45 | 0.068±1% | 312.8±1% | 0.00145±0.01% |
| 8 | 0 | 1 | -1 | 2 | 750 | 45 | 0.063±1% | 334.2±1% | 0.00162±0.01% |
| 9 | 1 | 1 | -1 | 3 | 750 | 45 | 0.074±1% | 361.3±1% | 0.0017±0.01% |
| 10 | -1 | -1 | 0 | 1 | 450 | 60 | 0.064±1% | 194.5±1% | 0.001±0.01% |
| 11 | 0 | -1 | 0 | 2 | 450 | 60 | 0.072±1% | 214.4±1% | 0.0012±0.01% |
| 12 | 1 | -1 | 0 | 3 | 450 | 60 | 0.077±1% | 249±1% | 0.0015±0.01% |
| 13 | -1 | 0 | 0 | 1 | 600 | 60 | 0.071±1% | 278.7±1% | 0.0016±0.01% |
| 14 | 0 | 0 | 0 | 2 | 600 | 60 | 0.074±1% | 322.2±1% | 0.0016±0.01% |
| 15 | 1 | 0 | 0 | 3 | 600 | 60 | 0.061±1% | 347.9±1% | 0.00174±0.01% |
| 16 | -1 | 1 | 0 | 1 | 750 | 60 | 0.066±1% | 366.0±1% | 0.00181±0.01% |
| 17 | 0 | 1 | 0 | 2 | 750 | 60 | 0.07±1% | 374.5±1% | 0.0019±0.01% |
| 18 | 1 | 1 | 0 | 3 | 750 | 60 | 0.088±1% | 391.1±1% | 0.0021±0.01% |
| 19 | -1 | -1 | 1 | 1 | 450 | 75 | 0.086±1% | 223.6±1% | 0.0012±0.01% |
| 20 | 0 | -1 | 1 | 2 | 450 | 75 | 0.085±1% | 260.1±1% | 0.00135±0.01% |
| 21 | 1 | -1 | 1 | 3 | 450 | 75 | 0.082±1% | 274.4±1% | 0.0015±0.01% |
| 22 | -1 | 0 | 1 | 1 | 600 | 75 | 0.079±1% | 299.3±1% | 0.00171±0.01% |
| 23 | 0 | 0 | 1 | 2 | 600 | 75 | 0.093±1% | 310.7±1% | 0.00184±0.01% |
| 24 | 1 | 0 | 1 | 3 | 600 | 75 | 0.096±1% | 330.4±1% | 0.0022±0.01% |
| 25 | -1 | 1 | 1 | 1 | 750 | 75 | 0.092±1% | 374.7±1% | 0.0024±0.01% |
| 26 | 0 | 1 | 1 | 2 | 750 | 75 | 0.094±1% | 389.5±1% | 0.0025±0.01% |
| 27 | 1 | 1 | 1 | 3 | 750 | 75 | 0.095±1% | 419.2±1% | 0.0028±0.01% |
The study setup for microwave radiation influence on the quality indicators of the whiskey distillate is shown in Figure 1.
Figure 1: Study setup
The levels and variation intervals of the full-factorial design are shown in Table 1.
Table 1. Levels and variation intervals of the full-factorial design
| Factor and notation | Upper level | Lower level | Center point | Interval |
| Time of exposure to micro-wave radiation, min., Х1 | 3 | 1 | 2 | 1 |
| Power of microwave radiation, W, X2 | 750 | 450 | 600 | 150 |
| Alcohol concentration in the whiskey distillate, %, X3 | 75 | 60 | 45 | 15 |
Research task 1 was solved by determining regression dependences of the quality indicators of the obtained whiskey distillates (optical density (D), polyphenol content (PPh) and solid compound content (SC)) in the process of maturation under microwave radiation on any two independent variables (the time of whiskey distillate exposure to microwave radiation t; the power of microwave radiation N; alcohol concentration in the whiskey distillate C) using Statistica software. Further analysis of the obtained data contained three stages, with optimal technological parameters influencing the quality indicators of the maturing whiskey distillates exposed to microwave radiation determined for each of the stages (Rudoy 2016; Wu et al. 2018; Gnetko et al. 2019; Yang et al. 2020).
Stage 1 of solving Research task 1 involved multiple regression analysis of the influence of any two independent variables (the time of whiskey distillate exposure to microwave radiation t; the power of microwave radiation N; alcohol concentration in the whiskey distillate C) on the dependent variable: the optical density (D) of the maturing whiskey distillates exposed to microwave radiation (Table 2).
Data array processing allowed obtaining the regression models for the dependence of (D) in the whiskey distillates on the variables (t, N, C) (Wu et al. 2018; Habschied et al. 2019; Wanikawa 2020).
The relationship between the optical density of whiskey distillates and the time of exposure to and the power of microwave radiation is determined by the equation:
D = 0.140481 – 0.007833t + 0.000278t2 – 0.000229N (1)
The dependence of the optical density of whiskey distillates on the time of exposure to microwave radiation and alcohol concentration in the distillate is determined by the equation:
D = 0.108037 – 0.006500t + 0.000278t2 – 0.001933C + 0.000021C2 + 0.000122t×C (2)
The dependence of the optical density of whiskey distillates on the power of microwave radiation and alcohol concentration in the distillate is determined by the equation:
D = 0.167815 – 0.000233N – 0.002022C + 0.000021C2 (3)
The regression equation (1) shows that the time of exposure to microwave radiation t and its square (t2) have the highest influence on the dependent parameter (the optical density (D) of the whiskey distillate samples) related to the power of microwave radiation. The regression equation (2) shows that the time of exposure to microwave radiation t and its square (t2) have a significant influence on the optical density (D) of the whiskey distillates related to the alcohol concentration value (C), just like in the equation (1). The regression equation (3) shows that the power of microwave radiation (N) has the highest influence on the optical density (D) of the whiskey distillate samples related to the value alcohol concentration (C) in them (Pradal et al. 2018; Phetxumphou et al. 2020).
The performance metrics for the regression models (1-3) are provided in Table 3.
Table 3. Performance metrics the regression models (1-3)
| Indicator | Regression models | ||
| (1) | (2) | (3) | |
| Multiple correlation coefficient R | 0.8437 | 0.8719 | 0.8934 |
| Multiple determination coefficient R2 | 0.7308 | 0.7602 | 0.7982 |
| Adjusted correlation coefficient R2 | 0.6851 | 0.7032 | 0.7502 |
| F-criterion | 11.5254 | 13.32147 | 16.61727 |
| p-criterion | 0.000007 | 0.000006 | 0.000001 |
Table 3 shows that the multiple correlation coefficient R and multiple determination coefficient R2 for the regression models (1-3) lie in the range of 0.7308÷0.8934. Thus, the spread of values of the independent variables in the regression model in relation to their mean values is 73% or more. The F-criterion and the p-criterion are used to prove the regression significance. The p-criterion coefficients tend to zero, which indicates the statistical significance of the regression models (Wanikawa 2020).
The regression equation (1) was used to build the response surface showing the dependence of optical density (D) on the time of whiskey distillates exposure to and the power of microwave radiation (Figure 2). Figure 2 shows that the maximum values of (D) lie in the red and dark-red ranges with the highest values of the variables (t) and (N). Thus, the optimal parameters of exposing whiskey distillates to microwave radiation are t = 3 min., N = 750 W, with the optical density value (D) equaling 0.085 (Wanikawa 2020).
Figure 2: Response surface showing the dependence of optical density on the time of
whiskey distillates exposure to and the power of microwave radiation
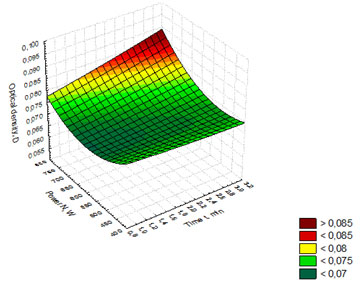
Figure 3: Response surface showing the dependence of optical density on the time of whiskey
distillates exposure to microwave radiation and alcohol concentration in the distillate.
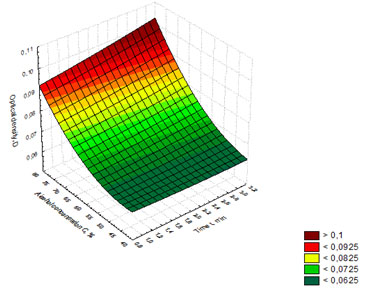
The regression equation (2) was used to build the response surface showing the dependence of optical density (D) on the time of whiskey distillates exposure to microwave radiation and alcohol concentration in the distillates (Figure 3).
Figure 3 shows that the maximum values of (D) lie in the red and dark-red ranges with the optimal parameters: time of exposure to microwave radiation t = 3 min, and alcohol concentration in the whiskey distillate C = 75 %, with the optical density value (D) being > 0.09.
Figure 4: Response surface showing the dependence of optical density on the power of
microwave radiation and alcohol concentration in the whiskey distillate
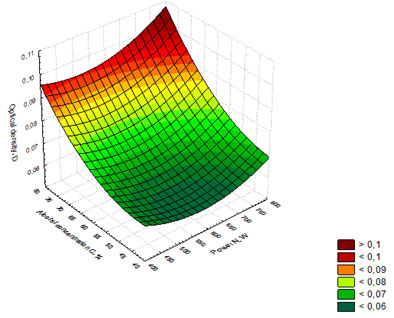
Further, the regression equation (3) was used to build the response surface showing the dependence of optical density on the power of microwave radiation and alcohol concentration in the whiskey distillates (Figure 4).
Figure 4 shows that the best values for (D) were found for the whiskey distillates with alcohol concentration C = 75% exposed to microwaves radiation with N = 750 W.
Summing up the results of the three response surfaces in Figures 2-4, we can conclude that the maximum value of optical density (D) is obtained at the following technological parameters of whiskey distillate maturation: t = 3 min., N = 750 W, C = 75%. Finally, the obtained experimental values of optical density of the whiskey distillates (D) were compared to the ones modeled (predicted) in regression equations (1-3) (Phetxumphou et al. 2020). Relative error was calculated for each of the experimental and the modeled (predicted) values using the formula (4):
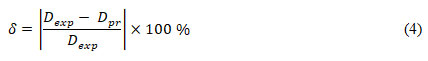
where δ is the relative error, %;
Dexp is the experimental value for optical density;
Dpr is the predicted value for optical density.
The obtained values are shown in the scatter graph (Figure 5).
Figure 5: Scatter graph for the predicted values of optical density
(D) compared to the experimental values
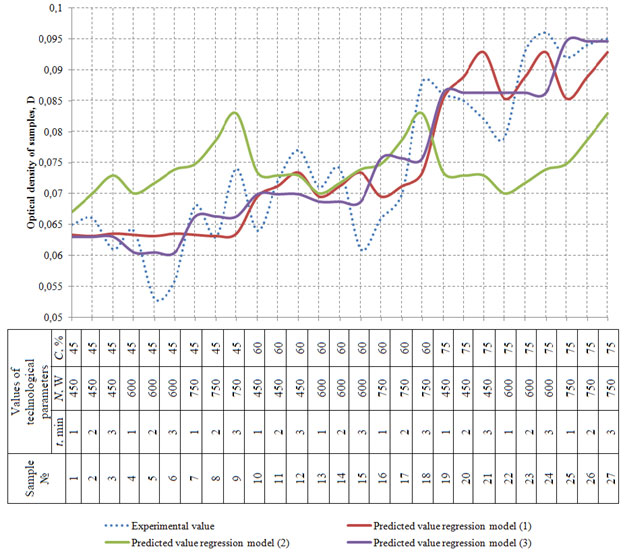
The mean relative error between the obtained experimental data on the optical density of whiskey distillates and values obtained with regression models varies within 6.5 % – 13.98%. Thus, the obtained models may be considered adequate and may be applied with a sufficient degree of accuracy for determining the optical density (D) of whiskey distillates.
Stage 2 of solving Research task 1 involved multiple regression analysis of the influence of any two independent variables (the time of whiskey distillate exposure to microwave radiation t; the power of microwave radiation N; alcohol concentration in the whiskey distillate C) on the dependent variable: the polyphenol content (PPh) in the maturing whiskey distillates exposed to microwave radiation (Table 2) (Phetxumphou et al. 2020).
Data array processing allowed obtaining the regression models for the polyphenol content (PPh) in the whiskey distillates on the variables (t, N, C) (Phetxumphou et al. 2020). The dependence of the polyphenol content in whiskey distillates on the time of exposure to and the power of microwave radiation is determined by the equation:
PPh= – 107.919 + 24.178t + 0.711t2 + 0.722N – 0.008t×N (5)
The dependence of the polyphenol content in whiskey distillates on the time of exposure to microwave radiation and alcohol concentration in the distillate is determined by the equation:
PPh = 9.91481 + 20.71111t + 0.71111t2 + 6.67259C – 0.04128C2 (6)
The dependence of the polyphenol content in whiskey distillates on the power of microwave radiation and alcohol concentration in the distillate is determined by the equation:
PPh = -275.919 + 0.667N + 6.241C – 0.041C2 + 0.001 N×C (7)
The regression equation (5) shows that the time of exposure to microwave radiation t has the highest influence on the dependent parameter: the polyphenol content in the whiskey distillate samples, related to the power of microwave radiation (N).
The regression equation (6) shows that the time of exposure to microwave radiation t has the highest influence on the polyphenol content in the whiskey distillate samples related to the power of microwave radiation, yet the latter factor should not be neglected as it shows a significant numerical characteristic. The regression equation (7) proves the significance of alcohol concentration inThe performance metrics for the regression models (5-7) are provided in Table 4. whiskey distillates (C) related to the power of microwave radiation (N) for determining the polyphenol content (PPh) (Phetxumphou et al. 2020).
Table 4. Performance metrics for the regression models (5-7)
| Indicator | Regression models | ||
| (5) | (6) | (7) | |
| Multiple correlation coefficient R | 0.937 | 0.422 | 0.95 |
| Multiple determination coefficient R2 | 0.879 | 0.1782 | 0.903 |
| Adjusted correlation coefficient R2 | 0.8507 | -0.0173 | 0.88 |
| F-criterion | 30.634 | 0.911 | 39.49 |
| p-criterion | 0.000000 | 0.492 | 0.000000 |
Table 4 shows that the regression model (5) has the multiple correlation coefficients R = 0.937780 and multiple determination coefficients R2 = 0.879432, which means that the spread of values of the independent variables in relation to their mean values is 88%. The F-criterion and the p-criterion are used to prove the regression significance. As for the regression model (5), F = 30.63497, and p = 0.000000; thus, the model is statistically significant. The multiple correlation coefficient and multiple determination coefficient for the regression model (6) have rather low values: R = 0.422 and R2 = 0.1782. Thus, the obtained regression model shows a 17% spread of values of the independent variables in relation to their mean values. The values of the F-criterion and the p-criterion are low as well; thus, the model has little statistical significance.
The coefficients R = 0.95 and R2 = 0.903 of the obtained regression model (7) show the maximum values in Table 4: the regression model shows a spread of values of the independent variables in relation to their mean values 90% or more. Since F = 39.49, and p = 0.000000, the statistical significance of the obtained model is high.
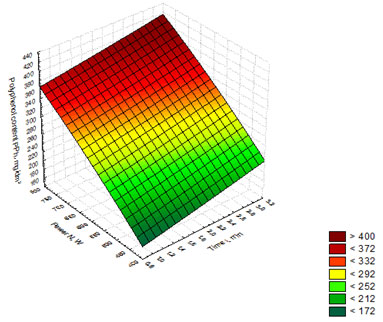
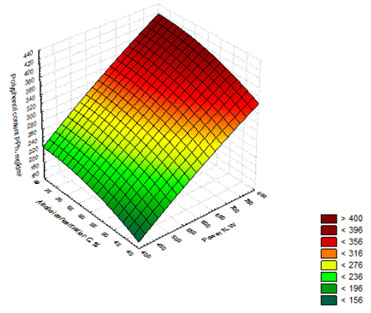
The regression equation (5) was used to build the response surface showing the dependence of polyphenol content on the time of whiskey distillates exposure to and the power of microwave radiation (Figure 6). Figure 6 shows that the maximum values of (PPh) lie in the red and dark-red ranges with the highest values of the variables (t) and (N). Thus, the optimal parameters of exposing whiskey distillates to microwave radiation are t = 3 min., N = 750 W, with polyphenol content reaching the value of 400 mg/dm3.
Figure 6. Response surface showing the dependence of polyphenol content on the
time of whiskey distillates exposure to and the power of microwave radiation
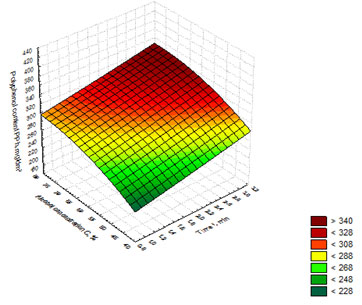
The regression equation (6) was used to build the response surface showing the dependence of polyphenol content on the time of whiskey distillates exposure to microwave radiation and alcohol concentration in the distillate (Figure 7). Figure 7 shows that the maximum values of (PPh) in the distillates were obtained at the following optimal parameters of exposing whiskey distillates to microwave radiation: t = 3 min., N = 750 W, with polyphenol content reaching the value of 340 mg/dm3.
Figure 7: Response surface showing the dependence of polyphenol content on the time of whiskey
distillates exposure to microwave radiation and alcohol concentration in the distillate
Further the regression equation (7) was used to build the response surface showing the dependence of polyphenol content on the power of microwave radiation and alcohol concentration in the whiskey distillate (Figure 8).
Figure 8 shows that the maximum values of polyphenol content (PPh) in the distillates were obtained for the samples with alcohol concentration C = 75% exposed to microwave radiation of N = 750 W. Summing up the results of the three response surfaces in Figures 5-7, we can conclude that the maximum value of polyphenol content (PPh) is obtained at the following technological parameters of whiskey distillate maturation: t = 3 min., N = 750 W, C = 75%.
Figure 8: Response surface showing the dependence of polyphenol content on the power of
microwave radiation and alcohol concentration in the whiskey distillate
At the end of this stage, the obtained experimental values of polyphenol content in the whiskey distillates (PPh) were compared to the ones modeled (predicted) in regression equations (5-7). Relative error was calculated for each of the experimental and the modeled (predicted) values using the formula (4) (with optical density values replaced by polyphenol content values). The obtained values are shown in the scatter graph (Figure 9).
Figure 9:Scatter graph for the predicted values of polyphenol
content (PPh) compared to the experimental values
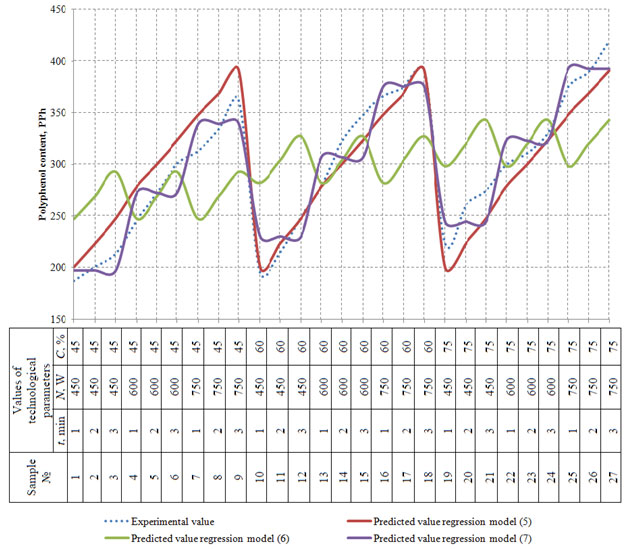
The mean relative error between the obtained experimental data on the polyphenol content in whiskey distillates and the values obtained with regression models (5) and (7) varies within 6.3 % – 7.003%. Thus, the obtained models may be considered adequate and may be applied with a sufficient degree of accuracy for determining the polyphenol content (PPh) in whiskey distillates. The mean relative error in the regression equation (6) equals 19%, which exceeds the limit for engineering calculations. Thus, the model (6) can be considered adequate and be applied for determining the polyphenol content (PPh) in whiskey distillates only as a first approximation (Habschied et al. 2019).
Stage 3 of solving Research task 1 involved multiple regression analysis of the influence of any two independent variables (the time of whiskey distillate exposure to microwave radiation t; the power of microwave radiation N; alcohol concentration in the whiskey distillate C) on the dependent variable: the solid compound content (SC) in the maturing whiskey distillates exposed to microwave radiation (Table 2).
Data array processing allowed obtaining the regression models for the solid compound content (SC) in the whiskey distillates on the variables (t, N, C).The dependence of the solid compound content in whiskey distillates on the time of exposure to and the power of microwave radiation is determined by the equation:
SC = – 0.000749 – 0.000037t + 0.000045t2 + 0.000005N (8)
The dependence of the solid compound content in whiskey distillates on the time of exposure to microwave radiation and alcohol concentration in the distillate is determined by the equation:
SC = 0.000841 – 0.000284t + 0.000045t2 + 0.000007C + 0.000004t×C (9)
The dependence of the solid compound content in whiskey distillates on the power of microwave radiation and alcohol concentration in the distillate is determined by the equation:
SC = 0.00051 + 0.000001N – 0.000022C (10)
The regression equation (8) shows that the time of exposure to microwave radiation t and t2 has the highest influence on the dependent parameter: the solid compound content in the whiskey distillate samples (SC), related to the power of microwave radiation (N).
The regression equation (9) shows that the time of exposure to microwave radiation t has the highest influence on the solid compound content in the whiskey distillates related to alcohol concentration (C), just like in the equation (8). The regression equation (9) proves the significance of alcohol concentration in whiskey distillates (C) related to the power of microwave radiation (N) for determining the solid compound content (SC) (Wanikawa 2020).
The performance metrics for the regression models (8-10) are provided in Table 5.
Table 5. Performance metrics for the regression models (8-10)
| Indicator | Regression models | ||
| (8) | (9) | (10) | |
| Multiple correlation coefficient R | 0.782 | 0.623 | 0.952 |
| Multiple determination coefficient R2 | 0.611 | 0.389 | 0.907 |
| Adjusted correlation coefficient R2 | 0.541 | 0.243 | 0.885 |
| F-criterion | 8.66 | 2.677 | 41.19 |
| p-criterion | 0.000234 | 0.0504 | 0.0000 |
Table 5 shows that the multiple correlation coefficients R and multiple determination coefficients R2 for the regression models (8-9) lie in the range of 0.389÷0.782. Thus, the spread of values of the independent variables in the regression model in relation to their mean values is 38% or more. The p-criterion coefficients tend to zero, which indicates the sufficient statistical significance of the regression models.
The coefficients R = 0.952 and R2 = 0.907 of the obtained regression model (10) show the maximum values in Table 5: the regression model shows a spread of values of the independent variables in relation to their mean values 90% or more. Since F = 41.19, and p = 0.000000, the statistical significance of the obtained model is high.
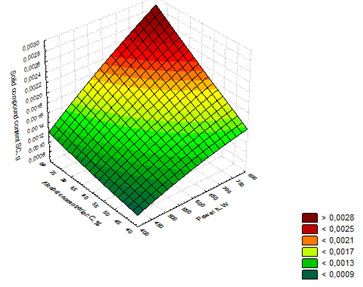
The regression model (8) was used to build the response surface showing the dependence of solid compound content on the time of whiskey distillates exposure to and the power of microwave radiation (Figure 10). Figure 10 shows that the maximum values of solid compound content (SC) in the distillates lie in the red and dark-red ranges with the highest values of the (t) and (N) parameters. Thus, the optimal parameters for whiskey distillate exposure are: t = 3 min and N = 750 W, with the solid compound content reaching up to 0.0022 g (Habschied et al. 2019; Wanikawa 2020).
Figure 10: Response surface showing the dependence of solid compound content on the
time of whiskey distillates exposure to and the power of microwave radiation
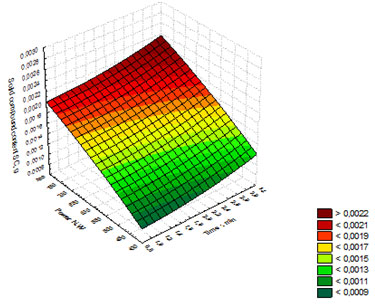
Figure 11. Response surface showing the dependence of solid compound content on the time of whiskey
distillates exposure to microwave radiation and alcohol concentration in the distillate
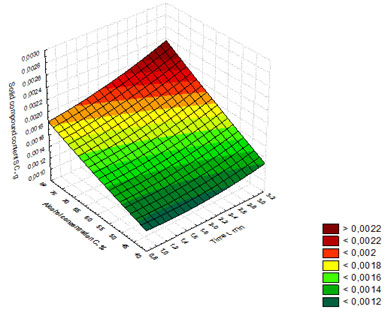
The regression model (9) was used to build the response surface showing the dependence of solid compound content on the time of whiskey distillates exposure to microwave radiation and alcohol concentration in the distillate (Figure 11). Figure 11 shows that the maximum values of solid compound content (SC) are obtained at the following exposure parameters: t = 3 min. and alcohol concentration in the whiskey distillate C = 75%, with the solid compound content reaching up 0.0024 g.
Figure 12. Response surface showing the dependence of solid compound content on the
power of microwave radiation and alcohol concentration in the whiskey distillate
Further the regression model (12) was used to build the response surface showing the dependence of solid compound content on the power of microwave radiation and alcohol concentration in the whiskey distillate (Figure 12). Figure 10 shows that the maximum values of solid compound content (SC) were obtained in the whiskey distillate samples with alcohol concentration C = 75%, exposed to microwave radiation at N = 750W. The value of the solid compound content in the sample reached 0.0028 g. Summing up the results of the three response surfaces in Figures 10-12, we can conclude that the maximum value of solid compound content (SC = 0.0028 g.) is obtained at the following technological parameters of whiskey distillate maturation: t = 3 min., N = 750 W, C = 75%.
At the end of this stage, the obtained experimental values of solid compound content in the whiskey distillates (SC) were compared to the ones modeled (predicted) in regression equations (8-10). Relative errors were calculated for the experimental value and each of the modeled values calculated using the formula (4) (values of solid compound content in the whiskey distillate were used instead of optical density values). Relative error was calculated for each of the experimental and the modeled (predicted) values using the formula (4) (with optical density values replaced by solid compound content values). The obtained values are shown in the scatter graph (Figure 13) (Wu et al. 2018; Habschied et al. 2019; Wanikawa 2020).
Figure 13. Scatter graph for the predicted values of solid compound
content (SC) compared to the experimental values
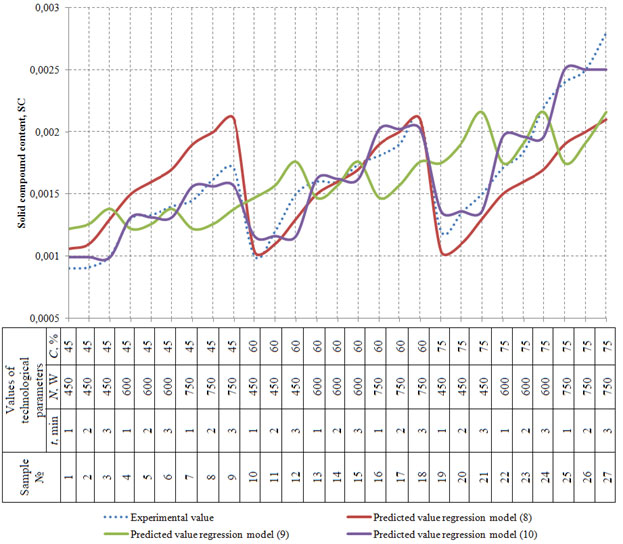
The mean relative error between the obtained experimental data on the solid compound content in whiskey distillates and the values obtained with regression models (8) and (9) varies within 12.5 % – 15.28%. Thus, they can be applied for determining the solid compound content in whiskey distillates only as a first approximation. Yet, the mean relative error for the regression equation (10) equals 7.2%; thus, it is considered adequate and may be applied with a sufficient degree of accuracy for determining the solid compound content (SC) in whiskey distillates.
Research task 2 was solved as follows.
Data array processing allowed obtaining the following regression models. The dependence of optical density (D) in the whiskey distillates on the variables (t, N, C) under exposure to microwave radiation:
D = 0.144852 + 0.000833t + 0.000278t2 – 0.0002N – 0.001689C + 0.000021C2 (11)
The dependence of the polyphenol content in whiskey distillates on the variables (t, N, C) under exposure to microwave radiation:
PPh = -329.726 + 25.244t + 0.711t2 + 0.682N + 6.277C – 0,041C2 – 0.008t×N – 0.018×
×C + 0.001 N×C (12)
The dependence of the solid compound content in whiskey distillates on the variables (t, N, C) under exposure to microwave radiation:
PPh = -275.919 + 0.667N + 6.241C – 0.041C2 + 0.001 N×C (7)
The regression equation (11) shows that alcohol concentration in whiskey distillates (C) and the time of their exposure to microwave radiation t have the highest influence on the depended parameter of optical density (D), since their numeric characteristics have maximum values. Yet, the numeric value of the power of microwave radiation (N) is rather significant; thus, it should not be excluded from further analysis.
The regression equation (12) shows that the time of exposure to microwave radiation (t) has the highest influence on the polyphenol content in whiskey distillates, just like in the equation (11). The influence of alcohol concentration in whiskey distillates (C) is slightly lower. The regression equation (13) proves the significant influence of the time of exposure to microwave radiation t influence of alcohol concentration in whiskey distillates (C) on the polyphenol content (PPh) in whiskey distillates (Wu et al. 2018; Habschied et al. 2019; Wanikawa 2020).
The performance metrics for the regression models (11-13) are provided in Table 6.
Table 6. Performance metrics for the regression models (11-13)
| Indicator | Regression models | ||
| (11) | (12) | (13) | |
| Multiple correlation coefficient R | 0.899 | 0.99 | 0.988 |
| Multiple determination coefficient R2 | 0.809 | 0.98 | 0.977 |
| Adjusted correlation coefficient R2 | 0.752 | 0.97 | 0.966 |
| F-criterion | 74.204 | 97.446 | 83.109 |
| p-criterion | 0.000003 | 0.000000 | 0.000000 |
Table 6 shows that the multiple correlation coefficients R and multiple determination coefficients R2 for all the regression models lie in the range of 0.80÷0.99. Thus, the spread of values of the independent variables in the regression model in relation to their mean values is 80% or more. The p-criterion coefficients tend to zero, which indicates the sufficient statistical significance of the regression models.
The F-criterion for the regression model (12) reaches 97.47 with p = 0.000000, which profess the high statistical significance of the obtained model. Finally, the obtained experimental values for optical density (D), polyphenols content (PPh) and solid compound content (SC) in whiskey distillates were compared to the ones modeled (predicted) in regression equations (11-13). The relative errors were calculated for each of the experimental and modeled values using the formula (4). The results are presented in Figure 14 (Habschied et al. 2019).
Figure 14: Relative errors of the experimental and modeled
values calculated using the formula (4)
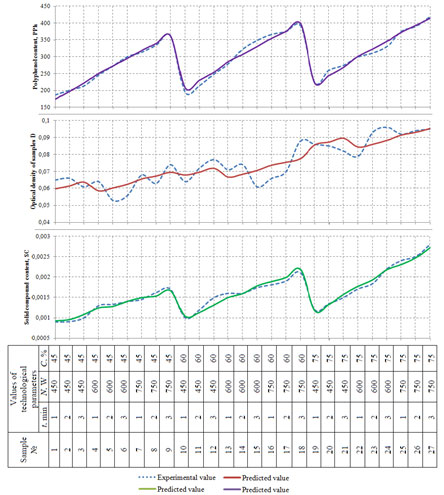
Figure 14 show that the mean relative error varies within 2.7 % – 6.7%, which proves the full adequacy of the obtained regression models (11-13) and allows using them for predicting the quality indicators of whiskey distillates with a high degree of accuracy.
Research task 3 was solved by performing the analysis of the whiskey produced with the rational technological parameters. The physical and chemical properties of the whiskey and its safety were analyzed according to the requirement of the applicable regulations. At the initial stage, chromatographic analysis was performed to determine the following quality indicators: the strength of the drink and mass concentrations of furfural, aldehydes, fusel oil, and esters. The presence of toxic elements (cadmium, lead, and mercury) was also determined. The obtained data are shown in the chromatogram (Figure 15) (Sidorenko and Surikova 2015).
Figure 15: Chromatogram of the whiskey
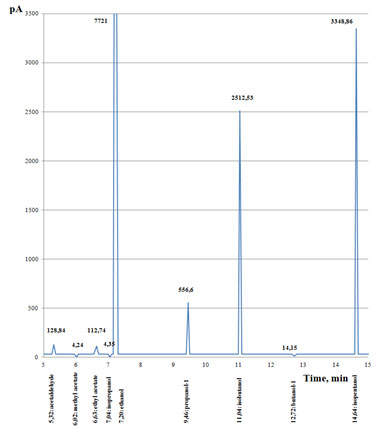
The chromatogram shows the concentration peaks for the elements that make up the aged whiskey distillate. The highest peak at 7.20 min indicates the presence of ethanol in the drink, which is the active ingredient in alcoholic beverages. At 11 min and 15 min, the highest peaks indicate the concentrations of isobutanol and isopentanol; these components are classified as fusel oils. Mercury, cadmium, arsenic and other toxic elements were not found in the drink: after 15 min, the chromatogram shows no unwanted elements in the whiskey distillate. The obtained results of the chromatographic analysis were grouped and compared to the permissible values as determined by industry standards (Table 7).
Table 7. Physical and chemical characteristics of the quality of the whiskey
| Parameter | Industry standard | Obtained results |
| Alcohol by volume, %. | 42 | 40.6+ 0,1 |
| Mass concentration of furfurol
in 1 dm3 of ethyl alcohol, mg |
30 | < 8.0 |
| Mass concentration of aldehydes
in 1 dm3 of ethyl alcohol, mg |
10-350 | 135.92+ 0.1 |
| Mass concentration of fusel oil
in 1 dm3 of ethyl alcohol, mg |
500-6000 | 5812.15+ 93.18 |
| Mass concentration of esters
in 1 dm3 of ethyl alcohol, mg |
50-1500 | 117.30 + 17.60 |
| Volume ratio of methyl alcohol
on ethyl alcohol basis, %, |
≤0.05 | 0.0097+ 0.0015 |
Table 7 shows that the strength of the whiskey obtained with the selected optimal parameters is 42%, which meets the requirements of regulatory documents. Furfural is a toxic substance that negatively affects the human nervous system and causes irritation of the skin and mucous membranes. In this regard, its content is strictly regulated. In the resulting whiskey, the furfural content is less than 8 mg per 1 dm3 of ethyl alcohol, which indicates good quality. The increased content of fusel oils and methyl alcohol in the distillate leads to a deterioration in its quality and indirectly reflects the shortcomings of purification in the production technology. Summarizing the obtained data, we can highlight that the obtained whiskey sample meets the requirements as it has a low content of these substances. Esters give the drink a fruity smell and affect the saturation of the aroma. In the resulting whiskey, the concentration of esters is within the normalized limits.
The number of toxic elements in the resulting whiskey does not exceed the permissible values and is < 0.001 mg/kg for cadmium and lead, < 0.002 mg/kg for arsenic, and < 0.0001 mg/kg for mercury (the normal values being 0.03, 0.3, 0.2, and 0.005 respectively). Summarizing the obtained data of physical and chemical tests, we can state that the whiskey meets the quality and safety requirements (Wu et al. 2018; Habschied et al. 2019; Wanikawa 2020).
Research task 4 required performing an organoleptic assessment of the obtained whiskey. The visual appearance, colour, aroma, and taste of the whiskey were assessed to obtain objective quality assessment results.
The obtained data are provided in Table 8.
Table 8. Organoleptic characteristics of the quality of the whiskey
| Parameter | Characteristics | |
| Industry standard | In the obtained sample | |
| Visual appearance | Transparent, free of foreign or residual matter | Transparent, free of foreign or residual matter |
| Colour | Ranging from light yellow
to dark brown |
Light brown |
| Aroma | Complex, with tones of sherry, almond, caramel, honey, hazelnut, wormwood, dried fruits or other tones, without foreign aroma | Complex whiskey smell with oak tomes, without foreign aromas |
| Taste | Harmonious, well-balanced, sweet-dry, with tones of nuts, caramel, or coffee, with shades of bitterness and apples or other tones, without foreign taste | Harmonious, sweet-dry, with oak tones, without foreign taste |
CONCLUSION
The findings of the present study noted that the developed new technology for whiskey distillate maturation, with the selected rational technological parameters of microwave radiation influence on the distillate, makes it possible to increase the efficiency of the process of whiskey aging and reduce its maturation time by 32%, compared to the drink prepared in the classical way. Additionally, it allows reducing the production cost (without purchasing expensive oak barrels) and the space for distillate maturation (without long-term storage of barrels). All this can find a worthy industrial application for private or newly opened whiskey distilleries, or in general for newcomers in this business who want to shorten the longest process of whiskey preparation – its maturation, and do not fear introducing technological innovations.
REFERENCES
Borodulin, D.M., Prosin, M.V., Potapova, M.N., et al. (2019a). Investigation of the influence of microwaves on the process of whisky distillate ripe. Storage and Processing of Farm Products 4: 141-153.
Borodulin, D.M., Reznichenko, I.Yu., Shalev, A.V., et al. (2019b). Comparative analysis of the quality of different types of malt for production of malt whiskey distillates. Beer and Beverages 2: 64-69.
Borodulin, D.M., Reznichenko, I.Yu., Shalev, A.V., et al. (2020). Research of the joint impact of microwave radiationand oxygen on the process of extraction in the technology for producing alcoholic beverages. Beer and Beverages 2: 15-19. https://doi.org/10.24411/2072-9650-2020-10012
Cammarano, D., Hawes, C., Squire, G., et al. (2019). Rainfall and temperature impacts on barley (Hordeum vulgare L.) yield and malting quality in Scotland. Field Crops Research 241: 107559. https://doi.org/10.1016/j.fcr.2019.107559
Drevelegka, I., and Goula, A.M. (2020). Recovery of grape pomace phenolic compounds through optimized extraction and adsorption processes. Chemical Engineering and Processing: Process Intensification 149: 107845. https://doi.org/10.1016/j.cep.2020.107845
Dumitriu, G., Teodosiu, C., Gabur, I., et al. (2019). Evaluation of aroma compounds in the process of wine ageing with oak chips. Foods 8 (12): 662. https://doi.org/10.3390/foods8120662
Dyshlyuk, L., Babich, O., Belova, D., et al. (2017). Comparative analysis of physical and chemical properties of biodegradable edible films of various compositions. Journal of Food Process Engineering 40 (1): e12331. https://doi.org/10.1111/jfpe.12331
Galan, A., Calinescu, I., Trifan, A., et al. (2017). New insights into the role of selective and volumetric heating during microwave extraction: Investigation of the extraction of polyphenolic compounds from sea buckthorn leaves using microwave-assisted extraction and conventional solvent extraction. Chemical Engineering and Processing: Process Intensification 116: 29-39. http://doi.org/10.1016/j.cep.2017.03.006
Gnetko, L.V., Nerovnykh, L.P., Gisheva, S.A., et al. (2019). Toxins and mechanisms of their interaction in fruit wines. International Journal of Innovative Technology and Exploring Engineering 8 (9): 1978-1981. https://doi.org/10.35940/ijitee.i8317.078919
González-Centeno, M.R., Chira, K., and Teissedre, P.L. (2019). Use of oak wood during malolactic fermentation and ageing: Impact on chardonnay wine character. Food Chemistry 278: 460-468. https://doi.org/10.1016/j.foodchem.2018.11.049
Habschied, K., August, H., Mastanjević, K., et al. (2019). Technological quality of new Croatian barley varieties intended for whisky malt production. Current Research in Nutrition and Food Science 7 (3): 783-790. DOI: https://doi.org/10.12944/CRNFSJ.7.3.17
Korotkova, T.G., Bushumov, S.A., Burlaka, S.D., et al. (2018). Influence of heat-and-power enterprises on the hydrosphere. International Journal of GEOMATE 15 (48): 99-106.
More, N.S., and Gogate, P.R. (2018). Intensification of degumming of crude soybean oil using ultrasound in combination with oxidizing agents. Chemical Engineering and Processing: Process Intensification 128: 132-142. https://doi.org/10.1016/j.cep.2018.04.008
Page, I.B. (2019). Why do distilleries produce multiple ages of whisky? Journal of Wine Economics 14 (1): 26-47. https://doi.org/10.1017/jwe.2018.54
Phetxumphou, K., Miller, G., Ashmore, P.L., et al. (2020). Mashbill and barrel aging effects on the sensory and chemometric profiles of American whiskeys. Journal of the Institute of Brewing 126 (2): 194-205. https://doi.org/10.1002/jib.596
Pradal, D., Vauchel, P., Decossin, S., et al. (2018). Integrated extraction-adsorption process for selective recovery of antioxidant phenolics from food industry by-product. Chemical Engineering and Processing: Process Intensification 127: 83-92. https://doi.org/10.1016/j.cep.2018.03.016
Rudoy, G.I. (2016). Analysis of the stability of nonlinear regression models to errors in measured data. Pattern recognition and image analysis (Advances in mathematical theory and applications) 26 (23): 608-616. https://doi.org/10.1134/S1054661816030172
Sidorenko, D.O., and Surikova, Zh.V. (2015). Khromatograficheskiye metody analiza Chromatographic methods of analysis. Moscow, Gubkin Russian State University of Oil and Gas Publishing Center, 25 p.
Wanikawa, A. (2020). Flavors in malt whisky: a review. Journal of the American Society of Brewing Chemists 78 (4): 260-278. https://doi.org/10.1080/03610470.2020.1795795
Wu, J., You, F., and Jiang, P. (2018). Noise variance estimation method based on regression analysis and principal component analysis. Journal of Electronics and Information Technology 40 (5): 1195-1201. https://doi.org/10.11999/JEIT170624
Yang, K., Somogyi, A., Thomas, C., et al. (2020). Analysis of barrel-aged Kentucky Bourbon whiskey by ultrahigh resolution mass spectrometry. Food Analytical Methods 13: 2301-2311. https://doi.org/10.1007/s12161-020-01850-z

