School of Environmental Science and Sustainable Development, Central University of Gujarat, Gandhinagar – 382030, Gandhinagar, Gujarat, India
Article Publishing History
Received: 10/03/2016
Accepted After Revision: 25/03/2016
The scientific evaluation, validation and authentication of medicinal plants are highly essential and key steps to achieve effective phytochemicals and drugs for disease prevention. The checklist of medicinal plants especially mangroves along with their scientific validation is still biased. The traditional methods are poor, time consuming as well as less scientific, so there is a need to used emerging technological knowledge and sophisticated analytical methods to fulfill this knowledge gap. Therefore, present study is an attempt to study the phytochemistry and recognize HPTLC pattern of Avicennia marinastem and spectrum analysis of resolved compounds in three different extracts. As a result, presence of different class of phytochemicals were detected. HPTLC determination densitometry analysis of 10 µl sample size under UV- 258 nm of stem extract – 1 (5 % NH3) showed the presence of 2 components with Rf values ranging from 0.76– 0.90; the stem extract – 2 (methanol alone) revealed the presence of 4 components with Rf values in the range of 0.03 – 0.90; and the stem extract – 3 (5 % HCl) revealed presence of 7 components with Rf values in the range of 0.03 – 0.90. As result, extract – 3 (Slightly acidic) gave maximum number of separated compounds and characteristic fingerprinting pattern and may be useful as a biochemical integrity check marker for this plant as well as to assess the diversity and further characterization of phyto-compounds present in Avicennia marina stem.
Avicennia Marina, Biochemical Markers, Extract, Fingerprinting, Phytochemicals, Hptlc, Stem
Dawane V, Pathak B, Fulekar M. H. HPTLC Pattern Assessment of Avicennia Marina Stem and Spectrometric Analysis of the Separated Phyto-Constituents. Biosc.Biotech.Res.Comm. 2016;9(1).
Dawane V, Pathak B, Fulekar M. H. HPTLC Pattern Assessment of Avicennia Marina Stem and Spectrometric Analysis of the Separated Phyto-Constituents. Biosc.Biotech.Res.Comm. 2016;9(1). Available from: https://bit.ly/2B6yDNR
Introduction
Plants are the chemical factories of nature and enormous sources of organic chemical entities on this planet (Balandrin et al., 1985; Marderosian, 1987; Pavinato et al., 2008;Udayaprakash et al., 2013). Coastal marine flora, specially mangroves are too an ultimate and rich source of biochemically unique chemicals and have broader degree of valuable phytochemicals (Bandarnayake, 2002; Boopathy and Kathiresan, 2010; Patra and Thatoi, 2011) useful in ethno medicine and pharmacology (Bandarnayake, 1998; Ravindran et al., 2005; Revathi et al., 2013) and asignificant role in the field of natural product research and drug discovery since ancient times (Kathiresan and Bingham, 2001; Bandarnayake, 2002; Saikia et al., 2013).
Among all true mangrove species of the world, Avicennia marina is a valuable mangrove because of its abundant distribution (Duck et al., 1998), availabilityand useful medicinal values (Bandarnayake, 1998) of its different parts like leafs, stems, roots, flowers and also as a whole plant formulation, (Ishrak et al., 2003).
The stem of Avicennia marina possess various pharmacological and bioactive activities including anticancer (Prakash et al., 2013), antimalarial (Sundaram, 2010 and Rafat et al., 2012), anti-inflammatory (Vinod and Guruvayoorappan, 2012), antioxidant (Thatoi et al., 2014), antibacterial (Sharief et al., 2014), antifungal (Marium et al., 2006) and antiviral (Ishrak et al., 2003). These and several other studies have made this mangrove a precious and preferable source of new and already existing phytochemicals for disease prevention.
In the field of herbal treatment standardization of plant materials is the essential requirement of the day (Folashade et al., 2012) and the WHO has also emphasized the need to ensure the proper authentication and quality assessment of medicinal plants, their products, extractsalongwith their formulations (Calixto, 2000; Shrikumer et al., 2006) by applying modern sophisticated techniques for their proper use in medication (Gautam et al., 2010). For this reason HPTLC becomes a routine technique because of its uniqueness, specificity and simplicity for cheap, fast, accurate and reliable identification, authentication and fingerprinting of herbals now a days, (Reich and Schibli,
2007).
The main objective of this study is to stabilize HPTLC fingerprint pattern for Avicennia marina stem by comparethree different formulations of same methanol extracts of the stem.The present study may serve as a basis for medicinal use of Avicennia marina stem and for making strategies related to compounds separation,characterization and isolation from its extracts or formulations.
Material And Methods
Avicennia marina was collected in January 2014 from the S.P.Godrej Marine Ecology Centre, Vikhroli, Mumbai Maharashtra, India (Geographical coordinates 19˚05’50.82˚N–72˚56’24.06 ˚E). The plant materials were identified and authentication certificate issued by the same institute.
The stem was shed dried for 15 days and grounded by mechanical grinder into coarse particles. For extract – 1, the 500 mg of stem power was mixed with 10 ml methanol along with 5 % NH3. For extract – 2, 500 mg of stem power was mixed with 10 ml methanol. For extract – 3, the 500 mg of stem power was mixed with 10 ml methanol along with 5 % HCl.All three extracts were sonicated for 4hours until the extract was clear or colorless. Direct sun light and high temperature was avoided to protect heat sensitive phytochemicals. Extracts were filtered through Whitman No.1 filter.
CAMAG HPTLC system equipped with automatic TLC sampler LIMONATE V, TLC scanner 3, REPROSTAR 3 with 12 bit CCD camera was used for photo documentation analysis along with winCATS 4 CAMAG Planer Chromatography software. All the solvents used for HPTLC analysis were of HPLC analytical grade obtained from Merck, India.
Preliminary phytochemical analysis was performed for establishing the phyto-constituents (phenols, alkaloids, terpenoids, steroids, carbohydrates, proteins, amino acids, tannins, saponins, and flavonoids, Gums and Mucilage) present/absence in the extracts according to the standard methods (Evans, 1998; Khandelwal, 2007).
Optimized HPTLC studies were carried out following the methods of Wagner et al., (1996), Harborne (1998) Reich and Schibli (2007) and Mona et al., (2014).The protocol for preparing sample solutions was optimized for high quality and accurate TLC pattern generation.
HPTLC of three different extracts were performed on 10×10 cm commercial Aluminum – shits precoated with 0.2 mm layer of silica gel 60F254(E. Merck Ltd, Darmstadt, Germany)batch number – 1.05554.0007 stored in a desiccator. Sample extracts were applied as bands 6 mm wide by means of CAMAG Linomat V sample applicator equipped with a 100 μL syringe, programmed through winCATS software. The plate was prewashed with methanol and dried in an oven at 60°C for 5 minutes. The sample loaded plate was kept in TLC Twin Trough Chamber (10x10cm) for 20 min. saturation with the solvent vapors with respective mobile phase. The plate was developed in a linear ascending mode upto 90 mm.
The optimized mobile phase Toluene:Chloroform: n – Propanol: Ethanol (4:4:1:1) were used (Reich and Schibli, 2007). After development, the plate was subjected for drying by hot air device (drier) and 10 minutes on CAMAG plate heater (110 0C) at room temperature and kept it for documentation in the CAMAG TLC visualizer. The CAMAG TLC visualizer capture the images under 254 nm (UV range), 366nm (Fluorescence) and 540nm (White R).After it, Densitometry evaluations were carried out under 258 nm (Deuterium lamp) with the use of CAMAG Scanner 3 and spectral analysis is performed under D2 – lamp (range 190 nm – 400 nm). Finally, RF values calculations, peak areas calculations were analyzed for interpretation and HPTLC Fingerprinting pattern profile generation.
In the last step the plate was derivatized with specific derivatizing agentfor visual identification. In this experiment the derivatizing agent was AnisaldehydeSulphuric Acid reagent (ASR) in theCAMAG derivatizating chamber for 2-3 seconds and air dried.
After drying, the plate was heated on CAMAG plate heater for 3-10 minutes at 110 0C until the color bands can be seen visually. Final images were quickly captured by the CAMAG TLC Visualizer under visible white light and florescence (366 nm). After this, UV – 258 nm scanning profileis used as final interpretation for HPTLC fingerprinting development of three different extracts.
Results And Disscution
Preliminary phytochemical analysis of these extracts showed the presence of major secondary metabolites in their extracts with minor differences. All three extracts showed the absence of steroids and proteins and amino acids. Extract – 1 (NH3) showed the absence of tannins and saponins also. Apart from that all metabolites were present in three extracts. Extract – 3 (HCl) showed high presence of tannins and phenols (Table.1).
| Table 1: Preliminary phytochemical bioassay results. + = presence and – = absence. |
||||
| Phytochemical | Test | Results | ||
| NH3 | M | HCl | ||
| Phenols | Folin- Ciocalteu reagent test | + | + | ++ |
| Flavonoids | Shenoda test | + | + | + |
| Alkaloid | Mayer’s test | + | + | + |
| Cardial Glycosides | Keiler – Killani test | + | + | + |
| Anthraquenones Glycosides | Borntrager’s test | + | + | + |
| Tannins | FeCl3 test | – | + | ++ |
| Terpenoids | Noller’s test | + | + | + |
| Steroids | Libermann’s test | – | – | – |
| Saponins | Foam test | – | + | + |
| Carbohydrates | Fehling’s test | + | + | + |
| Gums and Mucilage | Swelling test | + | + | + |
| Proteins and amino acids | Ninhydrin test | – | – | – |
HPTLC photo documentation results
HPTLC scanning results (under 258 nm)
The HPTLC densitogram under UV – 258 nm of three extracts revealed several peaks which are presented in Fig. 2.
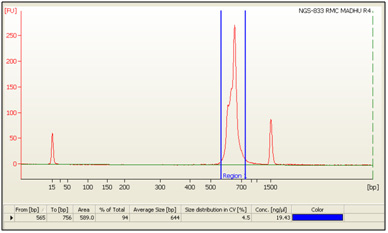 |
Figure 2: Figure is showing densitogram results of developed TLC plate under UV – 258 nm. |
The densitometry results of extract – 1, under UV – 258 nm revealed 2 spots with Rf max values 0.79 and 0.87 (Fig. 3 and Table. 2). Both 2 spots are principal components of extract – 1 alongwith the percentage area of 41.93 and 58.07 respectively.
| Table 2: Number of detected Peaks, their corresponding Rf values, Height – Area calculation results of Extract – 1. | ||||||
| Track | Peak | Rf Max | Max Height | Max % | Area (AU) | Area % |
| A | 1 | 0.79 | 75.4 | 55.45 | 1897.6 | 41.93 |
| A | 2 | 0.86 | 60.6 | 44.55 | 2627.9 | 58.07 |
 |
Figure 3: Extract.1 HPTLC chromatogram. |
The densitometry results of extract – 2, under UV – 258 nm revealed the presence 4 spots with Rf max values 0.05, 0.72, 0.79 and 0.86 (Fig. 4 and Table. 3). Two new spots were detected at the Rf max 0.05 and 0.72, which were not present on extract – 1.
| Table 3: Number of detected Peaks, their corresponding Rf values, Height – Area calculation results of Extract – 2. | ||||||
| Track | Peak | Rf Max | Max Height | Max % | Area | Area % |
| B | 1 | 0.05 | 15.4 | 5.65 | 203.8 | 02.29 |
| B | 2 | 0.72 | 35.2 | 12.92 | 933.3 | 10.47 |
| B | 3 | 0.79 | 130.0 | 47.70 | 4029.3 | 45.20 |
| B | 4 | 0.86 | 92.0 | 33.73 | 3747.5 | 42.04 |
 |
Figure 4: Extract. 2 HPTLC chromatogram |
Among these 4 detected spots, 2 spots (spot no. 3 and 4) may be principal components of extract – 2 alongwith the very high percentage area of 45.20 and 42.04 respectively. Other than these major peaks, the spots at Rf max 0.05 and 0.72 contain very less percentage area of 2.29 and 10.47 respectively.
The densitometry results of extract – 3, under UV – 258 nm revealed the presence 7 spots with Rf max values 0.09, 0.11, 0.44, 0.51, 0.77, 0.85 and 0.89 (Fig. 5 and Table. 4). Among all 7 detected peaks, 3 spots (spot no. 1, 2 and 5) with corresponding Rf max 0.09, 0.11 and 0.77 may be principal components of extract – 3 because they contain comparatively the very high percentage area of 19.97, 31.38 and 21.49 respectively. Other peaks at the Rf max 0.44, 0.51, 0.85 and 0.89 contain very less percentage area of 3.64, 5.07, 12.23 and 6.22 respectively.
| Table 4: Number of detected Peaks, their corresponding Rf values, Height – Area calculation results of Extract – 3. | ||||||
| Track | Peak | Rf Max | Max Height | Max % | Area (AU) | Area % |
| C | 1 | 0.09 | 165.8 | 20.17 | 4525.0 | 19.97 |
| C | 2 | 0.11 | 240.3 | 29.24 | 7110.0 | 31.38 |
| C | 3 | 0.44 | 59.1 | 7.19 | 823.90 | 03.64 |
| C | 4 | 0.51 | 81.3 | 9.89 | 1147.8 | 05.07 |
| C | 5 | 0.79 | 116.8 | 14.21 | 4868.5 | 21.49 |
| C | 6 | 0.86 | 81.3 | 9.89 | 2771.8 | 12.23 |
| C | 7 | 0.89 | 77.3 | 9.41 | 1408.9 | 06.22 |
 |
Figure 5: Extract – 3 HPTLC chromatogram |
HPTLC spectra results
So we can see that the developed chromatograms were specific with selected mobile phase Toluene: Chloroform: n – Propanol: Ethanol (4:4:1:1), Rf values and can serve as critical tool for analysis and standardization of the phytochemicals/drugs from Avicennia marina stem. Among all three extracts, extract – 1, 2 and 3 revealed the 2, 4 and 7 spots respectively. It means extract – 3 is comparatively good for phytochemicals studies for Avicennia marina stem because maximum number of peak separation is achieved under UV – 258 nm (high energy zone). The spectra analysis showed that the two spots RFmax values 0.79 and 0.86 are same components and detected in all three samples. Two spots RFmax values 0.05 and 0.72 are uniquely detected only in sample no. – 2 and among seven detected spots, five spots RFmax values 0.09, 0.11, 0.44, 0.51 and 0.89 are uniquely detected in the sample no. – 3 only.
The spectra analysis and pattern comparisons elucidated further conformation about the uniqueness and similarities of the compounds present in these extracts (Table.5 and Figure. 6).
| Table 5: Table of spots detected their RF, position, wavelength and comparative presence or absence in samples. | |||||
| Detected spot RF | Position (MD mm) | Correspo-ndding wavelengths (Maximum @) | Presence of spot in the sample | ||
| stem extract – 1 (5 % NH3) | stem extract – 2 (metha-nol alone) | stem extract – 3 (5 % HCl) | |||
| 0.05 | 11.5 | 208 nm | – | yes | – |
| 0.09 | 14.4 | 291 nm | – | – | Yes |
| 0.11 | 15.9 | 293 nm | – | – | Yes |
| 0.44 | 39.4 | 190 nm | – | – | Yes |
| 0.51 | 44.8 | 201 nm | – | – | Yes |
| 0.72 | 59.9 | 195 nm | – | yes | – |
| 0.79 | 64.4 | 198 nm | yes | yes | yes |
| 0.86 | 69.8 | 197 nm | yes | yes | yes |
| 0.89 | 71.8 | 198 nm | – | – | yes |
Conclusion
In conclusion, this optimized HPTLC method for Avicennia marina stem can provide standard fingerprints and can be used as a reference. Among three different extracts of Avicennia marina stem the extract – 3 is comparatively good for evaluation of phytochemical fingerprinting profile.
This characteristic and optimized HPTLC pattern assessment method for Avicennia marina stem is a fast, cheap, accurate, precise and reliable method for the identification, fingerprinting, authentication, and quality control. It can also provide the basic information useful for the isolation and purification of existing or new bioactive compounds because the unique spectra along with corresponding RF values can provide a basis and better insides for further analysis.
Acknowledgement
Authors are thankful to S.P. Godrej Marine Ecology Center, Vikhroli, Mumbai for Avicennia marina sample collection and also thankful to ANCHROM HPTLC labs, Mulund, Mumbai for providing HPTLC facilities during this research.
Mr. Vinars Dawane is thankful to UGC, New Delhi for the award of Rajiv Gandhi National Fellowship (letter no. 2012-13/21095) for financial support.
References
Balandrin MF, Klocke JA, Wurtele ES,Bollinger WH (1985). Natural plant chemicals: sources of industrial and medicinal materials. Science; 228 (4704): 1154-1160.
Bandarnayake, W.M. (1998). Traditional and Medicinal uses of mangroves. Mangroves and Salt Marshes; 2: 133–148.
Bandarnayake, W.M. (2002). Bioactivities, bioactive compounds and chemical constituents of mangrove plants. Wetlands Ecological Management; 10: 421-452.
Blasco F, Gauquelin T, Rasolofoharinoro M, Denis J, Aizpuru M, Caldairou C (1998). Recent advances in mangrove studies using remote sensing data. Marine and Freshwater Research; 49(4): 287 – 296.
Boopathy NS, Kathiresan K (2010). Anticancer Drugs from Marine Flora: An Overview. Journal of Oncology; 1- 18.
Calixto JB (2000). Efficacy, safety, quality control,marketing and regulatory guidelinesfor herbal medicines (phytotherapeutica gents). Brazilian Journal of Medical and Biological Research; 33: 179-189.
Duck NC, Ball MC, Ellison JC (1998). Factors influencing biodiversity and distributional gradients in mangroves. Global ecology and biogeography letters; 7: 27 – 47.
Evans WC (1998). Trease and Evans Phamacognose 14th Edition W.B. Saunders Company Limited, Singapore; 315-16.
Folashade KO, Omoregie EH, Ochogu AP (2012). Standardization of herbal medicines – A review. International Journal of Biodiversity and Conservation; 4(3): 101-112.
Gautam A, Kashyap SJ, Sharma PK, Garg VK,Visht S, Kumar N (2010). Identification, evaluation and standardization of herbal drugs: A review. Der Pharmacia Lettre; 2(6): 302-315.
Harborne JB (1998). Phytochemical methods. 3rd ed. London. Thomson Science, p. 44-46.
Ishrak K, Ali Gab-Alla, Waleed S and Moustafa F (2003). Biological activities and phytochemical constituents of the gray mangrove Avicennia marina (Forssk.) Vierh. Egypt J of Biol.; 5: 62-69.
Kathiresan, K. and Bingham B. L., (2001). Biology of mangrove and mangrove ecosystems. Advances in Marine Biology, 40: 81‐251.
Khandelwal KR (2007). Techniques and Experiments, Practical Pharmacognosy. Ed 17th, Nirali Prakashan, Pune; 149-56.
Manmud I et al. (2014). Pharmacological and Ethnomedicinal Overview of Heritiera fomes: Future Prospects. International Scholarly Research Notices; 1- 12.
Marderosian AD (1987). Overview of the Use of Food/Natural Products as Drugs. Therapeutic Innovation & Regulatory Science; 21(2): 229-243.
Marium T, Shahnaz D, Fatima S, Javed Zaki M (2006). Use of Avicennia marina in the control of root infecting fungi on Okra and Mash bean. Pak J Bot.; 38(3): 811-815.
Mona S.M., Mohamed F.A., Perwez A., Hassan S.K., Abelkhalig M.M., Wadah J.A. (2014). Chromatographic finger print analysis of anti-inflammatory activeextract fractions of aerial parts of by HPTLC technique. Asian Pac J Trop Biomed.; 4(3): 203-208.
Patra JK, Thatoi HN (2011). Metabolic diversity and bioactivity screening of mangrove plants: a review. Acta Physiologiae Plantarum; 33(4): 1051-1061.
Pavinato PS, Alexandre Merlin A, Ciro Rosolem CA (2008). Organic compounds from plant extracts and their effect on soil phosphorus availability. Pesq. agropec. bras. Brasília; 43 (10): 1379-1388.
Prakash M and Sivakumar T (2013). A study on antibacterial activity of mangrove plant Excoecariaa gallocha L. Int.J.Curr.Microbiol. App.Sci.; 2(8): 260-262.
Prakash S, Sukhramani, Piyush P (2013). Biological screening of Avicennia marina for anticancer activity. Der Pharmacia Sinica; 4(2): 125-130.
Rafat M, Khattab A, Gaballa, Saad M, Zakaria, Abdullah EL, Sayed.Ali1 and Ibrahim S (2012). Larvicidal effect of crude extracts of some marine plants (mangrove and seagrasses) on mosquitoes of Culexpipiens. Egypt. J. Aquat. Biol. & Fish; 16(2): 99-105.
Ravindran KC, Venkatesan K, Balakrishnan V, Chellappan KP, Balasubramanian T (2005). Ethnomedicinal studies of Pichavaram mangroves of east coast, Tamil Nadu. Ind. J. Trad. Know.; 4(4): 409- 411.
Reich E and Schibli A (2007). High Performance Thin Layer Chromatography for the Analysis of Medicinal Plants; published by Thieme Medical Publishers, Inc, The Americans.
Revathi P, T Jeyaseelan Senthinath J, Thirumalaikolundusubramanian P, Prabhu N (2013). Medicinal properties of mangrove plants – an overview. International Journal of Bioassays; 1597-1600.
Saikia, R, Talukdar AD, Chetia, P and Choudhury MD (2013). Preliminary phytochemical investigation and TLC profiling of ethnomedicinally important plant, Scopariadulcis linnaeus Pleione. 7(2): 366-372.
Sharief N, Srinivasulu A, Satya P and Uma M, Rao V (2014). Quantification of Tannins, Antioxidant Capacity and Antibacterial Activities of Stem extracts of Avicennia marina (L). Int J Biol Med Res; 5(1): 3869-3873.
Shrikumer S, Maheshwari U, Sughanti A; TK Ravi TK (2006). WHO guidelines for herbal drugs standardization.
Sundaram R (2010). Mangrove plants as a source of lead compounds for the development of antiplasmodial drug from South East Cost of India. Parasitil Res; 108:1405-1410.
Thatoi HN, Patra JK, Das SK (2014). Free radical scavenging and antioxidant potential of mangrove plants: a review. Acta Physiol Plant; 36:561–579.
Udayaprakash NK, Bhuvaneshwari S, Divyasri D, Kurien NA, Uma P, and Arokiyaraj S. (2013). Studies the phytochemistry and bioactivity of leaves of few common trees in Chennai, Tamil Nadu India. International Journal of Pharmacy and Pharmaceutical Sciences; 5(3): 88-91.
Vinod Prabhu V and Guruvayoorappan C (2012). Phytochemical screening of methanolic extract of mangrove Avicennia marina (Forssk.) Vierh. Pelagia Research Library Der Pharma Sinica; 3(1): 64-70.
Wagner H., Baldt S., Zgainski E.M. (1996). Plant drug analysis. Published by Berlin: Springer, p. 85.

