1Associate Professor, Department of Geography, Payam-e Noor University, Tehran, Iran
2Invited Teacher, Payam-e Noor University, Tehran Iran
Corresponding author Email: halabian_a@yahoo.com
Article Publishing History
Received: 27/11/2017
Accepted After Revision: 26/09/2017
The aim of this paper is to analyze climate change over Khazar Basin for the next decades. Khazar Basin is considered as one the most important one in Iran due to its specific climatic conditions. The experiment of climate change across the basin was conducted using 21 synoptic stations by the application of LARS-WG weather generator, the years from 1992 to 2015 were selected as the base period and the analyses were carried out to estimate climate change over the 2046-2065. The analyses for future climate change then were compared to the base period. The results revealed that in the future period, on average precipitation will decrease -37.1 mm and min and max temperature will increase 3.8 and 3.2 ºC respectively compared to the base period. Therefore it could be deduced that climate change can have adverse effects on the Basin and some adaptive steps must be taken to reduce the bad effects accordingly.
Climate Change, Larse-Wg, Khazar Basin, Precipitation, Temperature
Halabian A. H, Keikhosravi M. S. Exploring Climate Change Over Khazar Basin Based on LARSE-WG Weather Generator. Biosc.Biotech.Res.Comm. 2017;10(3).
Halabian A. H, Keikhosravi M. S. Exploring Climate Change Over Khazar Basin Based on LARSE-WG Weather Generator. Biosc.Biotech.Res.Comm. 2017;10(3). Available from: https://bit.ly/2FajCNt
Introduction
Developing countries are vulnerable to climate changes, mainly due to their limited adaptive capacities in dealing with extreme events (Pouliotte et al., 2009). the main findings from the latest report on climate change and a special report on extreme events from the Intergovernmental Panel on Climate Change show a greater consensus about a likely increase in the frequency and intensity of heavy precipitation events over land areas since 1950 (IPCC). Therefore, it is of great importance to predict climate change for the future decades to deal with its possible effects over different geographical territories. In the past years many investigations have been conducted to reveal climate change for different temporal resolutions and also for different parts of the globe. The effects of climate change has been simulated in 12 rivers of India, the authors have concluded that under a scenario of climate change a general reduction in the quantity of the available runoff will occur and the intensity of floods in various parts of India may get deteriorated (Gosain et al., 2006). The results of an investigation also show that between 1995 and 2025, the extents of the regions that will be affected by severe water stress will increase and this condition is especially true for Southern and Western Africa and South Asia (Alcamo et al., 2000). In a research it was found that based on ENSEMBLES anthropogenic climate-change (ACC) global simulations and the Climate version of the Local Model (CLM) precipitation is expected to be critically decreased in three selected region of Greece (Paparrizos et al. 2016).
In another study it was revealed that over the Central Asian region, the aridity is expected to increase (Lioubimtseva and Henebry, 2009). In another research work it was found that for the periods from 2010 to 2040 and 2070 to 2100 and based on the CGCM 3.1 dry regions of the Iran will get less precipitation (Abbaspour et al., 2009). The findings of Arnell and Gosling (2016) revealed that under the climate model (HadCM3 and SRES A1b), in 2050 the current 100-year flood would occur at least twice as frequently across 40 % of the globe, approximately 450 million flood-prone people and 430 thousand km2 of flood-prone cropland would be exposed to a doubling of flood frequency, and global flood risk would increase by approximately 187 % over the risk in 2050 in the absence of climate change.
Zhang et al. (2016) estimated stream flows in the Xin River Basin, China based on climate change scenarios downscaled from different GCMs (BCC-CSM1.1, CanESM2, and NorESM1-M) under three Representative Concentration Pathways (RCPs). The ensemble average of streamflow in GCMs demonstrated that many RCPs significantly decrease from May to June but increase from August to September relative to the baseline period. The goal of this investigation is to reveal the changes of temperature and precipitation over the study region. As rain fed agriculture is very common in the basin the findings of the current paper could assist policy makers to have a better picture of climate of the study region for the next decades.
| Table 1: Change of the observed and simulated climatic variables across the Basin. | |||
| Min temperature (ºC) | Max temperature (ºC) | Precipitation (mm) | |
| Mean of observed (1992-2015) | 5.4 | 17.2 | 555.5 |
| Mean of simulated (2046-2065) | 9.2 | 20.4 | 518.4 |
| Difference (future – base ) | 3.8 | 3.2 | -37.1 |
Material and Methods
Study Region
Khazar Basin is geographically located in the north parts of Iran with a very diverse climate. The Alborze Mountains which are extended from west to east have created two distinct climates in the region. The north parts of the Basin receive a lot of precipitation throughout the year while the southern counterpart receives much less precipitation as the humidity is often confined to the northern areas of the Basin. The climate of the north part is mild and humid but the western parts of the region have a cold climate. The general location of the Basin has been depicted in Figure (1).
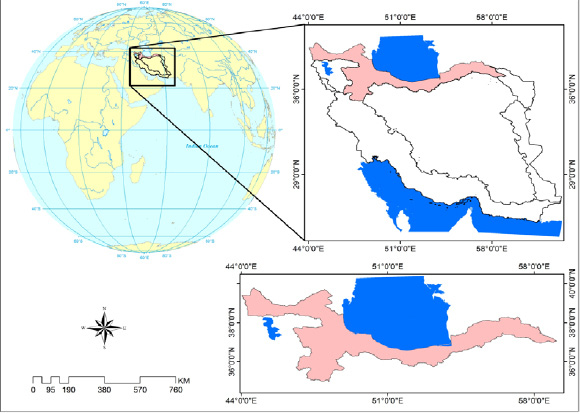 |
Figure 1: General location of Khazar Basin |
Materials and Methods
In this paper, the daily precipitation, min temperature and max temperature data of 21 synoptic stations across the Basin were applied from 1992 to 2015. The applied stations are operated by Islamic Republic of Iran Meteorological Organization (IRIMO) and are presented in text files by the IRIMO. In order to ensure a valid climate change analyses it is important to examine the accuracy of the applied data, so the climate variables of all the stations have been checked for any possible outliers in the time series. Despite the fact that the resolution of General Circulation Models (GCMs) has been significantly increased but they still cannot predict meteorological outputs for small scales. Therefore, some models have been created to downscale the GCMs output. LARS – WG is a model which is used to downscale the GCMs output. In this investigation the LARS – WG version 5.5 was utilized. This version includes different GCMs data and the BCM2 which is one the GCMs has also been included in the model. LARS – WG utilize separate semi-empirical distributions for each of variables including min, max temperatures and precipitation and this downscaling method has been used in several studies (Semenov et al., 1998; Qian et al., 2004; Babaeian and Kwon, 2005; Lawless and Semenov, 2005; Khan et al., 2006).
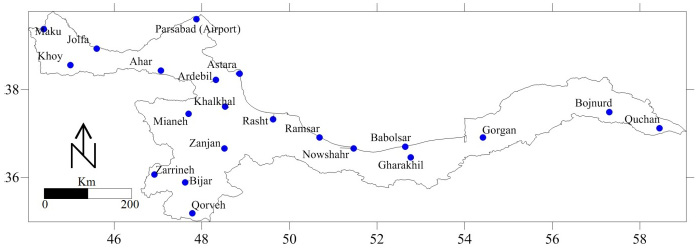 |
Figure 2: Location of the stations used in this study |
In the next step to prepare the data to run the model, the data of each station were transferred into the format of the LARS- WG weather generator. The observed daily max temperature, min temperature and precipitation series for 1992–2015 at 21 stations are used as inputs to the LARS- WG weather generator and then the weather series of the variables are generated for each site. Using the BCM2 general circulation model with emission scenario of SRA1B we simulated the climate variables of max temperature, min temperature and precipitation for the future period of 2046-2065 over the Basin. Then we computed the Basin wide average of min, max and precipitation for the observed period and also for the future period based on the obtained results from the model. Using the Surfer 12 software package, all the three climate variables were then interpolated over the Basin and mapped.
Results and Discussion
The calculated observed min temperature for the Basin indicates that the central parts of the Basin are the warmest areas compared to the other regions and in some parts the annual temperature is nearly 13 ºC, the west and east parts of the Basin are cold parts and in some areas in the north-west the min temperature falls below 0 ºC (Figure 3). The simulated annual min temperature indicates that compared to the based period there will be increase in temperature (Figure 4) and in all areas of the Basin min temperature will increase in various rates. The highest rate of increase is seen over the north-west parts of the Basin that are considered to be the cold and mountainous regions (Figure 5). In these regions the temperature increase is up to nearly 7 ºC but in central areas the increased temperature is less evident and it is generally less than 2 ºC.
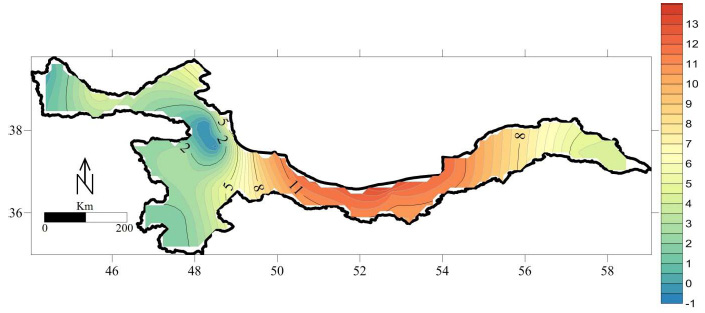 |
Figure 3: Map of observed min temperature (ºC) for the based period (1992-2015). |
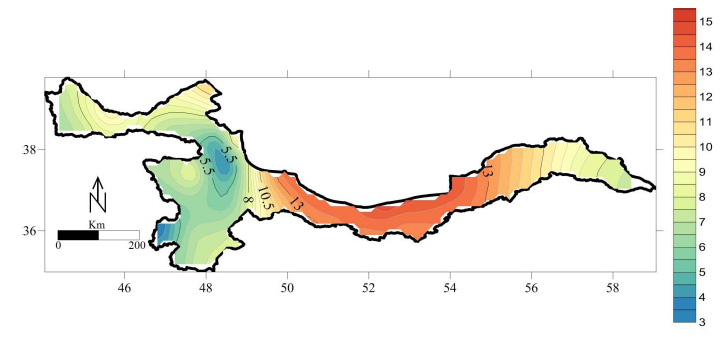 |
Figure 4: Map of simulated min temperature (ºC) for the future period (2046-2065). |
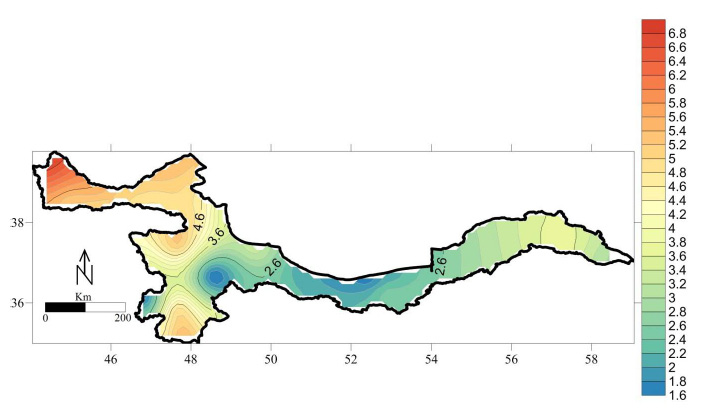 |
Figure 5: Map of difference of min temperature (future-base) |
For the observed period the max warmest temperatures in the Basin are generally seen over central to the east regions while the cooler max temperatures are over north-west of the Basin. The max temperature is below 15 ºC in the coolest parts but in the warm areas, the max temperature exceeds 21 ºC (Figure 6). In the future period the max temperature will increase for entire of the Basin (Figure 7) and the temperature in some areas will exceed 24 ºC. The map of difference of max temperature (future – base) indicates that north areas of the Basin from north-west to north-east will experience the highest rate of temperature increase, in these regions the temperature can possibly increase up to 4.5 ºC but this rate is far less evident in south-west of Basin, in these areas temperature increase is below 2 ºC in general (Figure 8). The overall rate of temperature increase for the entire of the Basin is 3.2 ºC.
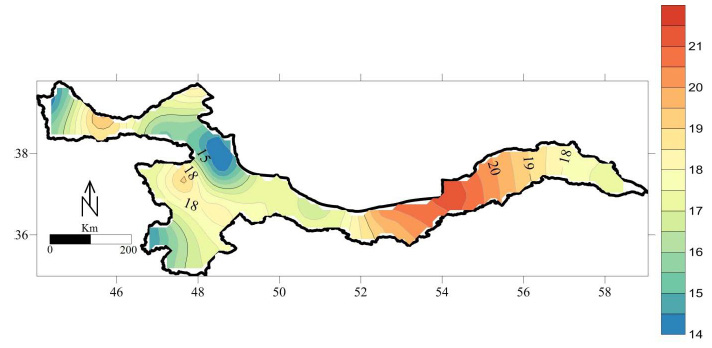 |
Figure 6: Map of observed max temperature (ºC) for the based period (1992-2015). |
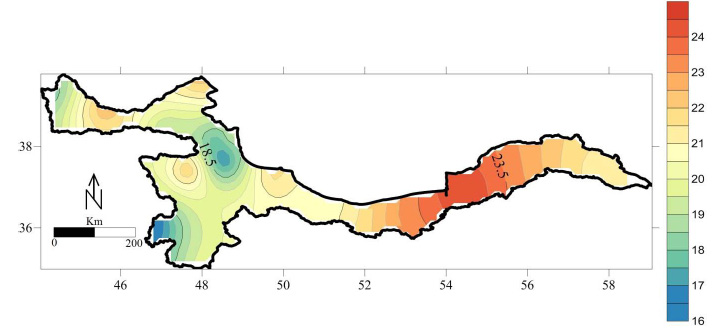 |
Figure 7: Map of simulated max temperature (ºC) for the future period (2046-2065). |
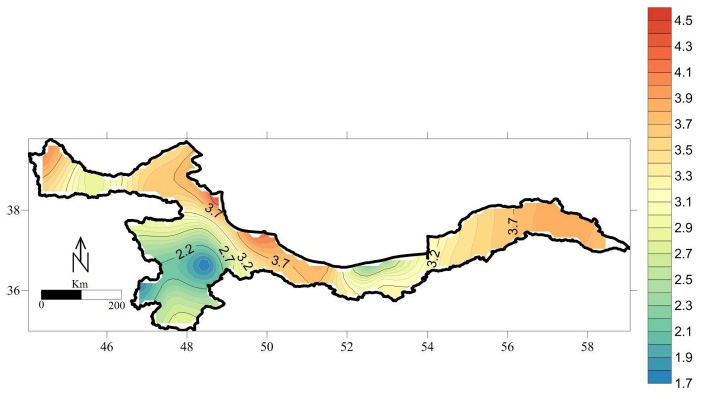 |
Figure 8: Map of difference of max temperature (future-base) |
Owing to the complex topography of the Basin, the amount of precipitation is also highly variable across the Basin, in the central north parts, the annual precipitation is very significant and it’s due to the proximity to Caspian Sea. In some parts the annual precipitation exceeds 1300 mm on average (Figure 9). The map of simulated precipitation for the future period indicates that many areas of the Basin will experience reduction in precipitation (Figure 10). The rate of decrease is various from region to region, the highest reduction is identifiable over central to the west parts with the average reduction of up to 140 mm while some areas from central to the east have an increase amount of precipitation compared to the base period with an increase of up to 40 mm (Figure 11). In general for the future period, the precipitation will decrease 37.1 mm in comparison to the base period.
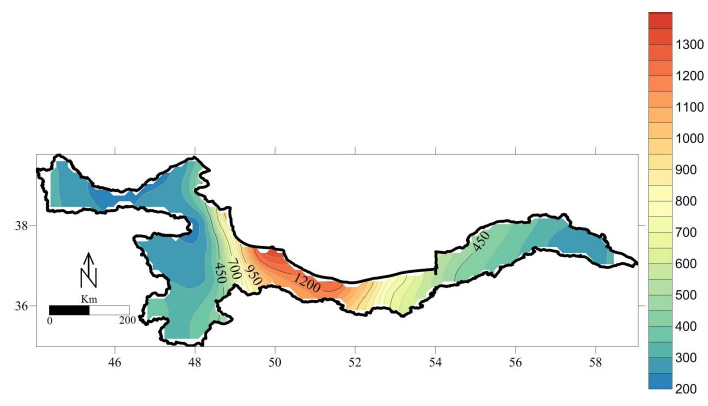 |
Figure 9: Map of observed precipitationfor the based period (1992-2015). |
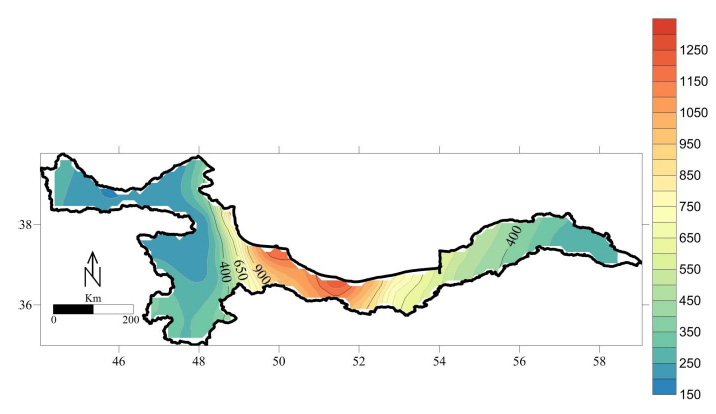 |
Figure 10: Map of simulated precipitation (mm) for the future period (2046-2065). |
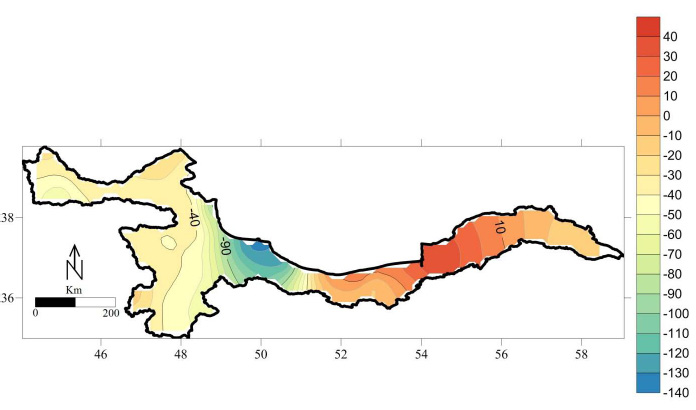 |
Figure 11: Map of difference of precipitation (future-base) |
Conclusion
In this investigation the climatic variables, including min, max temperature and precipitation were applied from 21 synoptic stations across the Khazar Basin and were then downscaled using LARS- WG weather generator for the future period (2046-2065). The findings of this study revealed that over the future period the min and max temperature will increase across the Basin and the rate of the increase is 3.8 and 3.2 ºC respectively. In some parts of the Basin in the north-west, the rate of increase for min temperature is up to 6.8 ºC while for max temperature it is up to 4.5 ºC. The analyses also showed that in general precipitation will decrease for the future period with the average amount of 37.1 mm, but there are some limited areas in the Basin which will experience a little increase for the precipitation. From the obtained results of this study it can be concluded that the Basin will be highly affected by climate change in the future which can have significant impacts on the ecosystem. Therefore serious adaptive steps must be taken to mitigate the adverse effects of climate change because the agriculture in this Basin is mostly rain fed and temperature increase along with precipitation decrease can deteriorate the climatic conditions considerably.
Funding
This study has been funded by Payam-e Noor University.
Conflict of Interests
None declared
References
- Abbaspour K.C., Faramarzi M., Ghasemi S.S., Yang H (2009). Assessing the impact of climate change on water resources in Iran. Water Resources Research, 45: 1-16.
- Alcamo J., Henrichs T., Rosch T. World water in 2025, global modeling and scenario analysis for the World Commission on Water for 21st century. Report A0002, Center for Environmental System Research, University of Kassel, Germany.
- Arnell, N. W., Gosling, S. N. (2016). The impacts of climate change on river flood risk at the global scale. Climatic Change, 134: 387-401.
- Babaeian I., Kwon W.T. (2005). Climate change assessment over Korea using stochastic daily data. Proceeding of the First Iran–Korea Joint Workshop on Climate Modelling, Nov. 2005. Climate Research Institute, Mashad, Iran.
- Gosain A.K., Rao S., Basuray, D .(2006). Climate change impact assessment on hydrology of Indian River basins. Current
Science, 90: 346–353. - IPCC, Summary for policymakers, in Climate Change 2013: The Physical Science Basis. Contribution of Working Group I to the Fifth Assessment Report of the Intergovernmental Panel on Climate Change, T. F. Stocker, D. Qin,G.-K. Plattner et al., Eds., pp. 3–29, Cambridge University Press, Cambridge, UK, 2013.
- Khan M.S., Coulibaly P., Dibike Y. (2006). Uncertainty analysis of statistical downscaling methods. Journal of Hydrology, 319, 357–382.
- Lawless C., Semenov M.A. (2005). Assessing lead-time for predicting wheat growth using a crop simulation model. Agricultural and Forest Meteorology, 135: 302–313.
- Lioubimtseva E., Henebry G.M. (2009) Climate and environmental change in arid Central Asia: impacts, vulnerability, and adaptations. Journal of Arid Environments 73: 2009, 963–977.
- Paparrizos, S., Maris, F., Matzarakis, A. (2016). Integrated analysis of present and future responses of precipitation over selected Greek areas with different climate conditions. Atmospheric Research, 169: 199-208.
- Pouliotte J., Smit B., Westerhoff L. (2009). Adaptation and development: livelihoods and
- climate change in Subarnabad, Bangladesh. Climate and Development, 1: 31–46.
- Qian B.D., Gameda S., Hayhoe H., De Jong R., Bootsma, A. (2004). Comparison of LARSWG and AAFC-WG stochastic weather generators for diverse Canadian climates. Climate Research 26: 175–191.
- Semenov M.A., Brooks R.J., Barrow E.M., Richardson, C.W. (1998). Comparison of the WGEN and LARS-WG stochastic weather
generators in diverse climates. Climate Research 10: 95–107. - Zhang, Y., You, Q., Chen, C., Ge, J. (2016). Impacts of climate change on stream flows under RCP scenarios: A case study in Xin River Basin, China. Atmospheric Research, 178: 521-534.

