1Jawaharlal Nehru Krishi Vishwa Vidyalaya, Jabalpur 482004, Madhya Pradesh, India
2ICAR-Indian Institute of Soil Science, Bhopal 462038, Madhya Pradesh, India
Corresponding author Email: abhishekkhandagle13@gmail.com
Article Publishing History
Received: 27/12/2018
Accepted After Revision: 23/03/2019
A field experiment was conducted under Long Term Fertilizer Experiment during 2016-17 at Research Farm, College of Agriculture, JNKVV, Jabalpur. The eight treatments were applied in comprising of different doses of fertilizers viz. 50% NPK, 100% NPK, 150% NPK, 100% NP, 100% N, 100% NPK+FYM, 100% NPK-S and Control, replicated four times in a randomized block design. The application of 100% NPK+FYM showed higher content of all the fractions of N viz. Total hydrolysable-N, Hydrolysable ammonical-N, inorganic–N, hexose amine & hydro.ammo.-N, hexose amine-N, amino acid- N, unidentified hydrolysable-N, non-hydrolysable-N and total N and lower content was recorded in treatment 50%NPK followed by 100% N. The result also revealed that the N fractions were significantly decreased with increasing depth of soil.
Long Term Fertilizer Addition, Assessment Of Soil Fertility, Nitrogen Fractions
Khandagle A, Dwivedi B. S, Aher S. B, Dwivedi A. K, Yashona D. S, Mohbe S, Panwar. S. Distribution of Nitrogen Fractions Under Long Term Fertilizer and Manure Application in A Vertisol. Biosc.Biotech.Res.Comm. 2019;12 (1).
Khandagle A, Dwivedi B. S, Aher S. B, Dwivedi A. K, Yashona D. S, Mohbe S, Panwar. S. Distribution of Nitrogen Fractions Under Long Term Fertilizer and Manure Application in A Vertisol. Biosc.Biotech.Res.Comm. 2019;12(1). Available from: https://bit.ly/2JSEsER
Copyright © Khandagle et al., This is an open access article distributed under the terms of the Creative Commons Attribution License (CC-BY) https://creativecommns.org/licenses/by/4.0/, which permits unrestricted use distribution and reproduction in any medium, provide the original author and source are credited.
Introduction
Nitrogen is the key element among the major nutrients and without N plant can neither complete a normal reproductive process nor reach its yield potential. It is a constituent of ADP and ATP to most substance in life process, thereby, N nutrient play key role in protein synthesis, oxidation reduction and energy transfer reaction of cell metabolism. It has been established that there are two major sources accounts for the availability viz. inherently from soil source and secondly supplementation through fertilizers and manures. Prolonged application of fertilizers and organic manures differentially influenced mineral N (NO3 –-N and NH4 +-N), organic N fractions, and total N in soils. Organic N fractions constituted about 94.2% of total N as compared with 5.8%
share of mineral N. Nitrate N was the dominant mineral N fraction in the soil, which was 4.4 times higher than NH4 +-N fractions. Application of fertilizers improved available N in soil. Hydrolyzable-N increased with the application of organic manures. Of the total hydrolyzable- N fractions in soils, ammonia-N was 25%, amino sugar-N 9.9%, amino acid-N 25.2%, and hydrolyzable unknown-N 39.8%. A signifi cant positive correlation was recorded between crop yield and N uptake. Amino acid-N and amino sugar-N explained 82.9% of the variation in rice yield and 73.4% of the variation in wheat yield. Integrated use of organic manures and inorganic fertilizers improved the N fractions in the soil, which should help increase rice and wheat production (Durani et al. 2016).
Mineralization of organic nitrogen fraction may play a major role in the N supply of plants. Nitrogen mineralization is of great importance because it converts organic N into NH4 + which is available for plant uptake and microbial processes, Mineralization of soil organic N must be taken in to account if N fertilizers are to be used effi ciently, Unfortunately, little progress has been made in identifying and measuring an easily mineralizable fraction, or dealing with year to year variability in net mineralization under fi eld conditions, which arises from the effects of temperature and moisture supply on N-cycle process Hence N-fertilizer recommendations have often been made on the basis of cropping or economics factor rather than soil testing (Mulvaney et al., 2001) However, N mineralization studies have largely been confi ned to the top soil, although plants also utilize N from deeper horizons. The topsoil has the largest contents of crop residues, easily decomposable organic matter, the greatest microbial biomass and activity, and therefore N Mineralization (Soudi et al., 1990). However, other studies have shown that a significant proportion of N mineralization occurs in sub soil (Patra et al., 1999).
Materials and Methods
Experimental site, climate and soil characteristics: Present investigation was conducted in an ongoing scheme All India Coordinated Research Project (AICRP) on Long Term Fertilizers Experiment (LTFE) of Indian Council of Agricultural Research (ICAR). The LTFE is laid out on a permanent site at the Experimental field Department of Soil Science and Agricultural Chemistry, Jawaharlal Nehru Krishi Vishwa Vidyalaya. Jabalpur (M.P.). The experimental site is situated in ‘Kymore Plateau and Satpura Hills’ agro climatic region of M.P. It falls on 23.9° N latitude and 79.6° E longitudes with an altitude of 411.8 m above the mean sea level. Jabalpur is situated in the semi-arid region having sub-tropical climate with hot dry summer, and cold winter. The average rainfall is about 1350 mm, which is mainly distributed from mid June to October. The maximum and minimum temperature ranges between 35.1°C and 5.3°C. The average annual relative humidity is 62%.
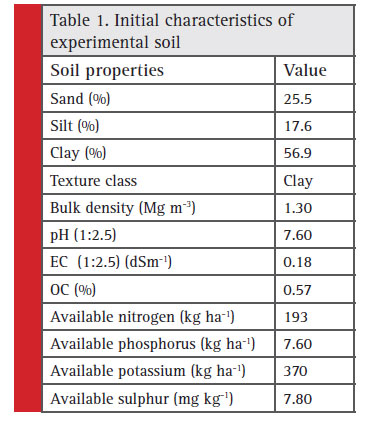 |
Table 1 : Initial characteristics of experimental soil |
The experiment was started with maize fodder as the first crop in summer season of 1972; since then Soybean (Kharif)-Wheat (Rabi)-Maize fodder (summer) crop rotation was adopted till 1994.However, since 1994 the cultivation of maize fodder was left and presently the cropping sequence being followed is soybean (Kharif) and wheat (Rabi). The soil of the experimental field is medium black belonging to Kheri series of fine montmorillonitic hyperthermic family of Typic Haplustert. At the beginning of this experiment in 1972, initial soil samples was collected before application of the treatments and analyzed for different soil properties (Table 1).
Treatments detail: The experiment has been in continuance since 1972 with 10 different treatments, however in present experiment following 8 set of treatments was selected. The selected treatments involve 50% NPK; 100% NPK; 150% NPK; 100% NP; 100% N; 100% NPK+FYM; 100% NPK-S and Control. The 100% optimal NPK doses based on initial (1972) soil test values were 120:80:40 and 20:80:20 (N:P2O5:K2O) for wheat and soybean respectively. Nitrogen was applied through urea, phosphorus through single super phosphate and potassium was applied through murate of potash. The farm yard manure in FYM treatment was applied @ 5 ton ha-1 year-1 to soybean crop only. Due to build of Zn content in soil. The application of Zn as ZnSO4@ 20 Kg ha-1 in alternate year to wheat crop was discontinued since, 1987.
Soil sampling and analysis : The representative soil samples were collected from two depths viz. 0-15 and 15-30 cm from each plot with the help of soil auger after 44 year of continuous cropping. The composite soil samples were prepared by quartering technique. The composite soil samples were air dried, crushed by wooden pestle and mortar then passed through 2 mm sieve and finally the processed samples were used for analysis of different physical and chemical properties.
The soil pH and electrical conductivity (EC) was measured by glass electrode pH meter and EC meter in 1:2.5 soil: water suspension (Piper, 1950). For determination of the soil organic carbon, a suitable quantity of the soil was digested with chromic acid and sulphuric acid. Excess of chromic acid left over unreduced by the organic matter of the soil was determined by a titration with Ferrous Ammonium Sulphate solution using diphenylamine indicator (Walkley and Black, 1934). Available nitrogen in soil sample was determined by using alkaline permanganate method (Subbiah and Asija, 1956) in which soil was mixed with excess of alkaline permanganate and distilled. Organic matter present in soils was oxidized by the nascent oxygen liberated by KMnO4 in the presence of NaOH and thus ammonia was released. The released ammonia was absorbed in the boric acid (2%) containing mixed indicator and converted to ammonium borate. The formed ammonium borate was back titrated with standard sulphuric acid. The soil available phosphorus content was estimated by extracting the soil with 0.5 M NaHCO3 (pH 8.5) and determination was done by ascorbic acid method on spectrophotometer (Olsen et al., 1954). The available potassium in soil was extracted by neutral 1N ammonium acetate and it was estimated using fl ame photometer (Muhr et al., 1963). Soil available sulphur was extracted with 0.15% solution of CaCl2 and determined by turbidimetric method (Chesin and Yien, 1951). The total nitrogen and various nitrogen fractions were determined by following standard methods (Table 2).
Statistical analysis: The data obtained was compiled and analyzed for its significance (p=0.05) by statistical procedure appropriate for randomized block design as outlined by Gomez and Gomez (1985).
Results and Discussion
Distribution of total nitrogen and nitrogen fractions: Total N
The total N content in soil (0-15 cm) increased successively from 1463 to 1621 and 1723 kg ha-1 as the dose of fertilizer increased from 50%, 100% and 150% NPK, respectively. The highest value of total N was 1818 kg ha-1 recorded with 100% NPK+FYM treatment. While, the lowest value of total N was observed in control (1306 kg ha-1). It is equal to sum of total hydrolysable-N and non-hydrolysable-N (Table 3). The total N content in soil decreased with depth. The highest total N content 1687 kg ha-1 in 15-30 cm soil depth was recorded in 100% NPK+FYM, whereas the lowest value was noticed as 1132 kg ha-1 in control followed by 50% NPK (1437 kg ha-1). Slightly higher value of total N content was noticed in 150% NPK (1572 kg ha-1) as compared to 100% NPK (Table 4).
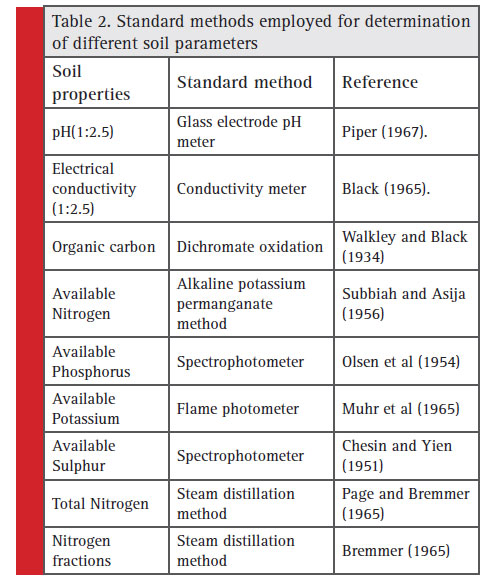 |
Table 2: Standard methods employed for determination of different soil parameters |
The total N content as influenced by various treatments indicated that higher values of N content was obtained from surface soil could be due to the presence of residues after the harvest of crop as suggested by Meints and Peterson, (1977). The total N in soils at various depths differed significantly by application of manure and fertilizer with respect soil depths. Interaction of treatment levels with soil depth was found to be significant on total N. These finding are in accordance with those of Aggarwal et at. (1990) and Singh and Singh (2007). It has also been noted that higher status of total N was obtained on the surface while it progressively declined with depth (Kushwaha, 2011). The increase in fertilizer application rate, the amount of total nitrogen was also found increased significantly. The present results are also in conformity with the findings of Babita (2010) and Nayak et al. (2013).
Inorganic N: The inorganic N content in soil (0-15 cm) increased successively from 141 to 152 and 173 kg ha-1 as the dose of fertilizer increased from 50%, 100% and 150% NPK, respectively. The lowest value of inorganic- N was observed in control (122 kg ha-1). While, the high-est value of inorganic-N 188 kg ha-1 was recorded with 100% NPK+FYM treatment (Table 3). The inorganic N content of soil decreased with soil depth (Table 4). Significantly higher value of inorganic-N content in 15-30 cm soil depth was noticed in 150% NPK (163 kg ha-1) as compared to 100% NPK (143 kg ha-1). The highest inorganic N content of 172 kg ha-1 was recorded in 100% NPK+FYM whereas the lowest value was noticed as 109 kg ha-1 in control followed by 50% NPK (130 kg ha-1). The inorganic N content was significantly influenced by various treatments due to addition of fertilizer doses suboptimal, optimal and super optimal, N content was correspondingly improved enrichment in Inorganic-N as a result of fertilizer application in these treatments in surface and subsurface soil positive effect of FYM (Kushwaha, 2011). Application of FYM also increased NH4 + – N and NO3 – N content in soil over the control throughout the incubation period and this was attributed to increase microbial population and N content (Duhan et al. 2005).
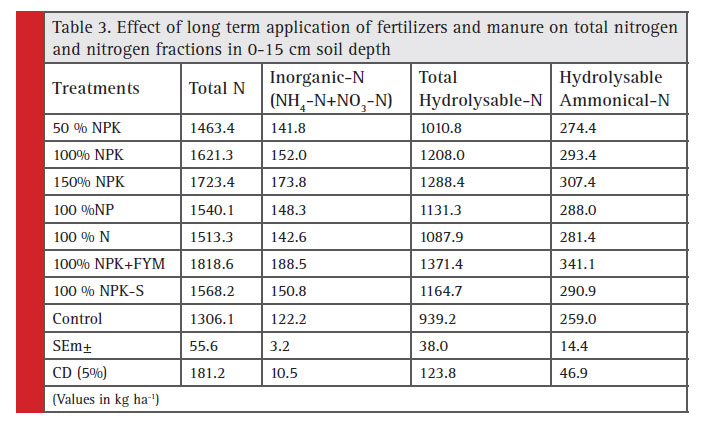 |
Table 3: Effect of long term application of fertilizers and manure on total nitrogen and nitrogen fractions in 0-15 cm soil depth |
Total hydrolysable N: The highest value of total hydrolysable- N in 0-15 cm soil depth was recorded with 100% NPK+FYM treatment (Table 3). While, the lowest value 939 kg ha-1 of total hydrolysable-N was noticed in control. Total hydrolysable-N content in soil increased successively from 1010 to 1208 and 1288 kg ha-1 as the dose of fertilizer increased from 50%, 100% and 150% NPK, respectively. The data presented in Table 4 showed that the total hydrolysable N content of soil decreased with soil depth. The highest total hydrolysable N content 1215 kg ha-1 was recorded in 100% NPK+FYM, whereas the lowest value was noticed as 712 kg ha-1 in control followed by 50% NPK (913 kg ha-1). Slightly higher value of total hydrolysable N content was obtained in 150% NPK (1132 kg ha-1) as compared to 100% NPK (1048 kg ha-1).
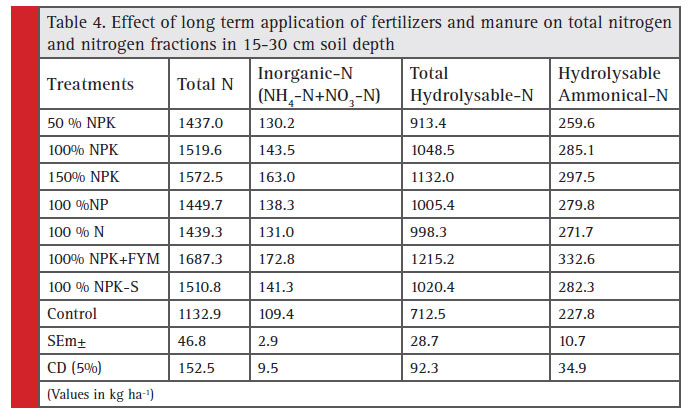 |
Table 4: Effect of long term application of fertilizers and manure on total nitrogen and nitrogen fractions in 15-30 cm soil depth |
It has been observed that higher status of total hydrolysable N was obtained on the surface while progressively decreased with depth but the rate of depletion was more apparent from surface to subsurface soil. This could be attributed to higher root biomass in the rhizospheric upper soil layer and which decreased with increasing soil depth. It supports the view that total hydrolysable N is more susceptible to mineralization than non-hydrolysable N (Rao and Ghosh, 1981; Reddy et al., 2003). The content of the total hydrolysable N were maximum in surface soil and thereafter decreased with the depth reported by Reddy et al. (2003), Kushwaha (2011) and Rai (2013).
Hydrolysable ammonical N: The Hydrolysable ammonical- N content in soil (0-15 cm) increased successively from 274 to 293 and 307 kg ha-1 as the dose of fertilizer increased from 50%, 100% and 150% NPK, respectively. The lowest value of hydrolysable ammonical-N was noticed in control 259 kg ha-1.While, the highest value of hydrolysable ammonical-N 341 kg ha-1 was recorded with 100% NPK+FYM treatment (Table 3). The hydrolysable ammonical N content of soil decreased with soil depth (Table 4). The higher value of hydrolysable ammonical-N content was noticed in 150% NPK (297 kg ha-1) as compared to 100% NPK (285 kg ha-1). Maximum hydrolysable ammonical-N content 332 kg ha-1 was recorded in 100% NPK+FYM, whereas the minimum value was noticed as 227 kg ha-1 in control followed by 50% NPK (259 kg ha-1). The highest hydrolysable ammonical N content was found with 100% NPK+FYM (341 kg ha-1), which could be due to organic matter build up which facilitates N accumulation in soil. Rai (2013) reported that hydrolysable ammonium N content was highest in the surface soil and decreased down the profile. Sub surface soil layer recorded 5% reduction in hydrolysable ammonical–N as compared to surface layer in all the treatment, the increase in hydrolysable ammonical–N in surface layer might be due to carry over effect of continuous use of organic residue (Sepehya et al., 2012).
Hexose amine and hydrolysable ammonical-N: The maximum value of hexose amine and hydrolysable ammonical-N 378 kg ha-1 in 0-15 cm soil depth was recorded with 100% NPK+FYM treatment (Table 5). While, the minimum value of hexose amine and hydrolysable ammonical-N 277 kg ha-1 was observed in control. Hexose amine and hydrolysable ammonical N content in soil increased successively from 297 to 323 and 341 kg ha-1 as the dose of fertilizer increased from 50%, 100% and 150% NPK, respectively. The highest hexose amine and hydrolysable ammonical-N content in 15-30 cm soil depth (366 kg ha-1) was recorded in 100% NPK+FYM, whereas the lowest value 240 kg ha-1 was noticed in control followed by 50% NPK (278 kg ha-1). Slightly higher value of hexose amine and hydrolysable ammonical-N content was recorded in 150% NPK (327 kg ha-1) as compared to 100% NPK (305 kg ha-1) (Table 6). The data showed that higher values of Hexose amine and hydrolysable ammonical-N content were recorded at surface soil as compare to sub surface soil which could be resulted due to FYM build up hydrolysable ammonical and hexose amine and chemical fertilizers may enhance hexose amine + hydrolysable ammonical- N content in soil (Broabdent 1965). Similar results have been reported by Kushwaha (2011).
Hexose amine-N: Hexose amine-N content in soil (0-15 cm) increased successively from 23.0 to 29.6 and 34.5 kg ha-1 as the dose of fertilizer increased from 50%, 100% and 150% NPK, respectively. The highest value of hexose amine-N 37.2 kg ha-1 was recorded with 100%
NPK+FYM treatment. While, the lowest value of hexose amine-N was observed in control 18.2 kg ha-1 (Table 5). The data in Table 6 showed that the hexose amine N content of soil decreased with soil depth. Slightly higher value of hexose amine-N content (15-30 cm) was obtained in 150% NPK (29.5 kg ha-1) than 100% NPK (20.0 kg ha-1). The maximum hexose amine N content 32.7 kg ha-1 was recorded in 100% NPK+FYM, whereas minimum value was noticed as 13.0 kg ha-1 in control followed by 50% NPK (18.4 kg ha-1). The continuous addition of nitrogen through organic and inorganic sources contributed directly to the enrichment of this pool of organic nitrogen, similar build up in this fraction under same set of agro climatic condition has been reported by Kumar (2003) and Kushwaha (2011). Similar results have also been reported by Swapana et al. (2012).
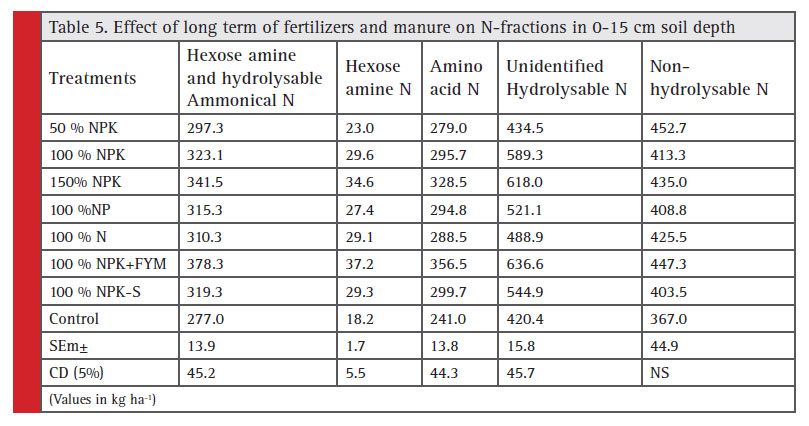 |
Table 5: Effect of long term of fertilizers and manure on N-fractions in 0-15 cm soil depth |
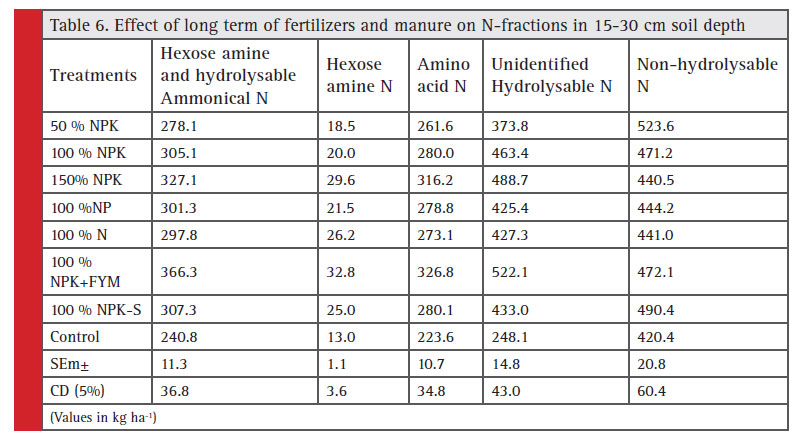 |
Table 6: Effect of long term of fertilizers and manure on N-fractions in 15-30 cm soil depth |
Amino acid-N: Amino acid-N content in soil (0-15 cm) increased successively from 279 to 295 and 328 kg ha-1 as the dose of fertilizer increased from 50%, 100% and 150% NPK, respectively. The minimum value of amino acid-N was observed in control 241 kg ha-1. While, the maximum value of amino acid-N 356 kg ha-1 was recorded with 100% NPK+FYM treatment (Table 5). The highest amino acid-N content (15-30 cm soil depth) of 326 kg ha-1 was recorded in 100% NPK+FYM, whereas the lowest value was noticed as 223 kg ha-1 in control followed by 50% NPK (261 kg ha-1). Non-significantly higher value of amino acid-N content was obtained in 150% NPK (316 kg ha-1) than 100% NPK (Table 6).
The content of the amino acid N was maximum in surface soil and thereafter decreased with the depth reported by Reddy et al. (2003), Sammy et al. (2003) and Sepehya et al (2012). However, due to addition of fertilizer doses suboptimal, optimal and super optimal, Amino acid N content was correspondingly improved indicating an impact of fertilizer application on enrichment of N pools (Keeney and Bremner 1964). The small decrease in amino acid-N fraction as compared to Hexose amine N and Hydrolysable ammonica-N in control plot could be due to inclusion of legume crop (soybean) in the rotation which has been found to promote the buildup of amino acid-N (Stevension, 1956).
Unidentified hydrolysable-N: Unidentified hydrolysable- N content in 0-15 cm soil increased successively from 434 to 589 and 617 kg ha-1 as the dose of fertilizer increased from 50%, 100% and 150% NPK, respectively. The value of unidentified hydrolysable-N was slightly higher in 100% NP than 100% N. The highest value of unidentified hydrolysable-N 636 kg ha-1 was recorded with 100% NPK+FYM treatment. While, the lowest value of unidentified hydrolysable-N was observed in control 421 kg ha-1 (Table 5). The data further showed that the unidentified hydrolysable-N content of soil (15-30 cm) decreased with soil depth (Table 6). Higher value of unidentified hydrolysable-N content was observed in 150% NPK (489 kg ha-1) as compared to 100% NPK (463 kg ha-1). The highest unidentified hydrolysable-N content 522 kg ha-1 was recorded in 100%NPK+FYM, whereas the lowest value was noticed as 216 kg ha-1 in control followed by 50% NPK (373 kg ha-1).
The higher value of unidentified hydrolysable-N content was obtained from surface soil compare to sub surface soil. Highest Unidentified hydrolysable N content was registered with 100% NPK+FYM (636 kg ha-1). Further lower content was found in control (421 kg ha-1) attributed due to no fertilizers application which directly or indirectly affected normal biological activi-ties Rao and Ghosh, (1981). The treatment wise pattern
was almost same as that was observed in case of surface soil. Positive effect on build up of unidentified-N fraction with the application of organic along with chemical fertilizers might be attributed to the movement of applied nitrogen from upper layer been reported Sepehya et al. (2012). It has also been noted that higher status of Unidentified hydrolysable N was obtained on the surface while progressively declined with depth but the rate of depletion was more apparent from surface to subsurface soil while, it was stabilized below 30 cm. Thus, it could be attributed to higher root biomass in the rhizospheric upper soil layer and which declined with increasing soil depth (Kushwaha, 2011).
Non-hydrolysable-N: Non-hydrolysable-N content in 0-15 cm soil depth varied from 452, 414 and 436 kg ha-1 as levels of fertilizer increased from 50%, 100% and 150% NPK, respectively (Table 5). The maximum value of non-hydrolysable N 458 kg ha-1 was recorded with 100% NPK+FYM treatment. While, the lowest value of non- hydrolysable-N was observed control 366 kg ha-1. Similarly, the highest non-hydrolysable N content (15-30 cm soil depth) of 524 kg ha-1 was recorded with 50% NPK, whereas the lowest value was noticed as 420 kg ha-1 in control followed by 100% NP (428 kg ha-1) (Table 6).
The data indicated lower values of Non-hydrolysable- N content in surface soil. The addition of fertilizer doses suboptimal, optimal and super optimal did not showed any significant improvement in N-pool. The application of fertilizers N even up to its highest level did not show any improvement in non hydrolysable N content in soil. Further, it has also been noted that lower status of Nonhydrolysable N was obtained on the surface while progressively increased with depth. The similar results have been reported by Reddy et al. (2003) and Kushwaha (2011).
Conclusion
The results from Long Term Fertilizer Experiment revealed that the application of 100% NPK+FYM showed higher content of studied N-fractions viz. Total hydrolysable-N, Hydrolysable ammonical-N, inorganic–N, hexose amine & hydro.ammo.-N, hexose amine-N, amino acid-N, unidentified hydrolysable-N, non-hydrolysable-N and total N, whereas lower content was recorded in treatment 50%NPK followed by 100% N. The result also revealed that the N fractions were significantly decreased with increasing depth of soil.
References
Aggarwal, R. K., Kumar, P. and Sharma, B. K. 1990. Distribution of nitrogen in some arid soils. J. Indian Soc. Soil Sci., 38: 430-433.
Babita B. 2013. Dynamics of organic and inorganic fractions of nitrogen in an acid alfi sol after long-term addition of chemical fertilizers and amendments in maize-wheat cropping system. International Journal of Agricultural Science and Research, 3(3): 179-184.
Black, C. A., 1965, Methods of Soil Analysis – Part II, Agronomy Monograph, American Society of Agronomy Madison, Wisconsin, USA.
Bremner J.M. (1965a). Total nitrogen. In ‘Methods of Soil Analysis, Part 2, (Ed CA Black) Am. Soc. Agron Madison, WI pp. 1149-1178.
Bremner JM. 1965b. Organic forms of nitrogen. In ‘Methods of Soil Analysis, Part 2 (Ed CA Black) Am. Soc. Agron. Madison, WI pp. 1238-1255.
Broadbent FE. 1965. Effect of fertilizer nitrogen on the release of soil nitrogen. Soil Sc. Soc. Am. Proc. 29: 692-696.
Chesin, L. and C. H. Yien, 1951. Turbidmetric determination of available sulphur in soil. Soil. Sci. Soc. Am. Proc. 15: 149-157.
Duhan BS, Katarai D, Singh JP, Kuhad MS and Dahiya SS. 2005. Effect of nitrogen, FYM and metribuzin on nitrogen transformation. J. Indian Soc. Soil Sci., 53(2): 184-187.
Durani A, Brar BS and Dheri GS. 2016. Soil Nitrogen Fractions in Relation to Rice-Wheat Productivity: Effects of Long-Term Application of Mineral Fertilizers and Organic Manures. Journal of Crop Improvement, 30 (4): 399–420.
Gomez, K. A. and A. Gomez, 1984. Statistical Procedures for Agricultural Research (2nd edition), John Willey and Sons, New York, 1-680.
Keeney DR and Bremner JM. 1964. Effect of cultivation on the nitrogen distribution in soils. Proc., Soil Sci. Soc. Am. J. 28:653-656.
Kumar V. 2003. Integrated effect of chemical fertilizers and green manure on forms of nitrogen and their availability under rice-wheat cropping system in Calciorthents. Journal of the Indian Society of Soil Science 51:561-564.
Kushwaha satybhan. 2011. Effect of long term application of fertilizers and manure on nitrogen fractions in a Vertisol. M.Sc. thesis JNKVV, Jabalpur. Muhr, G. R., N. P. Datta, H. S. Subrsmany, V. K. Leley and R. L. Dunahue, 1965. Soil testing in India. Asia Press, New Delhi.
Mulvaney, R.L. , S.A. Khan, R.G.Hoeft, and H.M. Brown 2001. A soil organic nitrogen fraction that reduce the need for nitrogen fertilization. Soil Science Society of American Journals 65:1164-1172
Nayak VN, Gatav GK and Bhagat RK. 2013. Different N fractions and their relationship with available Nitrogen, yield and nutrient uptake in saffl ower, (Carthanmus tinctoroius) in vertisol. Current Advances in Agriculture Science 5(1): 135-137
Olsen, S. R., C. V. Cole, F. S. Watanbe and L. A. Dean, 1954. Estimation of available phosphorus in soils by extraction with sodium bicarbonate. USDA circ. 939: 19-33.
Patra A, Jarvis SC and Hatch DJ. 1999. Nitrogen mineralization in soil layers, soil particles and macro-organic matter under grassland. Bio. Fertil. Soils 29: 38-45.
Piper, C. S. 1966. Soil and Plant Analysis. Hans Publisher, Bombay. 85-102.
Rai Suraj Kumar 2013. Influence of long term use of fertilizers and manure on nitrogen dynamics in a Vertisol in wheat under rice-wheat cropping system. Msc. Thesis IGKVV, Raipur
Rao SA and Ghosh AB. 1981. Effect of continuous cropping and fertilizer use on the organic nitrogen fractions in a Typic Ustochepret Soil. Plant and Soil, 62:377-383.
Reddy SK, Singh M, Tripathi AK. Singh MV and Saha MN. 2003. Changes in amount of organic and inorganic fractions of nitrogen in an Eutrochrept soil after long-term cropping with different fertilizer and organic manure inputs. J. Plant Nutri. Soil Sci. 166: 232-¬238.
Sepehya S and Subehia SK 2012, Nitrogen dynamic as influenced by long- term fertilization and amendments under rice – wheat system in a north- western Himalaya soil. Depatment of Soil Science CSK Himalaya Pradesh Krishi Vishvavidyalaya, Palampur
Singh, K. K., and Singh, R. 2007. Distribution of nitrogen and sulphur forms in profiles of mid-western Utter Pradesh. J. Indian Soc. Soil Sci., 55 (4): 476-480
Soudi BA, Sbai and Chiang CN. 1990. Nitrogen mineralization in semi arid soils of Morocco: rate constant variation with depth. Soil Sci. Soc. Am. J. 54: 756-761.
Stevenson FJ. 1956. Effect of some long time rotations of the amino acid composition of the soil. Proc, Soil Sci. Soc. Am. J. 20: 204-208.
Subbiah, B. V. and G. L. Asija, 1956. A rapid procedure for estimation of available nitrogen in soils. Curr. Sci. 25: 259-260.
Swapana S. and Subehia SK. 2012. Nitrogen dynamic as influenced by long term fertilization and amendments under rice wheat system in a North- western Himalayan soil. CSK Himachal Pradesh Krishi Vishvavidyalaya, Palampur – 176062 (H.P.),India
Swapana S. and Subehia SK. 2012. Nitrogen dynamic as influenced by long term fertilization and amendments under rice wheat system in a North- western Himalayan soil. CSK Himachal Pradesh Krishi Vishvavidyalaya, Palampur – 176062(H.P.), India
Walkley, I. A. and C. A. Black, 1934. An examination of the Degtozeff methods for determining the soil organic matter and nitrogen in the soil and a proposed modification of the chromic acid titration method. Soil Sci. 37: 29-38.

