Muhammad Attar*![]()
Applied College, Natural Sciences and Engineering Department,
University of Jeddah, Jeddah, Kingdom of Saudi Arabia
Corresponding author email: mtattar@uj.edu.sa
Article Publishing History
Received: 15/01/2022
Accepted After Revision: 25/03/2022
Healthcare quality is driven by multiple dimensions. The present study aimed to examine the main dimensions of healthcare quality from the perspective of patients in the Kingdom of Saudi Arabia public (KSA) hospitals. A patient satisfaction survey was designed to discover the perceived dimensions of quality in the KSA healthcare sector. The steps involved in identifying the quality dimensions relating to healthcare are presented in the paper. The principal component analysis (PCA) lead to identifying the components with total variance explained and result in identifying three meta dimensions. This included wellness support, compliance with Standard, and exceptional service and immediate care. The research findings have provided a platform for emerging and discovering patient needs, direct improvement efforts in such a critical service sector and can be used as a basis for developing new measures to discover patients’ needs.
Healthcare Quality Dimensions, Principal Component Analysis (Pca), Patient Needs.
Attar M. Dimensions of Quality in Healthcare: Perceptions of Patients from Saudi Public Hospitals. Biosc.Biotech.Res.Comm. 2022;15(1).
Attar M. Dimensions of Quality in Healthcare: Perceptions of Patients from Saudi Public Hospitals. Biosc.Biotech.Res.Comm. 2022;15(1). Available from: <a href=”https://bit.ly/3CQbTk7“>https://bit.ly/3CQbTk7</a>
Copyright © This is an Open Access Article distributed under the Terms of the Creative Commons Attribution License (CC-BY). https://creativecommons.org/licenses/by/4.0/, which permits unrestricted use distribution and reproduction in any medium, provided the original author and sources are credited.
INTRODUCTION
The healthcare industry has a significant importance in the global economy. This is because of its critical role in maintaining the health of people and providing high-quality healthcare services. Most countries provide a large expenditure on the health sector to maintain the health of people. For instance, Fuchs (1998) pointed out that in 1997, the US spent around 8% of its GDP on healthcare. Moreover, Estes et al. (2013) expected that by 2020, the expenditures on healthcare will reach 20% of the US national GDP. The UK increased the expenditure on the health system as a percentage of GDP from 5.9% in 1981 to 9.6% in 2017 (OECD 2020). Indeed, the COVID-19 pandemic resulted in enormous changes in health care delivery systems and has a major impact on the global economy. Various governments went through major health investments for maintaining the health of people (Faruk et al. 2021).
The Ministry of Health (MoH) in the Kingdom of Saudi Arabia (KSA) is responsible for providing healthcare services and managing the healthcare sector through health directories across the kingdom (AlYami and Watson 2014). Additionally, military hospitals are controlled and supported by the Ministry of Defense and Aviation controls (Mufti 2000; MoH 2002; Faruk et al. 2021). The healthcare sector has been given a top priority in Saudi Arabia’s Vision (2030). The vision aims to improve the quality of life across the Kingdom in several fields including the health of people. To respond to the patient needs, MoH has made an extensive effort to improve the healthcare system, develop the infrastructure of hospitals’ facilities, and provide affordable medical services to patients.
It also has contributed positively to improving healthcare services and satisfying patient needs by adopting the most advanced technology applications based on a world-class standard. The efforts have been made to achieve a high level of healthcare quality. However, this did not result in improving the medical services provided to the patients (Ishfaq et al. 2016). The healthcare sector in KSA developed greatly over the past years with increasing demand for healthcare services. In (1970), the total number of populations in the KSA was 5.8 million and increased to 34.2 million by 2019. The total number of beds were increased from around 9000 to 77000 while the total number of hospitals was shifted from 74 to 498 (MoH 2019; Faruk et al. 2021).
To improve performance in the delivery of healthcare services in the KSA, there is a need for assessing, and improving productivity in hospitals (Al-Hanawi and Makuta 2022). The healthcare system includes several dimensions that are rapidly changing over years. Thus, identifying the main dimensions of quality in healthcare is necessary to improve the medical services provided to the patients. Patients as the main stakeholder in the healthcare system have significant importance when assessing healthcare quality (Potts et al. 1984; Bensing 1991). Patient-Centered Outcomes Research Institute (PCORI) (2014) identified the healthcare stakeholders which are patients, clinicians. researcher, purchasers, hospitals/health systems, policymakers, payers, industry, and training institutions (Faruk et al. 2021). Many studies showed that patient perceptions of healthcare service quality are important and should be prioritized when evaluating the healthcare system (Gabel et al. 2003; Iversen et al. 2012).
Specifically, studies in the field of patient satisfaction related to healthcare services in KSA have only focused on measuring efficiency levels among public hospitals (Alatawi, Niessen and Khan 2020; Faruk et al. 2021). Therefore, the aim of this study was to identify the main healthcare quality dimensions in KSA public hospitals based on patients’ perceptions. In order to achieve this aim, the current study utilized the principal component analysis (PCA) to explore the relative contribution of each quality dimension in healthcare as perceived by patients. These perceptions can be expected to be considered for improving patient perception and satisfaction in KSA public hospitals.
MATERIAL AND METHODS
The current study examined the main dimensions of healthcare quality from the perspective of patients in KSA public hospitals. The survey questionnaire instrument was constructed and included closed-ended questions rated on a five-point Likert-type scale. It contained demographic characteristics about the patients such as nationality, marital status, sex, age, and education level.
The Software Statistical Package for Social Sciences (SPSS) 20.0 was used to analyze the data. The principal component analysis (PCA) was utilized to explore the main dimensions of healthcare service quality in KSA public hospitals. PCA is a multivariate statistical method used for reducing the dimensions or components of the dataset into a small number to find out the internal uncorrelated variables (Hair et al. 2010). Four faculty members and two medical staff from different public hospitals evaluated the survey questions. They participated in a focus group meeting to clarify the survey questions and their relation to the main research objective. The discussion outcomes resulted in the selection of 36 out of 62 questions.
A pilot study was conducted with 29 undergraduate students who visited the medical center of the university to ensure the clarity and readability of the questioner’s items. The 36 statements included in the survey questionnaire revealed a high level of clarity and the average time required for completing the questionnaire was less than five minutes. The sampling plan criteria included five public hospitals located in Jeddah city. These hospitals were convenient and mostly visited by patients from different cities located in the western region of KSA. The results presented in this study were based on descriptive statistics and multivariate statistics methods.
RESULTS AND DISCUSSION
Healthcare quality has been receiving much concern from researchers and several studies have been conducted. This is because of difficulties in defining the quality of healthcare service from only the patients’ point of view who use the service. According to Panchapakesan et al. (2009) improving quality in healthcare can be achieved by recognizing the perceptions of stakeholders. as it involved many stakeholders with different views and interests. The Institute of Medicine (IOM) (1990) in the US described quality in healthcare as “the degree to which health services for individuals and populations increase the likelihood of desired health outcomes and are consistent with current professional knowledge” (Institute of Medicine 1990; Panchapakesan et al. 2009; Faruk et al. 2021).
Previous studies showed that there is no generic model or instrument developed to measure patients’ perceptions of quality dimensions in healthcare. Several organizations have identified quality dimensions in healthcare with different quality constructs (Faruk et al. 2021). In (2001), the IOM identified six healthcare quality dimensions, which are effectiveness, safety, responsiveness, timeliness, efficiency, and equity. These dimensions have been used as a tool for quality assessment and measurement of the healthcare system. According to Leatherman and Sutherland (2003) the most common health quality dimensions used in the USA, Canada, and the Organization for Economic Co-operation and Development (OECD) countries are access, effectiveness, communication, and safety.
The OECD (2006) proposed three main dimensions of healthcare quality effectiveness, safety, and responsiveness. The WHO (2006) proposed the following quality dimensions in healthcare effectiveness, safety, acceptability, responsiveness, efficiency, access, and equity. In (2018), WHO used the same IOM dimensions and added the integration dimensions, which formed the overall health quality dimensions. The Institute for Healthcare Improvement (IHI) (2007) in the USA proposed the framework that included three main dimensions: the individual experience, the populations’ health, and the per capita costs of care. The European Commission (EC) (2014) identified six dimensions of healthcare namely, effectiveness, safety, responsiveness, efficiency, and equity (Faruk et al. 2021).
The Australian Health Performance Framework (AHPF) (2019) is a tool used to measure the performance of health care in Australia based on nine dimensions effective, appropriate, efficient, responsiveness, accessible, safe, continuous, capable, and sustainability. Table 1 shows the healthcare organizations and quality constructs.
Table 1. Healthcare organizations and quality constructs
| Health Organization | Abbreviation | Location | Year | Quality Constructs | |
| The Institute of Medicine | IOM | USA | 2001 | effectiveness, safety, responsiveness, timeliness, efficiency, and equity.
|
|
| Organization for Economic Co-operation and Development
|
OECD | France | 2006 | effectiveness, safety, and responsiveness. | |
| The Institute for Healthcare Improvement | IHI | USA | 2007 | individual experience, populations health, and per capita costs of care
|
|
| European Commission | EC
|
Belgium | 2014 | effectiveness, safety, responsiveness, efficiency, and equity.
|
|
| The World Health Organization | WHO | Switzerland | 2018 | effectiveness, safety, responsiveness, timeliness, integration, efficiency, and equity
|
|
| The Australian Health Performance Framework | AHPF | Australia | 2019 | effective, appropriate, efficient, responsiveness, accessible, safe, continuous, capable, and sustainability. | |
A total of 672 respondents participated in this study. Out of collected questionnaires, 102 were excluded because of missing data. This results in (84.8 percent) response rate. The first part of the questionnaire included general information about the patients. This information is shown in table 2.
Table 2. General information of the respondents
| Description | Frequency | (%) |
| Nationality | ||
| Saudi | 471 | 79 |
| Non-Saudi | 99 | 21 |
| Marital Status | ||
| Single | 393 | 68.9 |
| Married | 177 | 31.1 |
| Sex | ||
| Male | 354 | 62.1 |
| Female | 216 | 37.9 |
| Age | ||
| 18-25 | 313 | 54.9 |
| 26-35 | 139 | 24.4 |
| 36-50 | 85 | 14.9 |
| >50 | 33 | 5.8 |
| Education Level | ||
| High School | 124 | 21.8 |
| Bachelor | 272 | 47.7 |
| Master | 98 | 17.2 |
| PhD | 76 | 13.3 |
| Visiting Frequency | ||
| Weekly | 86 | 15.1 |
| Monthly | 118 | 20.7 |
| Every 6 month | 207 | 36.3 |
| Yearly | 159 | 27.9 |
As shown in the above table (79 percent of patients) were Saudi and (21 percent) were non-Saudi. Moreover, (68.9 percent) of the respondents were single and (31.1 percent) were married. Most of the participated patients were male (62.1 percent) whereases (37.9 percent) were female. More than half of the respondents were younger than 35 years and most of them belonged to the college degree category. The demographic information indicated that patients used to visits public hospitals every 6 months.
The quality dimensions that considered in this study were derived from Gronroos (1988), Garvin (1984), and Parasuraman et al. (1985), and IOM (2001). The healthcare quality dimensions with its definitions are listed in Table 3.
Table 3. Healthcare quality dimensions
| Construct | Definition |
| Reliability | The service provided is consistent and serves the patient right every time |
| Responsiveness | Readiness and response to patients need immediately |
| Competence | Obtain the skills needed and knowledge to perform the service. |
| Access | The healthcare services are easy to reach and access |
| Courtesy | The healthcare staff are polite, respectful, and friendly to patients |
| Communication | Patients can communicate with all medical staff members |
| Credibility | The trustworthiness, and honesty of all medical staff members |
| Security | The healthcare services are free from error, danger, and risk |
| Understanding | Recognize and understand patients’ needs. |
| Tangibles | The physical components of healthcare services |
| Features | The supplementary characteristics of healthcare services |
| Conformance | The healthcare provider follows the healthcare standards, and procedures. |
| Recovery | The healthcare provider takes immediate action and solves any issues that could be occurred |
The second part of the survey questionnaire instrument contained 36 statements and constructed based on 13 dimensions. The reliability of the questionnaire scales was assessed using Cronbach alpha to ensure the trustworthiness of the answers gathered from the patients. According to Hair et al. (2010), the acceptable Cronbach’s alpha is greater than 0.7 and reveals a high level of internal consistency. The Cronbach’s alpha, mean, and standard deviation for 36 items were calculated and presented in Table 4. All identified dimensions have coefficients higher than 0.7 and the total reliability was 0.81, indicating high overall reliability (Hair et al. 2010: Faruk et al. 2021).
Table 4. The healthcare quality dimensions and Cronbach alpha values
| Health Care Quality Dimensions | Code | Item | Cronbach Alpha | Mean | SD |
| Access | Access1 | The hospital location is easy to reach | 0.899 | 2.78 | 1.27 |
| Access2 | The hospital operational systems are working properly | ||||
| Access3 | Easily accessible by telephone and website | ||||
| Access4 | I can make an appointment and receive healthcare services | ||||
| Reliability | Reliabi1 | Provides medical services as promised | 0.852 | 2.77 | 1.24 |
| Reliabi2 | Committed to providing medical services on time | ||||
| Reliabi3 | The medical services provided are trusted | ||||
| Communication | Commu1 | The staff spoke using clear language | 0.867 | 2.21 | 1.65 |
| Commu2 | The doctor provides a clear explanation about the medications | ||||
| Commu3 | The hospital sent me an appointment reminder by text message | ||||
| Competence | Compet1 | The staff are experienced and efficient | 0.830 | 2.75 | 1.26 |
| Compet2 | The doctors have high skills and knowledge | ||||
| Compet3 | The nurses cooperate effectively with patients | ||||
| Security | Secur1 | The hospital has several security men | 0.710 | 2.69 | 1.26 |
| Secur2 | Patient personal information is secured | ||||
| Secur3 | The hospital is equipped with surveillance cameras | ||||
| Facility | Facility1 | Modern tools and equipment’s are used to provide the service | 0.950 | 2.73 | 1.22 |
| Facility2 | Good atmosphere and decoration | ||||
| Facility3 | The hospital placed directions signs | ||||
| Responsiveness | Resp1 | The medical services provided over 24 hours | 0.932 | 2.77 | 1.25 |
| Resp2 | Staff respond immediately to patients’ complaints | ||||
| Resp3 | Staff inform patients of scheduled appointments | ||||
| Courtesy | Court1 | Staff are friendly, polite, and respectful | 0.627 | 2.73 | 1.26 |
| Court2 | The clean and neat appearance of staff | ||||
| Court3 | Good understanding of the patient’s needs | ||||
| Feature | Feature1 | The hospital provides free water bottles | 0.910 | 2.84 | 1.31 |
| Feature2 | The hospital provides free WIFI internet | ||||
| Feature3 | The hospital has a mobile application or website for scheduling an appointment | ||||
| Conformance | Conform1 | The time required to see the doctor is acceptable | 0.770 | 2.80 | 1.26 |
| Conform2 | The doctor prescribed the medication according to the patient’s age. | ||||
| Conform3 | The patient medical report does not include any mistakes | ||||
| Understanding | Understand1 | The hospital medical staff made an effort to understand my needs. | 0.611 | 2.61 | 1.54 |
| Understand2 | The doctor described the right medicine | ||||
| Understand3 | The medical staff assign the right doctor to me | ||||
| Credibility | Cred1 | The hospital name and its reputation are trusted | 0.701 | 2.70 | 1.25 |
| Cred2 | The medical results are accurate | ||||
| Cred3 | The patient has confidence in doctor qualifications. | ||||
| Recovery | Recov1 | The hospital staff take immediate action in case of emergency | 0.880 | 2.73 | 1.23 |
| Recov2 | The doctor informs the patient about the required medicine dosages. | ||||
| Recov3 | The doctor provides alternative recovery plans. |
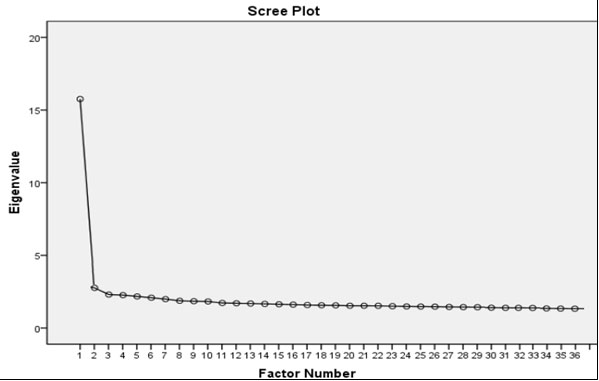
In order to know the numbers of components to consider, a scree plot was used where stress values are plotted versus the number of dimensions. As illustrated in Figure 1 the scree plot represented three actors. Therefore, all components with an eigenvalue greater than one were considered.
Figure 1: Scree plot for the survey items
The overall significance of the correlation matrix is zero, the approximate chi-square value was 7285.981, and the Kaiser-Meyer-Olkin (KMO) was 0.920. According to Kaiser (1974) the KMO value greater than 0.6 indicates the sampling adequacy and the factor analysis performed is appropriate. The Components with total variance are shown in Table 5.
Table 5. Components with total variance explained
| Component
|
Initial Eigenvalues | Extraction Sums of Squared Loadings | Rotation Sums of Squared Loadings | ||||||
| Total | % of Variance | Cumulative % | Total | % of Variance | Cumulative % | Total | % of Variance | Cumulative % | |
| 1 | 1.144 | 7.153 | 30.247 | 1.144 | 7.153 | 30.247 | 1.133 | 7.081 | 29.092 |
| 2 | 1.122 | 7.010 | 37.257 | 1.122 | 7.010 | 37.257 | 1.125 | 7.034 | 36.126 |
| 3 | 1.019 | 6.370 | 57.022 | 1.019 | 6.370 | 57.022 | 1.098 | 6.861 | 57.022 |
| .. | … | … | … | ||||||
| 36 | .741 | 4.630 | 100.000 | ||||||
The items that represent the quality dimensions with high loading values were considered and a total of three components were obtained. According to Hair et al (2010) items can be included when the loading values exceed 0.5 onto a factor, and items less than 0.5 should be excluded. As shown in Table 6, three components have eigenvalues greater than 1.0 and account for 57.02 percent of the total variation in the data. The component weights and dimensions are represented in table 6. The results of PCA showed that out of 13 healthcare quality dimensions, only seven dimensions reflected the perception of patients in KSA hospitals. These dimensions were access, recovery, conformance, facility, reliability, feature, and responsiveness. Thus, 18 items were excluded as they were not meeting this criterion (communication, competence, security, courtesy, understanding, credibility). This is because of the low factor loading to the proposed factors (Faruk et al. 2021).
Table 6. Component weights and dimensions
| Health care quality Dimensions | Factor | |||
| 1 | 2 | 3 | ||
| Access 1 | 0.96 | |||
| Access 2 | 0.947 | |||
| Access 3 | 0.919 | |||
| Access 4 | 0.762 | |||
| Recovery 1 | 0.657 | |||
| Recovery 2 | 0.615 | |||
| Recovery 3 | 0.521 | |||
| Conformance 1 | 0.944 | |||
| Conformance 2 | 0.874 | |||
| Conformance 3 | 0.777 | |||
| Facility 1 | 0.654 | |||
| Facility 2 | 0.566 | |||
| Reliability 1 | 0.852 | |||
| Reliability 3 | 0.801 | |||
| Feature 1 | 0.786 | |||
| Feature 2 | 0.698 | |||
| Responsiveness 1 | 0.599 | |||
| Responsiveness 3 | 0.573 | |||
As a result, access and recovery dimensions pertained to the first component. The second component included two dimensions namely, conformance and facility. The third component resulted in obtaining three dimensions reliability, feature, and responsiveness. The PCA showed that seven dimensions explain 57.02 percent of the total variability in the count. Access and recovery belonged to the first component. This indicated that public hospitals should facilitate access to patient information, treatment details, and tests needed to be consistent with a patient’s recovery plans. The meta dimension can be labeled as “wellness support”. This result is consistent with Musa et al. (2021) study who emphasized creating wellness programs within primary health (Musa et al. 2021).
According to the institute of medicine (IOM) (2001), the availability of information is important for patients and their families to have the right for choosing the healthcare providers that offer medical and treatment services. Conformance and facility pertained to the second principal component. This means that patient view regarding the appropriateness of medical facilities, and relates to the fulfillment of healthcare standards. This is suggested the “healthcare compliance with standards” meta dimension. The dimension can be assessed through accreditation and audit activities. This is supported by the fact that compliance with accreditation standards provide many benefits to the hospitals in term of improving performance and patient safety (Hussein et al. 2021).
Indeed, most hospitals in Saudi Arabia work effectively to achieve Joint Commission International (JCI) accreditation. The JCI accreditation requirement is to execute patient satisfaction surveys and share these results with them (JCI 2008). Hospitals that have sought JCI accreditation have made the necessary steps to conduct patient satisfaction surveys. This required standard, prepared by the JCI to obtain patients’ opinions on the medical care received and has been considered as a part of the quality indicators for improvement. However, some hospitals in Saudi Arabia have not used patient satisfaction data to improve the quality of their care, only collecting the survey data to comply with JCI requirements (Hussein et al. 2021).
The third principal component included reliability, feature, and responsiveness. This suggested supplemental services to patient needs in a short time. For instance, speed up the medical reports’ turnaround time by improving the medical transcription process using an advanced information system. Also, reducing the patients waiting time, which includes the total time required to see a doctor and time needed to obtain prescribed medicines. The proposed meta dimension is “exceptional service and immediate care”. Lee and Yoon (2021) highlighted the usefulness of artificial intelligence (AI) based technology applications in hospitals, which help in improving the accuracy of medical diagnosis, creating new value for patients, and increasing the efficiency of operational processes (Lee and Yoon 2021). The health care meta quality dimensions in KSA public hospitals are represented in Table 7.
Table 7. Health care meta quality dimensions in KSA public hospitals
| Wellness Support | Compliance with Standards |
Exceptional Service and Immediate Care |
| Access | Conformance | Reliability |
| Recovery | Facility | Feature |
| Responsiveness |
CONCLUSION
The findings of the present study showed that wellness support, compliance with standards, and exceptional service and immediate care are the most critical quality dimensions that influence patients’ perceptions in KSA public hospitals, and can be used as the best predictors of overall patients’ perceptions. A longitudinal study can be conducted to validate the identified dimensions and to find out changes in patients’ perceptions. Other directions of study include comparing patient perceptions of healthcare quality dimensions in different regions of KSA. The main purpose of this study was to identify the main healthcare quality dimensions in KSA public hospitals based on patients’ perceptions. This application provides a platform for the hospitals to discover opportunities for improvement and satisfy patients’ needs. To ensure satisfactory performance, public hospitals should provide unique medical services to patients, which are in alignment with the Kingdom’s 2030 vision.
ACKNOWLEDGEMENTS
The study was financially supported by the University of Jeddah Jeddah Saudi Arabia.
Ethical Statement: Article approved by the Bioethics Committee of Scientific and Medical Research (BCSMR) at university of Jeddah on 17 October 2020 (Ref No UJ-02-70/April/2020). The research has been given ethics clearance. Please ensure that the BCSMR is notified should any change(s) be made, for whatever reason, during the research process. This includes changes in investigators.
Conflict of Interests: Author declare no conflicts of interests to disclose.
Data Availability Statement: The database generated and /or analysed during the current study are not publicly available due to privacy, but are available from the corresponding author on reasonable request.
REFERENCES
Alatawi, A.D., Niessen, L.W. and Khan, J.A., (2020). Efficiency evaluation of public hospitals in Saudi Arabia: an application of data envelopment analysis. BMJ open, 10(1).
Al-Azmi, N., Al-Lozi, M., Al-Zu’bi, Z.M.F., et al. (2012). Patients’ attitudes toward service quality and its impact on their satisfaction in physical therapy in KSA hospitals. European Journal of Social Sciences, 34(2), 300-314.
Al-Hanawi, M.K. and Makuta, I.F., (2022). Changes in productivity in healthcare services in the Kingdom of Saudi Arabia. Cost Effectiveness and Resource Allocation, 20(1), 1-8.
AlYami, M. S., and Watson, R. (2014). An overview of nursing in Saudi Arabia. Journal of Health Specialties, 2(1), 10-12.
Bensing, J. (1991). Doctor-patient communication and the quality of care. Social Science & Medicine, 32(11), 1301-1310.
Bellio, E. and Buccoliero, L., (2021). Main factors affecting perceived quality in healthcare: a patient perspective approach. The TQM Journal.
Cronin Jr., J. J., and Taylor, S. A. (1994). SERVPERF versus SERVQUAL: Reconciling performance-based and perceptions-minus-expectations measurement of service quality. Journal of Marketing, 58(1), 125-131.
Eiriz, V., and Figueiredo, J. A. (2005). Quality evaluation in healthcare services based on customer provider relationships. International Journal of Healthcare Quality Assurance, 18(6), 404-12.
Estes, C., Chapman, S., Dodd, C., et al. (2013). Health policy: Crisis and reform, Burlington, MA: Jones & Bartlett Learning, (6).
European Commission. (2014). Communication from the Commission – On effective, accessible and resilient health systems. European Commission. Brussels: European Commission. https://eur-lex.europa.eu/legal-content/en/ALL/?uri=CELEX%3A52014DC0215
Faruk, B.U., Haque, M.I., Tausif, M.R. et al. (2022). The association between health expenditure, institutions, and economic growth in MENA countries. Health Promot, 12(1).
Fuchs, V. R. (1998). Health care for the elderly: How much? Who will pay for it? Health Affairs, 18(1), 11-21.
Gabel, J., Sasso, A. T. L., and Rice, T. (2003). Consumer-driven health plan: Are they more than talk now? Health Affairs, 22(1), 9.
Garvin, D.A. and Quality, W.D., (1984). What does “Product Quality” Really mean?. Sloan management review, 25.
Giannini, M. (2015). Performance and quality improvement in healthcare organizations. Int J Healthc Manage 8(3):173–179.
Hair, J.F., Jr., Black, W.C., Babin, B.J, et al. (2010). Multivariate Data Analysis: A Global Perspective, Upper Saddle River, NJ: PrenticeHall (7).
Hussein, M., Pavlova, M., Ghalwash, M. et al. (2021). The impact of hospital accreditation on the quality of healthcare: a systematic literature review. BMC health services research, 21(1), 1-12.
Gronroos, C., (1988). Service quality: The six criteria of good perceived service. Review of business, 9(3), 10.
Institute of Medicine. (2001). Crossing the quality chasm: a new health system for the 21st century. Washington (DC): National Academy Press.
Ishfaq, M., Qadri, F. A., Abusaleem, K. S. M., et al. (2016). Measuring Quality of Service from Consumer’s Perspectives: A Case of Healthcare Insurance in Saudi Arabia. Health Science Journal.
Iversen, H. H., Holmboe, O., and Bjertnæs, Ø. A. (2012). The Cancer Patient Experiences Questionnaire (CPEQ): Reliability and construct validity following a national survey to assess hospital cancer care from the patient perspective. British Medical Journal Open, 2(5).
Joint Commission International. (2008). Joint Commission International Centre for Patient Safety. Joint Commission International: Boulevard, IL.
Kandampully, J., and Butler, L. (2001). Service guarantees: A strategic mechanism to minimize customers’ perceived risk in service organizations. Managing Service Quality: An International Journal, 11(2), 112-121.
Lee, D. and Yoon, S.N., (2021). Application of artificial intelligence-based technologies in the healthcare industry: Opportunities and challenges. International Journal of Environmental Research and Public Health, 18(1), p.271.
Ministry of Health (2002). Health Statistical Yearbook, MoH, Riyadh, Saudi Arabia. https://www.moh.gov.sa/en/Ministry/Statistics/book/Pages/default.aspx
Ministry of Health (2019). Health Statistical Yearbook, MoH, Riyadh, Saudi Arabia. https://www.moh.gov.sa/en/Ministry/Statistics/book/Pages/default.aspx
Mufti, M. H. (2000). Healthcare development strategies in the Kingdom of Saudi Arabia: Springer Science and Business Media.
Musa, S., Al Baker, W., Al Muraikhi, H., et al. (2021). Wellness program within primary health care: How to avoid “No Show” to planned appointments? A patient-centered care perspective. Physical Activity and Health, 5(1).
OECD. (2006). OECD Health Data. Organisation for Economic Co-operation and Development. http://www.oecd.org/health/healthdata.
OECD. (2020). Caring for Quality in Health: Lessons learnt from 15 reviews of health care quality. http://dx .doi.org/10 .1787/9789264267787-en
Panchapakesan, P., Rajendran, C., and Sai, L. P. (2009). A conceptual framework of service quality in healthcare perspective of Indian patients and their attendants. Benchmarking: An International Journal, 16(2), 157-191.
Parasuraman, A., Zeithaml, V.A. and Berry, L.L., (1985). A conceptual model of service quality and its implications for future research. Journal of marketing, 49(4), 41-50.
Patient-Centered Outcomes Research Institute (PCORI). (2014). PCORI’s stakeholders. http://www.pcori.org/funding-opportunities/what-we-mean-engagement/pcoris-stakeholders
Potts, M., Weinberger, M., and Brandt, K. (1984). Views of patients and providers regarding the importance of various aspects of an arthritis treatment program. The Journal of Rheumatology, 11(1), 71-75.
Satty, A.S. (2015). A critical analysis of patients’ satisfaction from government hospital system in Saudi Arabia. International Journal of Economics, Commerce and Management, 7(3), 404-411.
World Health Organization. (2006). WHO global strategy on people centred and integrated health services. Interim Report. Geneva: World Health Organization. https://apps.who.int/iris/handle/10665/155002
Zabada, C., Rivers, P. A., and Munchus, G. (1998). Obstacles to the application of total quality management in health-care organizations. Total Quality Management, 9(1), 57- 69.

