1Department of Electronics and Communication Engineering,K.Ramakrishnan College of Technology, Tiruchy-621112.Tamil Nadu, India
2Department of Electronics and Communication Engineering,K.S. Rangasamy College of Technology, Tiruchengode-637 215.Tamil Nadu, India
Corresponding author email: thiruvlsi@gmail.com
Article Publishing History
Received: 13/05/2020
Accepted After Revision: 22/06/2020
The analysis of blood cells during a microscope image can provide useful information concerning the health of the patient. Digital image processing techniques are far more efficient than manual observation to look at distinguish and diagnose blood disorders. The goal of this practice is to watch the nucleus and cytoplasm of blood cells. The project work is beneficial to detect different sorts of disease like leukemia, anemia, etc. supported the condition of the nucleus; the standard morphology of RBC undergoes specific changes as a consequence of various pathological abnormalities. One such disease is red blood cell Anemia (SCA) where the RBCs take crescentic sickle-like shape. Here during this project, correct identification of aberration in normal parameters of RBCs in an anaemic blood sample has presented using different image processing tools and techniques. Acute Myelogenous Leukemia (AML) may be a fast-maturing malignant neoplastic disease of the blood and bone substance. The demand for mechanized of leukemia detection arises since current methods require manual examination of the blood smear is that the beginning step toward diagnosis. this is often time-consuming, and also the accuracy of the tactic depends on the operator’s ability. during this paper, assorted image segmentation and have extraction methods utilized for AML detection are discussed. Leukemia comes about when tons of abnormal white blood cells created by the bone substance. Hematologist makes use of the microscopic study of human ancestry, which results in needing of methods, segmentation, including microscopic colour imaging, Categorization and clustering which will allow identification of patients affected by Leukemia. Different image processing algorithms like Image Enhancement, clustering, texture analysis, Mathematical morphology; Thresholding and Labelling are implemented using MATLAB.
Sickle Cell Anaemia, leukemia, AML, clustering and features
Krishnan T, Saravanan S. Detection of Leukemia and Sickle Cell Anemia Using Segmentation of Microscopic Images. Biosc.Biotech.Res.Comm. 2020;13(2).
Krishnan T, Saravanan S. Detection of Leukemia and Sickle Cell Anemia Using Segmentation of Microscopic Images. Biosc.Biotech.Res.Comm. 2020;13(2). Available from: https://bit.ly/30q6EGC
Copyright © Krishnan and Saravanan This is an open access article distributed under the terms of the Creative Commons Attribution License (CC-BY) https://creativecommns.org/licenses/by/4.0/, which permits unrestricted use distribution and reproduction in any medium, provide the original author and source are credited.
INTRODUCTION
Like all other sectors of medical science, there has been a normal progression in the pathological field too. However, the current age popular haematological analyzing devices cannot identify morphological abnormalities in blood cells with 100% precision as the detection part may subject to human error (Kasmin et al., 2012). Hither comes to the helping hand of advanced engineering skill. But till today there are few fields of the biomedical field where engineering science has not shown its magic still. One of such untouched sectors of the medico technological field is the detection of Sickle Cell Anemia and Acute myelogenousleukemia using Image Processing. Using this current research work have defined a metric and implemented the algorithm to find the significant result set which successfully detects the deviation of the shape of human RBCs and WBC to diagnose the disease Sickle-cell Anemia and Acute Myelogenous Leukemia, (Talukdar et al.,2014).
White blood cells (WBCs) or leukocytes play a major part in the diagnosis of several diseases. So extracting information about them is valuable for hematologists. The cancer of the blood and bone marrow is called leukemia. The bone marrow produces a great number of abnormal white blood cells in the case of cancer of the blood. These cells are immature, and they do not function properly. Without treatment, leukemia can be a pernicious disease. Leukemia is broadly classed as 1) acute leukemia (which comes along quickly), and 2) chronic leukemia (which comes along slowly). The word “acute” in acute myelogenousleukemia denotes the rapid advancement of the disease. It is called myelogenousleukemia because it involves a group of white blood cells called the myeloid cells, which in normal develops into different types of mature blood cells. Blood cancer or leukemia can be healed if it is discovered and treated at the earliest level. The demand for automation of leukemia detection arises since current methods involve manual examination of the blood smear is the beginning step toward diagnosis. This wastes more time, and its accuracy is much dependent on the operator’s ability. Many trials have been done in past decades to construct systems that aid in acute leukemia segmentation, classification and detection. Image segmentation is a method which can be used to understand images and extract information or objects (Nazlibilek, et al. 2014 and Ghane 2017).
It is the beginning step in image analysis. Feature extraction in image processing is a technique of redefining a large set of redundant data into a set of features (or feature vector) of reduced dimension. This input data is transformed into the set of features is called feature extraction (Krishnan, et al. 2014).
Sickle cell anemia is an inherited disease. They inherit two genes for sickle hemoglobin one from each parent. This leads to a propensity to the cells to assume a rigid, abnormal, sickle like shape under certain circumstances. Folks who inherit a sickle hemoglobin gene from one determine and normal genes from the opposite determine have a condition referred to as sickle cell trait; it’s far different than sickle cellular anemia. Humans who have sickle cell trait don’t have the disease. Humans who have sickle cell trait can pass the sickle hemoglobin gene to their kids. Anemia is a circumstance in which lineage has a lower than usual number of RBCs. This shape also can occur if red blood cells don’t contain enough hemoglobin. Red blood cells are produced in the spongy marrow inside the big bones of the physical structure. Bone marrow is continually creating new red blood cells to substitute previous ones. Healthy red blood cells last about 120 days in the bloodstream and then drop dead. The abnormal sickle cells usually die in about 10 to 20 days in sickle cell anemia. The bone marrow cannot be able to reproduce new red blood cells fast enough to put back the existing ones. Thus, the decreased number of RBCs in the blood causes anemia, which has termed as Sickle Cell Anemia (Rakshit and Bhowmik, 2013). Further, the segmentation and classification overview of red blood cells has been shown in detailed by several workers, (Alzubaidi, et al 2020), (Patgiri, et al 2019) and (Raphael, et al 2019)
MATERIALS AND METHODS
To detect the abnormal blood cells and their nucleus image segmentation is needed. In the case of leukemia detection segment the WBC nucleus, it needs many feature extraction techniques. But, sickle cell anemia needs segmentation and then followed by geometrical measurement to detect the shape information. Image segmentation aims to extract important information from an input image. It has taken on a key role for the reason that efficiency of next characteristic extraction and classification relies greatly on the perfect identification of the myeloblasts. There are many algorithms for segmentation has been developed for grey-level images. Image segmentation in this system was performed for extracting the nuclei of the leukocytes using colour-based clustering. Cluster analysis is the conventional study of methods and algorithms for grouping objects according to measured or perceived intrinsic characteristics. Cluster analysis uses class labels (i.e., K-means), which is one of the most popular unsupervised learning algorithms and is also a simple clustering algorithm; it is still widely practised. This speaks to the difficulty in designing a general-purpose clustering algorithm, and the ill-posed problem of bunching. In this report, we chose clusters corresponding to the nucleus (high intensity), desktop (high brightness level and low chroma), and other cells (e.g. Leukocyte cytoplasm and Red blood cells). Here, each pixel is assigned to one of these classes using the attributes of the cluster core.
K-Means Clustering Algorithm: The k-means algorithm requires three user fixed parameters: (1) The number of clusters k, (2) Cluster initialization, and (3) Distance metric(Nancy M. Salem 2014). A k-means clustering procedure is employed to assign every pixel to one of the clusters. Here each and every pixel is assigned to one of these classes using the attributes of the cluster core. Every pixel of an object is classified into k clusters based on the corresponding *a and *b values in the L*a*b colour space. Thus, each picture element in the L*a*b colour space is classified into any of the k clusters by calculating the Euclidean distance between the picture element and each colour indicator. These clusters correspond to the nucleus (high intensity), desktop (high brightness level and low chroma), and other cells (e. g., erythrocytes and leukocyte cytoplasm).
Each pixel of the entire image will be labelled with a particular colour depending on the minimum distance from each index. While performing k-means segmentation of complete images, it was noticed that, in some of the segmented images. Still, the edges of the nuclei were obtained as opposed to the whole images of the nuclei. The morphological filtering is used to overcome the shortcoming of the nuclei. An image is partitioned into several areas depending on the features to be drawn out. Employing morphological filtering ensures that perceptibility and visibility of these regions improve. The next activities were done to get the desired result. Once these actions are performed, the following shape-based and textures are then extracted from these whole images they are:
- Edge enhancement (used by the Sobel operator)
- Canny edge detection
- Dilation
- Hole-filling
Feature extraction in image processing is a method of transforming large redundant data into a reduced data representation. Feature extraction is to transform the input data into the set of features. These feature extraction techniques are mainly used to detect AML from the blood images (Agaian et al., 2014 ) and (Sukhia et al., 2019).
Fractal Dimension
Fractals are using in medicine and science earlier for various quantitative measurements. The fractal dimension D is a statistical measure that gives an indication of how completely a fractal appears to occupy space. The most important theoretical fractal dimensions are the Renyi dimension, the HD, and the packing dimension normally, the box-counting dimension is widely practised. The procedure for Hausdorff Dimension measurement using the box-counting method is presented below as an algorithm:
- Each nucleus colour (RGB) image is converted to grey and successively to a binary image.
- The nucleus edge boundary is extracted using Canny edge detection technique.
- A grid of R squares is superimposed over the edges while counting the edge occupied squares.
- Measure 3 is continued for an increasing number of squares.
The Hausdorff Dimension HD may then be specified as follows:
The notation of R is the number of squares in the superimposed grid, and R(s) is the number of squares or boxes (box count) which are occupied. Higher HD signifies a higher degree of roughness.
Local Binary Patterns (LBP)
LBP is a powerful feature for texture classification. This LBP feature vector is formed as follows:
- The examined window is split into cells (e.g. 16×16 pixels for each cell).
- For every pixel in cellular to evaluate the pixel cost into every one of its eight neighbours (on its right -top, right-middle, left-top, and many others.).
- Observe the pixels along a circle, i.e. either clockwise or counter clockwise.
- If the centre pixel’s value is extra than the neighbour’s value, write “1”. Otherwise, write “0”. This offers an eight-digit binary wide variety (that is usually converted to decimal for comfort).
- Compute the histogram, over the cellular, of the frequency of each “number” occurring (i.e., each mixture of which pixels are smaller and which might be greater than the centre).
- Optionally normalize the histogram.
- Concatenate histograms of all cells. This gives the window’s feature vector.
Texture Features
The texture functions may be extensively categorized into spatial texture feature extraction techniques and spectral texture feature extraction methods based totally at the area from which they are extracted. Inside the first technique, texture capabilities have become through finding the local pixel systems within the authentic photo area, extracted or by means of computing the pixel data, while the second technique transforms an image into the frequency area after which calculates function from the transformed photo.
Shape Features
Shape descriptors are fixed of numbers that describe a given shape. Form function extraction techniques may be broadly categorized into two businesses, contour-based totally and place-based technologies. The first technique calculates shape capabilities most effective from the form boundary, whilst the second technique extracts capabilities from the whole location. Further, spatial courting is also taken into consideration in picture processing that tells the item place inside a photo or the relationships among objects. It includes the subsequent instances: the absolute spatial vicinity of areas and relative places of regions.
In sickle cell anemia, a normal RBC (i.e. Circular in front view and bi-concave inside view) is translated into ‘sickle’-like form and plumpness of the RBC are lost (Rakshit and Bhowmik 2013). So the confirmatory pathological diagnosis of SCA is obtained by examining the pattern of the RBC. Here a metric has been purported to identify this change in the shape of RBC in order to diagnose the disease. Essentially, this metric indicates the roundness of a confined object. It is specified as (4*pi*area) /perimeter2. So for a 2-d circle, i.e. a round object, metric value is 1for a 2-d square, it is 0.785. That is why for a normal RBC metric value is nearly one, and for sickle RBC, the value deteriorates from 1 and results in a lesser value of the metric, The overlapping of the blood cells can be easily separated using spatial colour based SC and ellipse fitting on cell contours methods (JiGe,et al. 2014).
The algorithm is described here:
- The microscopic blood smear image is fed to the program as input and is converted to a binary image.
- The input image is complemented, and for the ease of further processing, small unwanted spots are taken away from it using bwareaopen which removes all the targets in the diagram containing fewer than the number of pixels mentioned in the threshold stage.
- A number of similar components are detected using bwconncomp.
- Using region props to calculate the area on the connected objects.
- Detected connected corpuscles are displayed one by one, and then the corresponding surface area is shown in the software command window.
- Throwing out the smaller background objects, just the larger RBCs are seen and pre-processed for going through the remainder of the stairs.
- The edges of these RBCs are detected using the Sobel edge detection algorithm.
- Small holes in the objects are covered up using an infill operator to increase the precision of further calculation.
- The boundary of each of the elements is traversed and marked over the objects, and the perimeter is calculated from the obtained boundary measured.
- Metric(roundness) [i.e. (4*pi*area) / perimeter2] is calculated for each object.
- By this roundness value(metric), any deviation or change in the shape of RBC is detected, which are helpful in diagnosing some cases of anemia like sickle cell anemia.
RESULTS AND DISCUSSION
Figure 1: Input Diseased Leukemia Microscopic Image
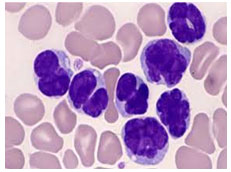
Figure 2: Detected Nucleous Using K- means Clustering
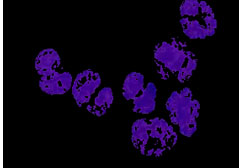
Figure 3: Cancer Detected Image
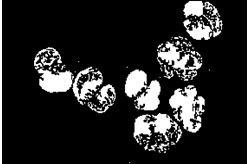
Figure 4: Sickle Cell Microscopic Image
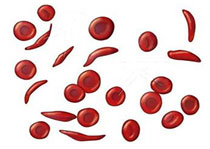
Figure 5: Detected RBC Cells
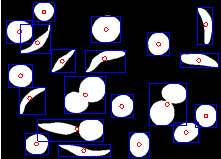
Figure 6: Sickle Cell

Figure 7: Normal Cell
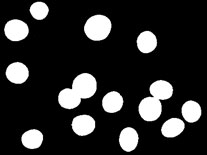
The proposed algorithm uses various methods to detect blood disorders like anemia and leukemia. The Fig 1 shows the blood cancer microscopic image it is processed by texture analysis, fuzzy clustering and GLCM techniques and finally, the detected cancer cell nucleus shown in Fig 3. The colour-based classification using k-means clustering output shown in fig 2. Table 1 indicates the various performance measures between normal and cancerous cell; these values are mainly used to identify the disease (AML). Fig 4 shows the sickle cell microscopic image the segmentation process applied to the input image. The geometric feature analysis was performed, and finally, the detected RBC cells are indicated in Fig 5. In sickle cell anemia detection based on the roundness value, it will classify as a normal cell or sickle cell if the roundness value greater than 0.75 the cells are classified as normal RBC. If the rounded value is less than 0.75, then the cells are classified as sickle cell. These features based classification algorithm is done by multilevel; it is mainly used to detect blood disorders.
Table 1. Performance Measures of Leukemia Detection
| Features | Cancerous | Normal |
| Mean | 32.3348 | 38.3476 |
| Standard deviation | 47.1398 | 40.8327 |
| Area | 6468 | 1976 |
| Perimeter | 255 | 805.723 |
| Elongation | 1.1354 | 1.519 |
| Eccentricity | 0.4852 | 0.7543 |
| Form factor | 1.3621 | 0.0378 |
| Solidity | 0.5742 | 0.2128 |
| Compactness | 10.762 | 327.42 |
CONCLUSION
The main objective of the present work is to detect blood disorders like leukemia and anemia. The nucleus segmentation and classification is followed by feature extraction methods to detect Leukemia and anemia. Shape features of nuclei such as area, perimeter, texture feature and GLCM, etc. are considered for better accuracy of detection. The sickle cell anemia detection cell boundary segmentation and geometrical measures are mainly used. The results show that the proposed nucleus segmentation, feature extraction and statistical parameter such as mean and standard deviation based produced good segmentation performance. Besides, the fully segmented nucleus and shape of the cell can be better achieved by using MATLAB based algorithm because it is less sensitive to input image variations.
REFERENCES
Agaian Sos, Madhukar Monica, and Chronopoulos Anthony T. (2014). Automated Screening System for Acute Myelogenous Leukemia Detection in Blood Microscopic Images, IEEE Systems Journal, Vol. 8, No. 34. Pages 995-1004.
Alzubaidi L, Fadhel M. A., Al-Shamma O., Zhang J., and Duan Y., “Deep Learning Models for Classification of Red Blood Cells in Microscopy Images to Aid in Sickle Cell Anemia Diagnosis,” Electronics, vol. 9, no. 3, Pages 427, 2020.
Ghane N, Vard A, Talebi A, Nematollahy P (2017). Segmentation of White Blood Cells From Microscopic Images Using a Novel Combination of K-Means Clustering and Modified Watershed Algorithm. J Med Signals Sens.Vol 7, No.2 Pages:92‐101.
JiGe, et al. (2014). A System for Counting Fetal and Maternal Red Blood Cells, IEEE transactions on Biomedical Engineering, Vol. 61, No. 12, pp. 2823-2829.
Kasmin Fauziah, Satria Prabuwono Anton, Azizi Abdullah.(2012). Detection of Leukemia in Human Blood Sample Based On Microscopic Images: A Study, Journal of Theoretical and Applied Information Technology.Vol.46 No.2 Pages 579-586
Krishnan J B Kumar and Athira Y (2014)A Survey on Image Segmentation and Feature Extraction Methods for Acute Myelogenous Leukemia Detection in Blood Microscopic Images, International Journal of Computer Science and Information Technologies.Vol.5 No.6 Pages7877-7879.
Nancy M. Salem(2014), Segmentation of white blood cells from microscopic images using K-means clustering, 31st National Radio Science Conference (NRSC), Cairo, pp. 371-376.
Nazlibilek Sedat, et al. (2014).Automatic segmentation, counting, size determination and classification of white blood cells, Elsevier Ltd, Measurement Vol.55.Pages 58–65.
Patgiri C. and Ganguly A., Red Blood Cell and Sickle Cell Detection from Microscopic Blood Images of Sickle Cell Anemic Patient,” in 2019 International Conference on Wireless Communications Signal Processing and Networking (WiSPNET), 2019, Pages 474–478.
Rakshit Pranati, Bhowmik Kriti. (2013). Detection of Abnormal Findings in Human RBC in Diagnosing Sickle Cell Anaemia Using Image Processing, International Conference on Computational Intelligence: Modeling, Techniques and Applications (CIMTA- 2013), Procedia Technology Vol.10 Pages 28 – 36.
Raphael R. T. and Joy K. R., “Segmentation and Classification Techniques of Leukemia Using Image Processing: an Overview,” in 2019 International Conference on Intelligent Sustainable Systems (ICISS), 2019, Pages. 378–384.
Sukhia Komal Nain, Ghafoor Abdul, Mohsin Riaz Muhammad, Iltaf Naima (2019), Automated acute lymphoblastic leukaemia detection system using microscopic images, in IET Image Processing, vol. 13, no. 13, Pages. 2548-2553,
Talukdar Nur Alom, Deb Daizy, Roy Sudipta. (2014). Automated Blood Cancer Detection Using Image Processing Based on Fuzzy System, International Journal of Advanced Research in Computer Science and Software Engineering. Vol.4 No.8. Pages 467-472.

