Department of Biotechnology, G B Pant Engineering College, Pauri Garhwal, Uttarakhand, INDIA
Article Publishing History
Received: 11/08/2016
Accepted After Revision: 05/09/2016
Malta (Citrus× sinensis) is a local variety of sweet orange which has been developed by hybridization between orange and lemon from hills of Uttarakhand, India. Malta peel is generated in huge amount as a waste product of food processing units. The present work is an effort to establish the potential anti oxidative, anti-carcinogenic and anti-cancerous role of Malta peel. Analysis revealed the presence of antioxidant enzymes like super oxide dismutase (SOD), catalase, glutathione peroxidase; which can check the reactive oxygen species (ROS) level and non-enzymatic antioxidant activity as observed in FRAP-assay (TPPZ method). Presence of anti-oxidative and anti-allergic vitamins in ample amount i.e. Vit. E, Vit. C, polyphenols and tumor preventive flavonoids (limonene) has been confirmed by GC-MS analysis, these compounds are known to possess an anti-carcinogenic role as well. Further to understand the possible anti-cancerous role, an in silico study was conducted using TGFâ isoforms (TGF-â1 and TGF-â2) as ligands. TGFâ signaling has a mechanistic role in tumor suppression and a previous medical study has confirmed its indulgence in different forms of cancers e.g. pancreatic cancer, renal cancer, breast cancer and lymphoma.
Malta Peel, Sod, Catalase, Glutathione Peroxidase, Frap, Tgf-Â1, Tgf-Â2, Anticancer.
Singh V, Arora D, Singh A. Antioxidant Potential and In-Silico Analysis of Compounds from Citrus Sinensis Peel Extracts Against TGF-Β Isoforms. Biosc.Biotech.Res.Comm. 2016;9(3).
Singh V, Arora D, Singh A. Antioxidant Potential and In-Silico Analysis of Compounds from Citrus Sinensis Peel Extracts Against TGF-Β Isoforms. Biosc.Biotech.Res.Comm. 2016;9(3). Available from: https://bit.ly/2BGfRgD
Introduction
Sweet oranges are one of major fruit crops which are well distributed around the globe from North American continent to Asia. Most of the varieties of sweet orange which are available today are result of mutation and hybridization, occurring from past centuries (Khan 2007). In Indian subcontinent, many varieties of sweet oranges which occur are quite different from each other and have different names. Malta (Citrus sinensis or C. var. sinensis (L.) Osbeck), a variety of sweet orange is a delicious major fruit crop of northern hilly region of
Uttarakhand-India. In Uttarakhand, citrus species occupy about 13.90 per cent (27400 ha) of total fruit area and Garhwal region is one of the major citrus growing regions of Uttarakhand with 50.20 per cent (13755 ha) of the total citrus producing area (Gunwant et al. 2003).
Malta is enriched with an array of nutrients and multiple health benefits. Malta fruit is used in different forms by beverage and food industry i.e. in form of juice, squash preparation, or as whole for other purposes. Malta pomace and peel is the major bio-mass which does not get utilized significantly and dumped as an agricultural waste (Manthey and Grohmann 2001, Anagnostopoulou et al. 2006, Mallick and Rafeeq 2016, and Rafi q et al., 2016). Although, malta peel has high nutritional value as it contains carbohydrate, vit. A, vit. C, vit. E, fatty acids, different flavonoids and polyphenols Manthey and Grohmann 2001, Anagnostopoulou et al. 2006, Mallick and Rafeeq 2016, and Rafiq et al. 2016).
The present work is focused on the anti-carcinogenic, anti-cancerous ability of malta peel as the peel extracts were tested for biological activities such as antimicrobial activities, enzymatic and non-enzymatic anti-oxidant assays. Along with that, the presence of compounds in malta peel extracts (hexane, ethanol and methanol) were studied through GC-MS analysis and further in silico studies of compounds obtained were carried out by docking against the targeted protein receptor to establish the anti-carcinogenic role.
TGF-â1 and TGF-â2 are chosen as molecular targets for chemoprevention. TGFâ is a multifunctional cytokine (Bierie and Moses 2006) which is synthesized by almost every cell of eukaryotic organism and all of them have specific receptors for these peptides. Previous studies have suggested that, through various cell functions i.e. cell differentiation, cell proliferation, cell migration and apoptosis, (Bierie and Moses 2006, Drabsch and Ten Dijke 2012), TGFâ promotes different cancer metastasis as lung, breast, bone, colorectal, prostate, pancreatic, lymphoma and renal cortex metastasis by affecting surrounding tumor microenvironment, (Slamon et al. 1987, Levy and Hill 2006, Drabsch and Ten Dijke 2012, Huang and Chen 2012, Imamura et al. 2012, Yu et al. 2014 and Valvona et al. 2016).
The TGFâ ligands are synthesized in the form of dimer as raw hormones inside the cell (Gray and Mason 1990 and Massagué 2008). These are secreted into the extracellular matrix, where they are activated as signaling molecule by the cleaving action of furins and some convertases. Activated TGFâ cytokines can then signal by bringing together two pairs of receptor serine/threonine kinases, the type 1 and type 2 receptors forming a heterodimer complex (Dubois 1995, Constam and Robertson 1999, Padua and Massagué 2009). Human genome can encode seven type 1 receptors (ALK1, ALK2, ALK3, ALK4, ALK5, ALK6, ALK7) and five type 2 receptors (Padua and Massagué 2009, Pickup et al. 2013, Miles et al. 2013) which are paired in different combination as receptor complex for various members. The TGF-â1 ligand protein preferentially signals through the TâR-2, type-2 receptor and ALK-5 type-1 receptor, (Yang et al. 2013, Tazat et al. 2015).
TGFâ activation leads to the emergence of different regulatory protein, inducing transcription of different target genes whose functions are differentiation, proliferation and activation of many other cells (Bierie and Moses 2006, Siegel and Massagué 2003, Derynck and Zhang 2003). TGFâ signaling has a mechanistic role in tumor suppression and regulates cancer through function via two mechanisms. First, within the tumor cell itself or via host tumor cell interaction (Meulmeester and Ten Dijke 2011, Zheng et al. 2014) which can forge the anti-cancerous role of TGFâ.
Material And Methods
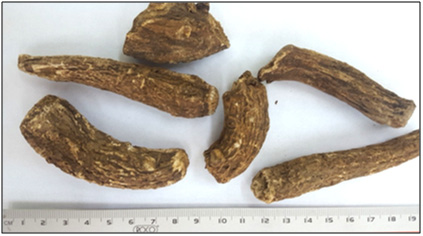
Malta peels were collected from the local juice producers of Pauri, Uttarakhand, these peels were shade dried and converted into fine powder by grinding in a blender for further processing. TPTZ (2,4,6 Tripyridyl-s-triazine), different solvents and chemicals were of analytical grade and purchased from HiMedia Pvt. Ltd. (Mumbai, India) and Sigma-Aldrich chemicals Pvt. Ltd. (Bengaluru, India). Malta peel powder (10 gm) was extracted with methanol, ethanol and n-hexane at 60°C for 6 hours in a Soxhelet apparatus and extraction was repeated till solution became colorless. Extracts were collected and concentrated in a rotary vacuum-evaporator and stored at 4°C for further experiment. For non-enzymatic antioxidant assay (FRAP-method) extracts were concentrated to form powder in a lyophilizer.
Antibacterial activity of extract prepared in different solvents i.e. methanol, ethanol, hexane was examined against microbes as broad spectrum antibacterial agent. Two different strains of gram (+) S. aureus (MTCC 740), B. subtilis (MTCC 441) and gram (-) E. coli (MTCC 443), S. typhi (MTCC 733) were taken for antibacterial activity obtained from the Institute of Microbial Technology-Chandigarh, India. The bacterial strains were grown in MHA (Muller-Hinton Agar) at 37°C for 24 hr. FRAP (Ferric reducing ability of plasma or, Ferric ion reducing antioxidant power), is a novel method for quantitative assay to analyze the antioxidant potential of the extract at low pH (Benzie 1996, Liu 1982, Stookey 1970).
The reaction mixture was composed of dried extract, 0.3 M sodium acetate, 20 mM ferric chloride, 40 mM hydrochloric acid and TPTZ (2,4,6 Tripyridyl-s-triazine). Incubate the mixture at 37°C for 15 minutes, after that absorbance were taken at 593 nm and compared with standard curve of ascorbic acid. Fresh 1 gm peel were taken and ground with 5 ml phosphate buffer (0.067 M) in a pre-chilled mortar-pestle at -20°C, and was centrifuged at 10,000 ×g at 4°C for 10 minutes. The supernatant was collected and stored at 4°C for the further use, (Giannopolitis and Ries 1977, Pandey et al. 2012).
Protein content of the crude-enzymatic extract was determined by the Bradford method, where Bovine albumin serum (BSA) was taken as standard (Bradford 1976). To check the level of ROS, cells have many of antioxidant enzymes. Three of the major antioxidant enzymes that are supposed to be in a living system to prevent or repairs such damage caused by ROS are superoxide dismutase (SOD), catalase and glutathione peroxidase (GPx).
SOD activity was determined by the modified method of (Giannopolitis and Ries 1977). Reaction mixture contains 50 mM phosphate buffer (pH 7.8), 13 mM methionine, 75µm NBT, 0.1 mM EDTA, 100 µl of enzyme extract, at last 2 mM Riboflavin and reaction was initiated by exposing the tubes to the fluorescent lamp. Absorbance was taken at time interval of 5 minute and 15 minute at 560 nm.
The catalytic activity of SOD was calculated by the following formula.
SOD (unit/ml) = [(V/v) – 1] × dilution factor
Where, V and v were absorbance in absence and in presence of enzyme respectively.
The assay was carried out by standardized method of (Sandhir and Gill 1995). The enzyme extract 40µl were taken in reaction mixture containing 3ml H2O2-Phosphate buffer (pH 7.0) and change in absorbance were read against the buffer blank at 240 nm for 60 seconds.
The catalytic activity was calculated by given formula.
Units in the sample mixture = 17/T
Where, T was the time required to decrease the absorbance by the factor of 0.05.
The assay was carried out by modified method of (Kaur et al. 2006), which contains 2 ml 0.5 M phosphate buffer (pH 7.0), 0.1 ml 1mM EDTA, 0.1mM sodium azide, 0.10 ml 1mM GSH, 0.1 ml 2mM NADPH, 0.01 ml 0.25 mM H2O2 and 0.1 ml 10% PMS in a total volume of 3 ml, 50 µl of sample was added at last except blank and the absorbance was taken at 340 nm.
The GPx activity was estimated as nmol NADPH oxidized/minute/mg protein with the molar extinction coefficient of 6.22 X 10³ M−1 cm−1 by using the formula.
GPx = (Δ O. D × Vol. Of assay × 1000) / (6.22 × Vol. of enzyme × protein content)
Shimadzu QP2010 ultra series gas chromatograph-mass spectrometer was used for the purpose of GC-MS analysis of sample extract. The compounds were identified by comparison of their mass spectral data with PubChem and other available literature data. The database of nearly 200 compounds were obtained after analysis of sample extract. 3-D model of each compound was obtained from PubChem in SDF file format and unknown structure were drawn with the help of Marvin bean and converted into 3-D, SDF file format. Further, obtained geometrics were optimized according to standard protocol for docking.
The three dimensional structure of TGF-â2 was obtained from the Protein Data Bank (.pdb) and structure of TGF-â1 was retrieved through homology modeling as complete structure was not available. For homology modeling FASTA sequence of TGF-â1 is obtained from the Uniprot with accession number (P36897) which was allowed to blast with human sequence. The sequence with maximum resemblance was selected and converted into a pdb structure with the help of SWISS-MODEL; a protein structure homology modeling server. Different parameters as protein quality (ProQ) (Wallner and Elofsson 2003), z-score (ProSA) (Wiederstein and Sippl 2007, Sippl 1993), verified 3-D structure, Ramachandran plot, protein and active site stability (Saves) are examined (Liithy et al. 1992, Bowie et al. 1991) to validate the stability of retrieved structure of TGF-â1. After stability validation of the protein (TGF-â1) other docking pre jobs were done according to standard protocol.
Molecular docking is a computational procedure that attempts to predict noncovalent binding of macromolecule or macromolecule and a ligand molecule efficiently. AutoDock structure files PDBQT which can be seen as an extension of the PDB file format of all the compounds present in extract and target proteins were generated with the help of mgltool and docked at the binding site of the receptor proteins and simulation was performed on AutoDock Vina. AutoDock Vina work on Lamarckian algorithm and geometric algorithm, calculates its own grid map of dock site (Trott and Olson 2010). Grids were prepared for each protein with the same exact center and the size of the bounding box set. This way it combines a rapid grid based method for energy evaluation and 10 maximum negative energy possessing compounds were obtained.
To analyze the toxicity of the docked compound this had good negative energy and could have potential drug like qualities. An online server mcule.com had been used for the prediction, for this smile file format of the compounds were uploaded on the server and after analysis server gives the result (Kiss et al. 2012). Complex generated from AutoDock are visualized using LigPlot+ v.1.4.5 (software), which shows the presence of H-bond between ligand and target protein (Wallace et al.
1995).
Results And Discussion
Reactive oxygen species (ROS) or free radical can damage DNA, induces mutation and negatively affects the DNA-repair, which results in the inactivation of the many of tumor suppression gene. GC-MS analysis revealed that extract contains ample amount of antioxidant content as whole like as vit. E, vit. C which have been shown to be anti-carcinogenic against doxorubicin induced chromosomal aberration (Antunes and Takahashi 1998) along with that vit. C had been reported for its role in decreasing the frequency of induced mutation (Khan and Sinha 1993). Extract also shows high concentration of limonene, a flavonoid which reduces the inflammatory response by suppressing the production of reactive oxygen species (ROS).
Antibacterial activity of the different extracts was studied on both gram (+); S. aureus, B. subtilis and gram (-); E. coli, S. typhi to examine the presence of any possible bio-active compound which have capability to check the growth of cell, while taking tetracycline and respective solvents as control. Effective antibacterial activity of unripen malta peel extract (Figure.1-3) confirmed the presence of certain bioactive molecule which have capability to check the cellular growth whereas, there is significant loss of antimicrobial activity was observed in ripen malta peel extract (Figure.4-6). This denotes the loss of certain bio active compounds during the due period of fruit ripening (Table 1-2).
| Table 1: Zone of inhibition of different strains of bacteria in presence of unripen malta peel extract (hexane, ethanol, methanol). Tetracycline was taken as positive control and respective solvent as negative control. Where no antibacterial activity was shown by any of negative control | ||||||||||||
| Name
of strain |
Hexane extract Zone of inhibition (c.m.) | Positive control (c.m.) | Ethanol extract Zone of inhibition (c.m.) | Positive control (c.m.) | Methanol extract Zone of inhibition (c.m.) | Positive control (c.m.) | ||||||
| Vol. (50µl) | Vol. (100µl) | Vol. (150µl) | Vol. (50µl) | Vol. (50µl) | Vol. (100µl) | Vol. (150µl) | Vol. (50µl) | Vol. (50µl) | Vol. (50µl) | Vol. (50µl) | Vol. (50µl) |
|
| S. aureus | 1.54 | 1.94 | 2.14 | 2.24 | 1.44 | 1.54 | 2.04 | 2.04 | 0.00 | 0.00 | 0.00 | 2.3 |
| B. subtilis | 1.64 | 2.04 | 2.34 | 3.84 | 1.34 | 1.64 | 1.84 | 3.64 | 1.42 | 1.60 | 2.00 | 2.9 |
| E. coli | 1.14 | 1.44 | 1.54 | 2.64 | 1.04 | 1.24 | 1.96 | 2.04 | 0.00 | 0.00 | 0.00 | 2.4 |
| S. typhi | 1.54 | 1.84 | 2.04 | 3.34 | 1.54 | 1.76 | 2.04 | 2.24 | 0.00 | 0.00 | 0.00 | 2.3 |
| Table 2: Zone of inhibition of different strains of bacteria in presence of ripen malta peel extract (hexane, ethanol, methanol). Tetracycline was taken as positive control and respective solvent as negative control. Where no antibacterial activity was shown by any of negative control. | ||||||||||||
| Name of strain | Hexane extract Zone of inhibition (c.m.) | Positive control (c.m.) | Ethanol extract Zone of inhibition (c.m.) | Positive control (c.m.) | Methanol extract Zone of inhibition (c.m.) | Positive control (c.m.) | ||||||
| Vol. (50µl) | Vol. (100µl) | Vol. (150µl) | Vol. (50µl) | Vol. (50µl) | Vol. (100µl) | Vol. (150µl) | Vol. (50µl) | Vol. (50µl) | Vol. (l00µ) | Vol. (150µl) | Vol. (50µl) | |
| S. aureus | .00 | .70 | .80 | 2.1 | .00 | .00 | .00 | 2.1 | 0 | 0 | 0 | 2.1 |
| B. subtilis | .70 | .80 | .80 | 3.10 | 1.00 | 1.00 | 1.10 | 3.2 | 1.10 | 1.2 | 1.2 | 3.1 |
| E. coli | .00 | .00 | .70 | 2.2 | .00 | .00 | .00 | 2.00 | .00 | .00 | .00 | 2.2 |
| S. typhi | .00 | .00 | .00 | 2.9 | .00 | .00 | .00 | 2.5 | .00 | .00 | .00 | 2.8 |
| Table 3: Result of Most favorable non cytotoxic compounds of ripen malta peel extract docked with TGF-β1 and TGF-β2. | |||
| Name of compound | Energy with TGF-β1 (k.cal/mol.) | Energy with TGF-β2 (k.cal/mol.) | Solvent |
| (+) Alpha-Tocopherol | -9.1 | -6.3 | Hexane |
| Phenol3,5-bis(1,1- Dimethylethyl) | -6.8 | -6.8 | Hexane |
Reactive oxygen species (ROS) are produced as a necessary evil in several metabolic reactions. ROS i.e. superoxide, hydrogen peroxide, are cytotoxic and carcinogenic in nature while their presence in lower concentration is also required for the regulation of many of physiological activities such as apoptosis, cell differentiation and redox-sensitive signal transduction (Allen and Balin 1989, Shibanuma et al. 1988 and Hockenbery et al. 1993).
Antioxidant activity of extracts were determined to analyze the presence of antioxidant species which plays crucial role against the ROS and minimizes the presence of free radicals which can damage cellular structure, DNA mutation and alteration in transcription
factors. For non-enzymatic antioxidant assay standardized FRAP-method was used, which confirms the antioxidant potential of the ripen malta peel extract (Figure. 7) as quantity of extract was increased there is fair increment of antioxidant potential had been observed. Protein concentration was calculated by Bradford method and it found to be 0.00809 mg/ml and enzymatic activity of essential antioxidant enzymes viz. superoxide dismutase (SOD), catalase and glutathione peroxidase (GPx) were 4.136 U/ml, 0.66667 nmol H2O2 decomposed/min/mg protein and 18520.9 nmol NADPH oxidized/minute/mg protein respectively, (Weydert et al, 2011).
In silico study of possible role of compounds present in malta peel as shown by GC-MS analysis was carried out, considering TGF-â1 and TGF-â2 molecular protein as target. Structure of TGF-â1 was obtained through molecular homology and stability of the retrieved structure was verified. As saves result shows, verified 3-D structure of the retrieved structure as 93.94% of the residue had an average 3D-1D score more than 0.2, whereas required score is 80%. where result of ProSA were also confirmed the stability of the structure (Figure 11) as, z-score of the structure was -8.13 and required to be a stable structure was -5.0 along with them Ramachandran plot of TGFâ-1 results also verifies the stability of structure as 98% residues are in favored region and 2% residues are in allowed region.
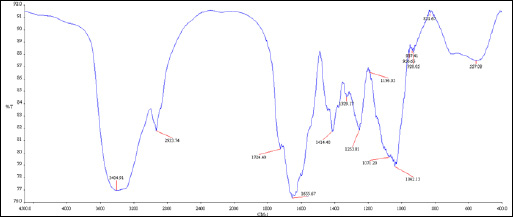 |
Figure 8: Chromatogram of GC-MS analysis of ripen malta peel hexane extract, presence of 66 different compounds were confirmed |
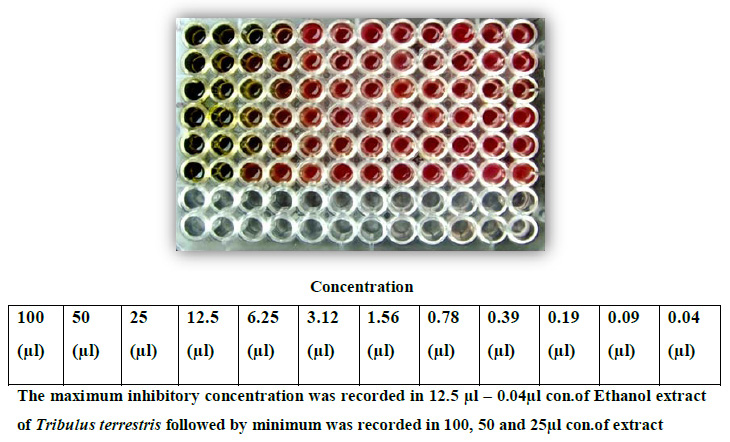 |
Figure 9: Chromatogram of GC-MS analysis of ripen malta peel ethanolic extract, presence of 35 different compound were confirmed. |
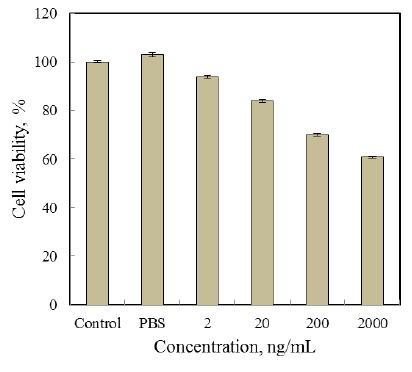 |
Figure 10: Chromatogram of GC-MS analysis of ripen malta peel methanolic extract, presence of 19 different compounds were confirmed |
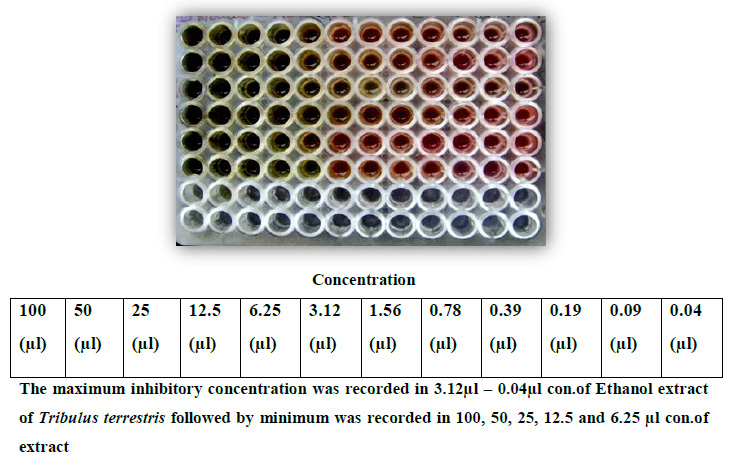 |
Figure 11: Results of ProSA shows the stability of TGF-b1 model by analyzing NMR and X-ray crystallography analysis. |
Result of ProQ also favored the retrieved structure TGF-®1 as Predicted LGscore: 5.689 (LGscore ≥ 4 extremely good model) and Predicted MaxSub: 0.545 (MaxSub > 0.5 very good model). Docking simulation of peel compounds obtained after GC-MS analysis (Figure.8-10) was done with TGF-®1 and TGF-®2 and ten most stable compounds were selected. After ADME-T prediction two most favorable compounds on the basis of non-cytotoxicity Phenol 3,5-bis (1,1-Dimethylethyl) and (+) Alpha-Tocopherol (Table-3) were selected and there LigPlot were drown to analyze the presence of any possible H-bond formation between ligand and protein. LigPlot confirmed the presence of hydrogen bond formed. (+) Alpha-Tocopherol also had shown the maximum energy (-9.1 k.cal/mol.) and reported for their medicinal properties (Nelson et al., 2016, Marubayashi et al. 1986) and one H-bond formation with TGF-â1 (Figure.13) in docking results and had been confirmed as best compound for possible drug, where as Phenol 3,5-bis (1,1-Dimethylethyl) was the most stable-non cytotoxic compound with TGF-®2 (-6.8 k.cal/mol.) protein (Figure.12). In the present study we found that malta peel extracts, which is considered as an agriculture waste shown the presence of potential bio-active compounds with nontoxic nature that can play a major role in cancer research. 8-hydroxylinalool shown the no cytotoxicity and highest stability against TGF-® isoforms as selected target, which plays a crucial role in cancer
 |
Figure 12: Phenol 3,5-bis (1,1-Dimethylethyl) with TGF-â1, attached at dock site and LigPlot of TGF-â1 with Phenol,3,5-bis(1,1-Dimethylethyl), showing H-bond formation between ligand and protein |
 |
Figure 13: (+) Alpha-Tocopherol with TGF-â1, attached at dock site and LigPlot of TGF-â1 with (+) Alpha-Tocopherol, showing H-bond formation between ligand and protein |
Conflict of Interest
The authors don’t have any conflict of interest to declare.
Acknowledgments
This study was conducted in the Department of Biotechnology, G. B. Pant Engineering College (GBPEC), Pauri Garhwal (Uttarakhand), India. VS is thankful to AICTE and DA is thankful to TEQIP-II (Technical Education Quality Improvement Programme, Government of India) for financial assistance.
References
Allen RG. and Balin A.K. (1989) Oxidative influence on development and differentiation: an overview of a free radical theory of development. Free Radical Biology and Medicine Vol. 6 No 6: Pages 631-661.
Anagnostopoulou MA., Kefalas P., Papageorgiou VP., Assimopoulou A.N. and Boskou, D. (2006) Radical scavenging activity of various extracts and fractions of sweet orange peel (Citrus sinensis). Food chemistry Vol. 94 No 1: Pages 19-25.
Antunes LMG. and Takahashi CS. (1998) Effects of high doses of vitamins C and E against doxorubicin-induced chromosomal damage in Wistar rat bone marrow cells. Mutation Research/Genetic Toxicology and Environmental Mutagenesis Vol. 419 No 1: Pages 137-143.
Benzie IF. (1996) An automated, specific, spectrophotometric method for measuring ascorbic acid in plasma (EFTSA). Clinical biochemistry Vol. 29 No 2: Pages 111-116.
Bierie B. and Moses HL. (2006) TGF-â and cancer. Cytokine & growth factor reviews Vol. 17 No 1: Pages 29-40.
Bowie JU., Luthy R. and Eisenberg D. (1991) A method to identify protein sequences that fold into a known three-dimensional structure. Science Vol. 253 No 5016: Pages 164-170.
Bradford MM. (1976) A rapid and sensitive method for the quantitation of microgram quantities of protein utilizing the principle of protein-dye binding. Analytical biochemistry Vol. 72 No 1-2: Pages 248-254.
Constam DB. and Robertson EJ. (1999) Regulation of bone morphogenetic protein activity by pro domains and proprotein convertases. The Journal of cell biology Vol. 144 No 1: Pages 139-149.
Derynck R. and Zhang YE. (2003) Smad-dependent and Smad-independent pathways in TGF-â family signalling. Nature Vol. 425 No 6958: Pages 577-584.
Drabsch Y. and Ten Dijke P. (2012) TGF-â signalling and its role in cancer progression and metastasis. Cancer and Metastasis Reviews Vol. 31 No 3-4: Pages 553-568.
Dubois CM., Laprise MH., Blanchette F., Gentry LE. and Leduc R. (1995) Processing of transforming growth factor 1 precursor by human furin convertase. Journal of Biological Chemistry Vol. 270 No 18: Pages 10618-10624.
Giannopolitis CN. and Ries SK. (1977) Superoxide dismutases I. Occurrence in higher plants. Plant physiology Vol. 59 No 2: Pages 309-314.
Gray AM. and Mason AJ., (1990) Requirement for activin A and transforming growth factor-b1 pro-regions in homodimer assembly. Science Vol. 247: Pages1328-1330.
Gunwant V., Raturi M., Hussain M. and Rana D. (2013) Marketing of sweet orange (Malta) in India. International Journal of Emerging Research in Management and Technology Vol. 3 No 2: Pages 45-49.
Hockenbery DM., Oltvai ZN., Yin XM., Milliman CL. and Korsmeyer SJ. (1993) Bcl-2 functions in an antioxidant pathway to prevent apoptosis. Cell Vol. 75 No 2: Pages 241-251.
Huang F. and Chen. YG. (2012) Regulation of TGF-â receptor activity. Cell & bioscience Vol. 2 No 1: Page 1.
Imamura T., Hikita A. and Inoue Y. (2012) The roles of TGF-âsignaling in carcinogenesis and breast cancer metastasis. Breast Cancer Vol. 19 No 2: Pages 118-124.
Kaur G., Alam MS., Jabbar Z., Javed K. and Athar M. (2006) Evaluation of antioxidant activity of Cassia siamea flowers. Journal of Ethnopharmacology Vol. 108 No 3: Pages 340-348.
Khan PK. and Sinha SP. (1993) Antimutagenic efficacy of higher doses of vitamin C. Mutation Research/Genetic Toxicology Vol. 298 No 3: Pages 157-161.
Khan, I.A. ed., 2007. Citrus genetics, breeding and biotechnology. CABI.
Kiss R., Sandor M. and Szalai FA. (2012) http://Mcule. com: a public web service for drug discovery. Journal of Cheminformatics Vol. 4: Pages 1-1.
Levy L. and Hill CS. (2006) Alterations in components of the TGF-â superfamily signaling pathways in human cancer. Cytokine & growth factor reviews Vol. 17 No 1: Pages 41-58.
Liithy R., Bowie JU. and Eisenberg D. (1992) Assessment of protein models with three-dimensional profiles. Nature Vol. 356 No 6364: Pages 83-85.
Liu TZ., Chin N., Kiser M. and Bigler, W. (1982) Specific spectrophotometry of ascorbic acid in serum or plasma by use of ascorbate oxidase. Clinical Chemistry Vol. 28 No 11: Pages 2225-2228.
Mallick N. and Khan RA. (2016) Antihyperlipidemic effects of Citrus sinensis, Citrus paradisi, and their combinations. Journal of Pharmacy & Bioallied Cciences, 8(2), p.112.
Manthey JA. and Grohmann K. (2001) Phenols in citrus peel by products. Concentrations of hydroxycinnamates and polymethoxylated flavones in citrus peel molasses. Journal of Agricultural and Food Chemistry Vol. 49 No7: Pages 3268-3273.
Marubayashi S., Dohi K., Ochi K. and Kawasaki T. (1986) Role of free radicals in ischemic rat liver cell injury: prevention of damage by alpha-tocopherol administration. Surgery, 99(2), Pages 184-192.
Massagué J. (2008) TGFâ in cancer. Cell Vol. 134 No 2: Pages 215-230.
Meulmeester E. and Ten Dijke P. (2011) The dynamic roles of TGF‐â in cancer. The Journal of pathology Vol. 223 No 2: Pages 206-219.
Miles DC., Wakeling SI., Stringer JM., Van den Bergen JA., Wilhelm D., Sinclair AH. and Western PS. (2013) Signaling through the TGF beta-activin receptors ALK4/5/7 regulates testis formation and male germ cell development. PloS one Vol. 8 No 1: Page 54606.
Nelson SM., Panagiotou OA., Anic GM., Mondul AM., Männistö S., Weinstein SJ., and Albanes D. (2016) Metabolomics analysis of serum 25-hydroxy-vitamin D in the Alpha-Tocopherol, Beta-Carotene Cancer Prevention (ATBC) Study. International Journal of Epidemiology, dyw148.
Padua D. and Massagué J. (2009) Roles of TGFâ in metastasis. Cell research Vol. 19 No 1: Pages 89-102.
Pandey N., Gupta B. and Pathak GC. (2012) Antioxidant responses of pea genotypes to zinc deficiency. Russian Journal of Plant Physiology Vol. 59 No 2: Pages 198-205.
Pickup M., Novitskiy S. and Moses HL. (2013) The roles of TGF [beta] in the tumour microenvironment. Nature Reviews Cancer Vol. 13 No 11: Pages 788-799.
Rafiq S., Kaul R., Sofi S A., Bashir N., Nazir F. & Nayik GA. (2016). Citrus peel as a source of functional ingredient: A review. Journal of the Saudi Society of Agricultural Sciences.
Sandhir R. and Gill KD. (1995) Effect of lead on lipid peroxidation in liver of rats. Biological trace element research Vol. 48 No 1: Pages 91-97.
Shibanuma M., Kuroki T. and Nose K. (1988) Induction of DNA-replication and expression of proto-oncogene cis-myc and cis-fos in quiescent balb/3t3 cells by xanthine xanthine-oxidase. Oncogene Vol. 3 No 1: Pages 17-21.
Siegel PM. and Massagué J. (2003) Cytostatic and apoptotic actions of TGF-â in homeostasis and cancer. Nature Reviews Cancer Vol. 3 No 11: Pages 807-820.
Sippl MJ. (1993) Recognition of errors in three‐dimensional structures of proteins. Proteins: Structure, Function, and Bioinformatics Vol. 17 No 4: Pages 355-362.
Slamon DJ., Clark GM., Wong SG., Levin WJ., Ullrich A. and McGuire WL. (1987) Human breast cancer: correlation of relapse and science Vol. 3798106 No 177: Page 235.
Stookey LL. (1970) Ferrozine—a new spectrophotometric reagent for iron. Analytical chemistry Vol. 42 No 7: Pages 779-781.
Tazat K., Hector-Greene M., Blobe GC. and Henis YI. (2015) TâRIII independently binds type I and type II TGF-â receptors to inhibit TGF-â signaling. Molecular biology of the cell, 26(19), pp.3535-3545.
Trott O. and Olson AJ. (2010) AutoDock Vina: improving the speed and accuracy of docking with a new scoring function, efficient optimization, and multithreading. Journal of computational chemistry Vol. 31 No 2: Pages 455-461.
Valvona CJ., Fillmore HL., Nunn PB. and Pilkington GJ. (2016) The Regulation and Function of Lactate Dehydrogenase A: Therapeutic Potential in Brain Tumor. Brain Pathology 26, no. 1: Pages 3-17.
Wallace AC., Laskowski RA. and Thornton JM. (1995) LIGPLOT: a program to generate schematic diagrams of protein-ligand interactions. Protein engineering Vol. 8 No 2: Pages 127-134.
Wallner B. and Elofsson A. (2003) Can correct protein models be identified?. Protein science Vol. 12 No 5: Pages 1073-1086.
Weydert CJ. and Cullen JJ. (2010) Measurement of superoxide dismutase, catalase and glutathione peroxidase in cultured cells and tissue. Nature protocols, 5(1), pages.51-66.
Wiederstein M. and Sippl M.J. (2007) ProSA-web: interactive web service for the recognition of errors in three-dimensional structures of proteins. Nucleic acids research Vol. 35 No suppl 2: Pages W407-W410.
Yang L., Pang Y. and Moses HL. (2010) TGF-â and immune cells: an important regulatory axis in the tumor microenvironment and progression. Trends in immunology Vol. 31 No 6: Pages 220-227.
Yu Y., Xiao CH., Tan LD., Wang QS., Li XQ. and Feng YM. (2014) Cancer-associated fibroblasts induce epithelial–mesenchymal transition of breast cancer cells through paracrine TGF-â signalling. British journal of cancer Vol. 110 No 3: Pages 724-732.
Zheng C., Fang Y., Tong W., Li G., Wu H., Zhou W., Lin Q., Yang F., Yang Z., Wang P. and Peng, Y. (2014) Synthesis and biological evaluation of novel tetrahydro-â-carboline derivatives as antitumor growth and metastasis agents through inhibiting the transforming growth factor-â signaling pathway. Journal of medicinal chemistry Vol. 57 No 3: Pages 600-612.

