Department of Information Technology and and *Department of Computer Science and Technology NIT Raipur, Raipur, Chhattisgarh, India
Corresponding author Email: psingh.cs@nitrr.ac.in
Article Publishing History
Received: 17/04/2017
Accepted After Revision: 27/06/2017
Clustering of genetic expression in accordance to delineation is very important. To explore co-systematizes gene groups whose collective samples are equal to the expressions used is one of the major work of gene clustering. In this regards, an efficient modified clustering algorithm is proposed for gene expression clustering. This algorithm forms the various samples of the data and groups into a number of clusters in accordance with their density. In order to achieve better clustering, we employed parameter tuning using differential evolution. The gene-gene class relevance is being optimized by differential evolution to find the efficient clusters. The performance of the algorithm is calculated with the study of some gene expression datasets and the validity measures. The proposed clustering algorithm has outperformed when compared to the average linkage method, Self-Organizing Map (SOM) and a recently developed weighted Chinese restaurant-based clustering method (CRC), for clustering gene expression data.
Clustering, Gene Clustering, Mutual Information, Validity Measures
Meshram P. A, Singh P. An Efficient Density-Based Algorithm for Clustering Gene Expressions. Biosc.Biotech.Res.Comm. 2017;10(3).
Meshram P. A, Singh P. An Efficient Density-Based Algorithm for Clustering Gene Expressions. Biosc.Biotech.Res.Comm. 2017;10(2). Available from: https://bit.ly/2XDJZ92
Introduction
The advancement of biological data analysis has made the study of gene expression data faster and more efficient. Biotechnology and intelligent informatics helped in extraction of knowledge form collection of a very large number of gene expressions of different times and conditions (Meagher 2002), (Searls 2000). Extracting patterns fromlarge amount of data is always a great problem and clustering is the primary solution. Clustering is an unsupervised learning process which divides the data into number of sample spaces N regions {C1,C2,…,CN} regards to specific similarity or dissimilarity parameter, where N is unknown (Bandyopadhyay et al. 2007). The main aim in partitional clustering is to obtain a N×m matrix U(Y) of a given data Y, having m objects, Y={y1,y2,…,ym}. To identify groups of co-regulated genes groups clustering is extensively used on gene expression data. Different unsupervised clustering techniques such as hierarchical clustering (Herrero et al. 2001) (Wang et al. 2007) k-means algorithm (Heyer et al. 1999), self-organizing map (Wang et al. 2007)(Tamayo et al. 1999), and principal component analysis (Yeung & Ruzzo 2001)have been widely used to find patterns of genes from microarray data. The hierarchical clustering identifies sets of correlated genes with similar behavior across the samples, but clusters in a tree-like structure, which makes the identification of functional groups very difficult (Herrero et al. 2001) (Wang et al. 2007).
In contrast, self-organizing map (Heyer et al. 1999 and Tamayo et al. 1999) and k-means algorithm (Heyer et al. 1999) require a prespecified number and an initial spatial structure of clusters, but this may be hard to come up with in real problems. However, these algorithms usually fail to reveal functional groups of genes that are of special interest in sample classification as the genes are clustered by similarity only, without using any information about the sample categories or class labels (Dettling & Bühlmann 2002) (Ben-Dor Shamir 1999). Clustering conglomerates the like input patterns to definite, and similar subsets having mutual inclusion are termed as clusters (Xiao et al. 2003). Genes with identical changes in expressions are kept into separate clusters in order to perform genome clustering. By considering a mapping schemewe appoint a label to every gene and the motive of clustering is applicable to this mapping scheme i.e. to assign each gene to a specific group.
There has been a significant growth in research in the last decades of clustering and various clustering technologies have been developed, (Li & Tian 2007, Nakamura & Kehtarnavaz 1998, Frossyniotis et al. 2004) . Due to the special characteristics of the gene data a special study is dedicated to the genome data clustering.Density Based Spatial Clustering Applications with noise is the most used clustering algorithm for density clustering. By giving a certain density threshold the linked regions are identified with respect to the threshold. Density based hierarchical clustering algorithm (DHC) using time series proposed by Jiang in 2003 (Jiang & Zhang 2003). A new version of K-means was developed by Barigov and Mardaneh, called an incremental algorithm for gene clustering (Bagirov & Mardaneh 2006). Another technique using K-means was proposed and given the name GAGR (Chang et al. 2009). Zhihua in 2008 proposed a variant of PSO particle swarm optimization called PK-means by combining the two techniques K-means and the particle–pair optimizer in order to cluster the GE data (Bagirov & Mardaneh 2006). GO Fuzzy a semi-supervised technique proposed by Tari in 2009 (Bagirov & Mardaneh 2006). Juan A Nepomuceno proposed a new evolutionary clustering technique in 2011 to cluster gene expression data name bi-clustering with the help of gene correlation based searching techniques(Nepomuceno et al. 2011). A hybridized fuzzy algorithm named HFCEF a framework developed for detecting tumor data was proposed by Zhiwen Yu in 2013 using biomolecular data (Yu et al. 2013).
Yiyi Liu proposed a new technique in 2014 to identify cancer subtypes based expression datasets which accessed gene network information to perform clustering (Liu et al. 2014). Shudong Huang proposed a spectral clustering algorithm named SCCE spectral co-clustering ensemble algorithm, in 2015 to apply multiple based co-clustering algorithms on various datasets (Huang et al. 2015) on a single platform. Recently Xianxue Yu, proposed a new technique in 2017 to cluster gene expression cancerous datasets with the help of projective ensemble clustering named PCE (Yu et al. 2017).
There are lot of clustering techniques but DBSCAN is the most used clustering algorithm for large data than other algorithms (Ester et al. 1996). Most of the techniques mentioned above don’t meet the requirements of efficient clustering of gene data, due to the constantly changing characteristics of the microarray data. Considering all these issues, we propose, here, an efficient DBSCAN method which provides better genes groups clustering. The rest of the paper is arranged as follows. In Section 2, elaborates the Materials and Methods. The Results and Discussion in Section 3. And Section 4 concludes the paper.
Material and Methods
In this section, we have used 2 gene datasets and implemented them using our new proposed algorithm with the help of MATLAB 2016a. The implementation process was carried onto Intel core i3 processor with 4GB RAM and 500GB hard disk space, running on Windows 10 platform. The results obtained from the proposed algorithm proved to be efficient in terms of validity indexes. Adjusted rand index (ARI) and Jaccard Index (JI) are used as the main parameter for checking the efficiency of the algorithm. The value of the average of compactness is varying between the range 0 to1 and the more the value tends towards 0 the compactness leads to good clustering and if the value of the average of compactness tends to 1 the compactness leads to bad clustering which is clarified by the values of other measures.
Gene Datasets
The gene datasets used in this paper are real life data set namely yeast sporulation data and ratCNS central nervous system dataset.
Yeast Sporulation data: The dataset consists of sporulation process genes of the budding yeast consisting of 6118 genes. The dataset is available on the following website: http://cmgm.stanford. edu/pbrown/sporulation. From the total 6118 genes, the genes which didn’t change during the sporulation process are not considered. The final set consists of 474 genes for the clustering.
RatCNS: The dataset consists of expression level of the central nervous system development of rat which consists of 112 genes over 9 time points. The data is easily available on the following website: http://staff.washington.edu/kayee/cluster. To obtain a good data for clustering the dataset is normalized in such a manner that each row is having mean 0 and variance 1(Ka Yee Yeung, David R. Haynor n.d.).
DBSCAN is one of the most commonly clustering algorithm based on a density-based notion of clusters, DBSCAN is able to generate clusters of arbitrary shapes efficiently. DBSCAN accomplishes the clustering process by starting from an arbitrary point X unvisited, DBSCAN retrieves all points in the Eps neighbourhood of X. Then try finding all the density-reachable points to the point X by considering the eps and minpts. If the selected point is the core point then the cluster formation is complete in according to the input parameters. Now we check the border points by checking that no point is density-reachable from the point X, which become a new point and start again with the whole process. Even the slightest of change in the values of the input parameters can lead to the great changes in the clustering results. As in the complete process of the DBSCAN algorithm, a single point is visited multiple times, its time complexity is O (N 2). By considering the density connectivity and the density reachability we could easily determine the working of DBSCAN. The values of both the density functions depend on the two input parameters eps and minpts where eps can be called as the radius defined to plot the cluster and the minpts are the minimum criteria which are used to form a cluster. Finding the appropriate value of eps and minpts is a challenging task. We have introduced a new concept for getting the optimal value of eps and minpts in efficient way. The differential evolution based parameter optimization for cluster compactness improvement. The details of DE based parameter optimization is discussed below.
Differential Evolutions
A new algorithm in evolutionary computing proposed by Storn in 1977 for optimizing continuous spaces globally (Storn & Price 1997). The overall genetic algorithm structure is in resemblance with (D.E.) Differential Evolutions (Zou et al. 2013) (Marco Locatelli, Mirko Maischberger 2014). Three basic operations such as mutation, crossover, and selection are performed in DE. Mutation is the most important operation in DE, its work is to generate new population elements, in order to obtain anoptimum solution in accordance with the objective function (Yang Lou, Junli Li n.d.) (Chi 2009). In our scenario we have used average compactness as the objective function as it is one of the suitable cluster validity measure for density based clustering.
Time Complexity: Time complexity of the proposed algorithm is where Iteration- is the number of DE iteration. Population, number of individuals, complexity of DBSCAN algorithm and n, number of data objects in the datasets
For calculating the efficiency of the algorithm we have used validity indexes as the parameters for checking its efficiency, in it we used to adjust the Rand index, Jaccard Index, Average of Compactness as the quality measures of the proposed algorithm.
Average of Compactness
An internal measure based on the compactness of all clusters which is used to measure the quality of clustering called as the average of compactness(Zaït & Messatfa 1997). The lower value of average compactness will provide the higher quality of clustering.
Adjusted Rand Index (ARI)
The adjusted Rand index is the corrected for chance version of the Rand index(Rand & Rand 2016).Though the Rand Index may only produce a value among 0 and +1, the adjusted Rand index can produce negative values if the index is less than the predictable index(Wagner & Wagner 2007). If we have the result of clustering algorithm R and the known classes L then the ARI can be calculated in the following way. Let x, y, z and u be the gene pairs in the same clusters related to both R and L, clusters related to R and not L, clusters related to L, not R and the clusters not related to both R and L. The Adjusted Rand Index, is
![]()
Jaccard Index (JI)
The formula to calculate jaccard index is given below it is a similarity measurement technique through which we check the similarity between the expected(calculated) and the actual number of clusters.
(If A and B are both empty, we define J (A, B) = 1.)
This distance is a metric on the collection of all finite sets (Lipkus 1999).
Results and Discussion
In this section two datasets are implemented with our proposed algorithm by optimizing the eps and minpts with the objective function average of compactness (Cavg). After getting the desired/ optimized value of the minpts and eps we have used those parameters to get the external measures such as ARI, and JI as the quality of measurement and to check the efficiency of the proposed system. The number of clusters formed by the proposed algorithm is given in table 1 and it can be seen that our proposed algorithm is identifying same number of clusters in each dataset. The results of the proposed algorithm with number of DE iterations are in terms of average compactness is shown in table 2. Figure1 and figure 2 shows the variations in the formation of clusters in both the data sets at various iterations.
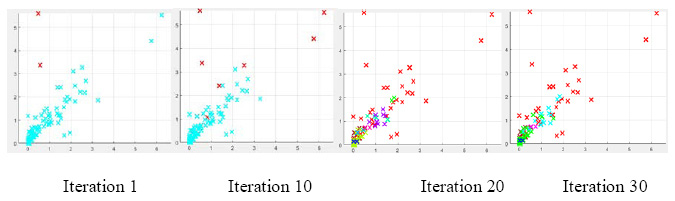 |
Figure 1 |
 |
Figure 2: Variations in Yeast dataset at various iterations |
| Table 1: Number of clusters obtained by the proposed algorithm | ||
| Yeast | RatCNS | |
| Original Clusters | 10 | 6 |
| Obtained Clusters | 10 | 6 |
| Table 2: Result of Proposed algorithm | ||
| Dataset
Algorithm |
Yeast | RatCNS |
| Our | 0.9800 | 0.5560 |
| SiMM-TS | 0.6353 | 0.5147 |
| IFCM | 0.4717 | 0.4032 |
| VGA | 0.5800 | 0.4542 |
| Average Link | 0.5007 | 0.3684 |
| SOM | 0.5842 | 0.4134 |
| CRC | 0.5675 | 0.4455 |
We compared our method with the previous algorithms and results reported by Bandyopadhyay (Bandyopadhyay et al. 2007) and found that the proposed algorithm clusters more effectively than the previously reported algorithms in terms of ARI. The observed values for our algorithm on yeast gene expression is 0.9800 and on ratCNS is 0.5560 for ARI. The comparative results vSiMM-TS, IFCM, VGA, Average Link SOM and CRC are shown in table 3 .Figure 3 and Figure 4 shows the graphical outputs of the indexes and the datasets with respect to the number of iterations on validity indexes ARI, JI and Cavg respectively. Figure 5 shows the comparative graph with proposed method on the basis of ARI index obtained from six algorithms.
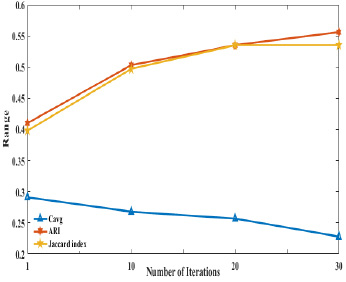 |
Figure 3: Variations in RatCNS dataset at different number of iterations |
 |
Figure 4: Variations in Yeast dataset at different intervals |
 |
Figure 5: Comparitive graph for the variations in the dataset with respect to ARI in all the algorithms compared |
| Table 3: Comparison of gene datasets for various algorithms with respect to ARI. | ||||||
| Dataset | Eps | Minpts | Itr | Proposed Algorithm | ||
| Cavg | ARI | JI | ||||
|
RatCNS |
12.58 | 3 | 1 | 0.291 | 0.41 | 0.398 |
| 2.901 | 10 | 10 | 0.268 | 0.503 | 0.497 | |
| 0.84 | 2 | 20 | 0.257 | 0.535 | 0.535 | |
| 0.89 | 2 | 30 | 0.228 | 0.556 | 0.532 | |
|
Yeast |
29.46 | 5 | 1 | 0.200 | 0.222 | 0.222 |
| 0.198 | 4 | 10 | 0.123 | 0.775 | 0775 | |
| 0.19 | 4 | 20 | 0.113 | 0.918 | 0.905 | |
| 0.20 | 2 | 30 | 0.10 | 0.98 | 0.915 | |
Conclusion
A modified DBSACN which works without providing the parameter eps and minpts is proposed in order to reduce the complexity of the DBSCAN algorithm and make it efficient. The algorithm proposed is tested on real life gene expression data sets. The results obtained with the objective of minimization of average compactness are compared to the existing algorithm in terms of the ARI and JI validity measures. In general it is found that the MDBSCAN clustering algorithm outperforms all the other clustering methods significantly. This algorithm provides the parameter optimization to remove the major drawback of conventional DBSCAN. Furthermore, we will study the selection of the automatic parameter estimation model from the theoretical
aspect.
References
- Bagirov, A. & Mardaneh, K., 2006. Modified global k-means algorithm for clustering in gene expression data sets. Proceedings of the 2006 workshop on, (4), pp.1–6. Available at: http://portal.acm.org/citation.cfm?id=1274172.1274176.
- Bandyopadhyay, S., Mukhopadhyay, A. & Maulik, U., 2007. An improved algorithm for clustering gene expression data. Bioinformatics, 23(21), pp.2859–2865.
- Ben-Dor A, Shamir R, Y.Z., 1999. Clustering Gene Expression Patterns. Computational Biology, 4, pp.281–97.
- Chang, D.-X., Zhang, X.-D. & Zheng, C.-W., 2009. A genetic algorithm with gene rearrangement for K-means clustering. Pattern Recognition, 42, pp.1210–1222.
- Chi, Y.A.; H., 2009. Experimental Study on Differential Evolution Strategies. IEEE Intelligent Systems, 2009. GCIS ’09. WRI Global Congress on.
- Dettling, M. & Bühlmann, P., 2002. Supervised clustering of genes. Genome biology, 3(12), p.RESEARCH0069.
- Ester, M. et al., 1996. A Density-Based Algorithm for Discovering Clusters in Large Spatial Databases with Noise. Proceedings of the 2nd International Conference on Knowledge Discovery and Data Mining, pp.226–231.
- Frossyniotis, D., Likas, A. & Stafylopatis, A., 2004. A clustering method based on boosting. Pattern Recognition Letters, 25(6), pp.641–654.
- Herrero, J., Valencia, a & Dopazo, J., 2001. A hierarchical unsupervised growing neural network for clustering gene expression patterns. Bioinformatics (Oxford, England), 17(2), pp.126–136.
- Heyer, L.J., Kruglyak, S. & Yooseph, S., 1999. Exploring Expression Data : Identification and Analysis of Coexpressed Genes Exploring Expression Data : Identification and Analysis of Coexpressed Genes. , (213), pp.1106–1115.
- Huang, S. et al., 2015. Spectral co-clustering ensemble. Knowledge-Based Systems, 84, pp.46–55. Available at: http://dx.doi.org/10.1016/j.knosys.2015.03.027.
- Jiang, D. & Zhang, A., 2003. DHC: a density-based hierarchical clustering method for time series gene expression data. Third IEEE Symposium on Bioinformatics and Bioengineering, 2003. Proceedings., pp.393–400. Available at: http://ieeexplore.ieee.org/lpdocs/epic03/wrapper.htm?arnumber=1188978.
- Ka Yee Yeung, David R. Haynor, W.L.R., Validating Clustering for Gene Expression Data. Available at: http://staff.washington.edu/kayee/cluster.
- Li, X. & Tian, Z., 2007. Optimum cut-based clustering. Signal Processing, 87(11), pp.2491–2502.
- Lipkus, A.H., 1999. A proof of the triangle inequality for the Tanimoto distance. , 26, pp.263–265.
- Liu, Y. et al., 2014. A network-assisted co-clustering algorithm to discover cancer subtypes based on gene expression. BMC bioinformatics, 15(1), p.37. Available at: http://www.biomedcentral.com/1471-2105/15/37.
- Marco Locatelli, Mirko Maischberger, and F.S., 2014. No Title. Differential evolution methods based on local searches. Computers & Operations Research, 43:169–180, 2014.
- Meagher, R.B., 2002. Post-genomics Networking of Biotechnology for Interpreting Gene Function. Current Opinion in Plant Biology, 5(2), pp.135–140. Available at: http://dx.doi.org/10.1016/S1369-5266(02)00245-5.
- Nakamura, E. & Kehtarnavaz, N., 1998. Determining number of clusters and prototype locations via multi-scale clustering. Pattern Recognition Letters, 19(14), pp.1265–1283. Available at: http://www.sciencedirect.com/science/article/pii/S0167865598000993.
- Nepomuceno, J.A., Troncoso, A. & Aguilar-Ruiz, J.S., 2011. Biclustering of gene expression data by correlation-based scatter search. BioData mining, 4(1), p.3. Available at: http://www.pubmedcentral.nih.gov/articlerender.fcgi?artid=3037342&tool=pmcentrez&rendertype=abstract.
- Rand, W.M. & Rand, W.M., 2016. Objective Criteria for the Evaluation of Clustering Methods Objective Criteria for the Evaluation of Clustering Methods. , 66(336), pp.846–850.
- Searls, D.B., 2000. Using Bioinformatics in Gene and Drug Discovery. Drug Discovery Today, 5(4), pp.135–143.
- Storn, R. & Price, K., 1997. Differential Evolution – A Simple and Efficient Heuristic for global Optimization over Continuous Spaces. Journal of Global Optimization, 11(4), pp.341–359. Available at: http://dx.doi.org/10.1023/A:1008202821328.
- Tamayo, P. et al., 1999. Interpreting patterns of gene expression with self-organizing maps: methods and application to hematopoietic differentiation. Proceedings of the National Academy of Sciences of the United States of America, 96(6), pp.2907–2912.
- Wagner, S. & Wagner, D., 2007. Comparing Clusterings – An Overview. , (1907), pp.1–19.
- Wang, H., Zheng, H. & Azuaje, F., 2007. Poisson-based self-organizing feature maps and hierarchical clustering for serial analysis of gene expression data. IEEE/ACM transactions on computational biology and bioinformatics / IEEE, ACM, 4(2), pp.163–75. Available at: http://www.ncbi.nlm.nih.gov/pubmed/17473311.
- Xiao, X. et al., 2003. Gene clustering using self-organizing maps and particle swarm optimization. Parallel and Distributed Processing Symposium, 2003. Proceedings. International, 0(C), p.10–pp. Available at: http://ieeexplore.ieee.org/xpls/abs_all.jsp?arnumber=1213290.
- Yang Lou, Junli Li, and Y.W., A Binary-Differential Evolution algorithm based on Ordering of individuals. IEEE Natural Computation (ICNC), 2010 Sixth International Conference on.
- Yeung, K.Y. & Ruzzo, W.L., 2001. Principal component analysis for clustering gene expression data. Bioinformatics, 17(9), pp.763–774. Available at: http://www.cs.washington.
- Yu, X., Yu, G. & Wang, J., 2017. Clustering cancer gene expression data by projective clustering ensemble. Plos One, 12(2), p.e0171429. Available at: http://dx.plos.org/10.1371/journal.pone.0171429.
- Yu, Z. et al., 2013. for Tumor Clustering from Biomolecular Data. , 10(3), pp.657–670.
- Zaït, M. & Messatfa, H., 1997. A comparative study of clustering methods. Future Generation Computer Systems – Special double issue on data mining, Volume 13(Issue 2-3), p.Pages 149-159.
- Zou, D. et al., 2013. A modified differential evolution algorithm for unconstrained optimization problems. Neurocomputing, 120, pp.469–481.

