1School of Physiotherapy, Delhi Pharmaceutical Sciences and Research University, New Delhi, India
2Faculty of Allied Health Science, N&D Department, MRIIRS, Faridabad, Haryana, India.
3CTVS Department, AIIMS, New Delhi, India.
Corresponding author email: mkumar.physio@gmail.com
Article Publishing History
Received: 20/04/2021
Accepted After Revision: 28/06/2021
Foot is a segment which is in contact with the ground and bears body weight, its posture can be affected by changes that may occur within the body itself or from the effect of external environment. Postural imbalance can be caused by changes in the feet, arising mainly from the different alignment of the body posture. A higher body mass index with weak musculature may lead to collapse of the foot arches due to extra forces on the arches and consequently weakness of the respective muscles. This notably changes the contiguity area of the arches of the feet with the ground surface. Also, another important factor is that the Quadriceps angle, which is the angle of pull of the quadriceps muscle, may get altered with faulty alignment of the lower limb arising from the biomechanical changes in flat feet. The aim of the present study is to disinter correlation between Navicular drop and Q- angle amongst normal & overweight middle-aged individuals. A total of 150 subjects were recruited with 75 subjects in each two groups formed on the basis of BMI indexes as group A (Normal with BMI score 17.5 – 22.99) and Group B (Overweight with BMI score 23-27.99).
Quadriceps angle and Navicular Drop Test were measured using goniometer method and Brody’s method respectively and correlation between Q angle and Navicular drop was evaluated thereafter in both the groups. The result of the study demonstrated that there is statistically significant positive correlation between navicular drop test and Quadriceps angle in both the groups with slightly stronger association in overweight group (r=0.82(rt) and 0.77 (lf) at p=0.05). The lower limbs joints work in a kinematic chain where malalignment at one joint affect other, has been a well-established fact. With our study we have tried to fill in the gap of knowledge regarding the effect of increasing body weight on the relationship between Q angle and Navicular drop. The future modifications in guidelines for management of important knee and ankle conditions like knee OA, ankle sprain etc should definitely use this relationship as an important assessment and management tool, especially for overweight individuals, to achieve maximal improvements in patients.
Navicular Drop, Overweight, Quadriceps Angle.
Kumar M, Sanghi D, Arya P, Kataria J. A Correlation Between Navicular Drop and Quadriceps Angle Amongst Normal and Overweight Middle-Aged Individuals. Biosc.Biotech.Res.Comm. 2021;14(2).
Kumar M, Sanghi D, Arya P, Kataria J. A Correlation Between Navicular Drop and Quadriceps Angle Amongst Normal and Overweight Middle-Aged Individuals. Biosc.Biotech.Res.Comm. 2021;14(2). Available from: <a href=”https://bit.ly/2TvKGk3“>https://bit.ly/2TvKGk3</a>
Copyright © This is an Open Access Article distributed under the Terms of the Creative Commons Attribution License (CC-BY). https://creativecommons.org/licenses/by/4.0/, which permits unrestricted use distribution and reproduction in any medium, provided the original author and sources are credited.
INTRODUCTION
Posture is defined as “the position in which someone holds their body upright against gravity while standing, sitting or lying down”. Posture and its anomalies can be linked to different types of activities associated with mankind like walking and other activities of daily living, which can be affected by any abnormal changes in the body posture (Borges et al. 2013). As foot is a segment which is in contact with the ground and bears body weight, so foot posture can be affected by changes that may occur from the body itself or from the effect of external environment. Postural imbalance can be caused by changes in the feet, arising mainly from the different alignment of the body posture (Eldesoky and Abutaleb 2015 Raizada etal 2019).
Sedentary lifestyles, food habits with high content of fat and calories intake lead to increase in Body Mass Index (BMI). Stress level of the individual also lead to increase in body weight. With ageing, there is reduction in muscle mass and metabolism that may lead to gain in the body weight. A higher body mass index with weak musculature may lead to collapse of the foot arches due to extra forces on the arches and consequently weakness of the respective muscles. This notably changes the contiguity area of the arches of the feet with the ground surface (Chougala et al. 2015). Modifications in the arches of the feet can lead to different biomechanical alteration in the feet posture. It is characterized by valgus alignment of the calcaneum leading to tibial internal rotation with collapse of the medial longitudinal arch and forefoot moving into abduction.
Also, another important factor is that the Quadriceps angle, which is the quadriceps muscle’s angle of pull, may get altered with faulty alignment of the lower limb arising from the biomechanical changes in flat feet (Letafatkar et al. 2013; Chougala et al. 2015). Exaggerated foot pronation led to internal rotation of the lower extremity and may result in knee valgus with increase in Q-angle (Heggannavar et al. 2016). As the feet are important weight bearing elements of the body, increase body weight can lead to changes in the arches of the feet structure and may affect another important biomechanical factor like Q-Angle (Omololu et al. 2009; Freedman et al. 2014; Heggannavar et al. 2016; Park and Park 2018 Raizada etal 2019).
There is paucity of the study on Indian population about biomechanical alteration in the kinematic chain segments of the lower limb associated with navicular drop and Q-Angle with increase in body mass. The purpose of the study is to assess the relationship between Navicular drop and Q angle amongst different BMI indexes in middle aged individuals and also to analyse the effect of increasing body weight on their relationship.
MATERIAL AND METHODS
A Correlational study was conducted on 60 subjects which were divided in 2 groups with 30 subjects in each group formed on the basis of Asian classification of BMI as measurement index (BMI = Weight in Kg/Height in m2), Group A as Normal group (BMI score 17.5 to 22.99) and Group B as Overweight group (BMI score 23 to 27.99). Both males and females between 25-45 years were included in the study. Outcome measures used were Quadriceps angle and Navicular drop test. Potential subjects were apprised of the procedure and its benefits. Prior to testing, the subjects were familiarized with the testing procedure. Those fulfilling the criteria were explained in detail about the study and a written informed consent, in their preferred language, was obtained from the subjects willing to participate. Navicular drop test and Q-angle measurement were done through Brody’s method and Goniometer method in standing respectively for all the subjects in two groups. Descriptive data were also taken for all the subjects (Park and Park 2018).
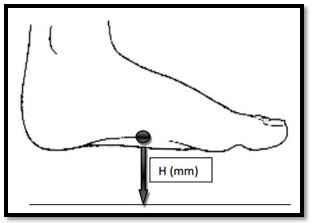
For navicular drop measurement the subtalar neutral position was maintained and the most prominent point of the navicular tubercle was identified and marked with a pen with the subject in a sitting position having their feet in contact with the ground. Subtalar neutral position was checked by palpating the talus bone and ensuring equal medial and lateral talar depressions. The index card was positioned, on the inner aspect of the hind foot, perpendicular to the floor crossing the navicular bone. The height of the most prominent point of the navicular tubercle was indicated on the card. The same procedure was repeated with the subjects in standing position maintaining the neutral position of the subtalar joint. At last, the difference between the original height of the navicular tubercle’s most prominent point in sitting and standing positions was measured for both the foot with the help of measuring tape in millimetres as shown in figure 1.
Navicular drop when measured less than 10 mm are categorized as normal and more that 10 mm are categorized as abnormal (Deng et al. 2010; Park and Park 2018).
Figure 1: Navicular Height
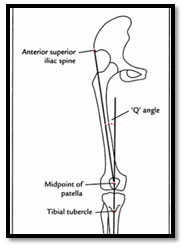
Q-angle was measured using a standard full circle goniometer. The right and left side angles were measured with subject in standing position. The ASISs, tibial tuberosity, and assessed midpoint of the patella as shown in figure 2 were palpated and marked prior to measurement with the help of removable adhesive stickers. The fulcrum of the goniometer was placed on the centre of the patella. The bottom arm was directed towards tibial tuberosity. The upper arm was directed along the anterior superior iliac spine. The Q-angle in degree was thus measured on both sides (Raizada et al. 2019).
Figure 2: Surface landmarks for measuring Q-Angle
RESULTS AND DISCUSSION
The statistical analysis was done using SPSS (version 21). Mean and standard deviation were obtained for all dependent variables. Data was analysed by taking out mean, standard deviation of the Navicular Drop test and Q angle. Correlation of navicular drop and Q Angle of right and left was evaluated and then represented by scatter graphs for each group.
Table 1. Mean and Standard Deviation of variables in Normal & Overweight groups
| Age (Mean±SD) | |||
| Normal Group | 36.67±8.40 | ||
| Overweight Group | 34.9±7.18 | ||
| Weight (Mean±SD) | Height (Mean±SD) | BMI (Mean±SD) | |
| Normal Group | 60.5±7.87 | 164.23±9.81 | 22.39±1.93 |
| Overweight Group | 72.13±5.98 | 165.48±6.07 | 26.44±1.16 |
| rt NDT (Mean±SD) | lt NDT (Mean±SD) | ||
| Normal Group | 6.6±1.35 | 6.56±0.97 | |
| Overweight Group | 10.53±1.30 | 11±1.55 | |
| rt Q angle (Mean±SD) | lt Q angle (Mean±SD) | ||
| Normal Group | 14±1.91 | 13.93±1.63 | |
| Overweight Group | 16.8±1.84 | 16.86±1.97 |
Table 1 showing descriptive data of Normal group and Overweight groups respectively. Mean value of NDT and Q-Angles in both the foot was found to be greater in overweight group in comparison to normal group.
Figure 3: Mean comparison of weight, height & BMI in Normal & Overweight Groups
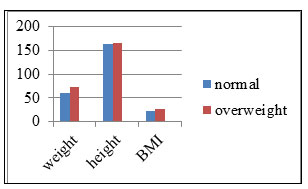
Figure 4: Mean Comparison of Right & Left NDT in Normal & Overweight Groups
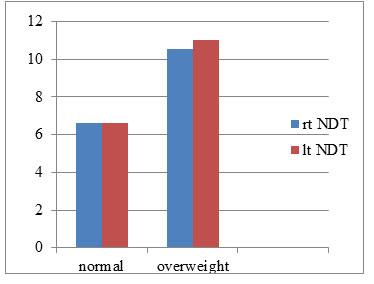
Figure 5: Mean comparison of Right & Left Q-Angle in Normal & Overweight Groups
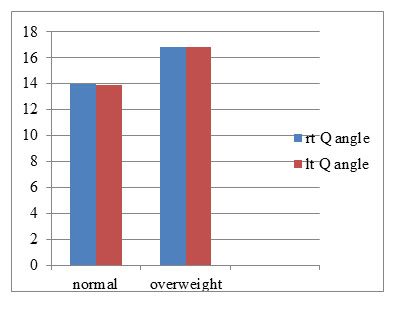
Graph 1 showing the mean values of age, weight, height and BMI in both the groups. Graph 2 showing the mean values of Right & Left NDT in both the groups and Graph 3 showing the mean values comparison of Right & Left Q-Angles among normal and overweight individuals. Mean values of NDT were 6.6±1.35 (right) & 6.56±0.97 (left) in normal group and 10.53±1.30 (right) & 11±1.55 (left) in overweight group respectively. Mean values of Q-Angles right and left were 14±1.91& 13.93±1.63and 16.8±1.84& 16.86±1.97 in normal and overweight groups respectively.
Correlation Analysis
Group A (Normal)
Table 2. Showing positive correlation between Right NDT and Right Q-Angle significant at p<0.05
| Rt Q angle | ||
| Rt NDT | Karl Pearson coefficient of Correlation ( r) |
0.77 |
| t value | <0.00001 | |
| p value | <0.05 | |
Table 3. Showing positive correlation between Left NDT and Left Q-Angle significant at p<0.05
| Left Q angle | ||
| Left NDT | Karl Pearson coefficient of Correlation ( r) |
0.67 |
| t value | <0.00001 | |
| p value | <0.05 | |
Table 2 and 3 showed positive significant correlation between NDT and Q-Angle in both the foot with r value of 0.77 at p<0.05 (NDT Right & Q-Angle Right) and 0.67 at p<0.05 (NDT Left & Q-Angle Left) in Normal Group.
Figure 6: Correlation between Right NDT & Right Q-Angle in Normal subjects
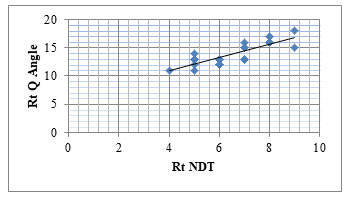
Figure 7: Correlation between Left NDT & Left Q-Angle in Normal subjects
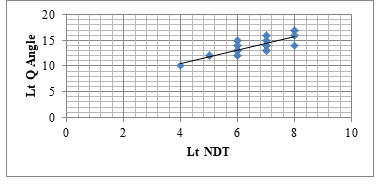
The correlation graphs 4 & 5 of the result showed a positive significant correlation between flat foot and Q-Angle in middle aged individuals with body weight categorised as normal, at p<0.05.
Group B (Overweight)
Table 4. Showing positive correlation between Right NDT and Right Q-Angle significant at p<0.05
| Rt Q angle | ||
| Rt NDT | Karl Pearson coefficient of Correlation ( r) |
0.82 |
| t value | <0.00001 | |
| p value | <0.05 | |
Table 5. Showing positive correlation between Right NDT and Right Q-Angle significant at p<0.05
| Left Q angle | ||
| Left NDT | Karl Pearson coefficient of Correlation ( r) |
0.77 |
| t value | <0.000046 | |
| p value | <0.05 | |
Table 4 and 5 showed positive significant correlation between NDT and Q-Angle in both the foot with r value of 0.82 at p<0.05 (NDT Right & Q-Angle Right) and 0.77 at p<0.05 (NDT Left & Q-Angle Left) in Overweight Group. There was slight stronger correlation in overweight individuals in comparison to normal group subjects.
Figure 8: Correlation between Right NDT & Right Q-Angle in Overweight subjects
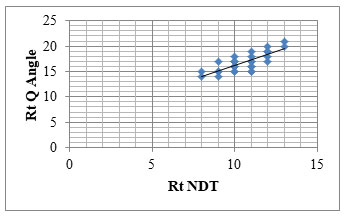
Figure 9: Correlation between Left NDT & Left Q-Angle in Overweight subjects
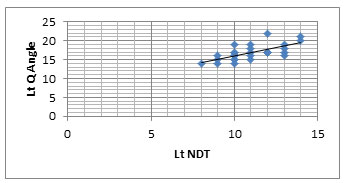
The correlation graphs 6 & 7 of the result showed a positive significant correlation between flat foot and Q-Angle in middle aged individuals with body weight categorised as overweight, at p<0.05. In addition, graphs 6 & 7 showed more stronger positive significant correlation between NDT and Q-Angle amongst overweight middle aged individuals, at p<0.05. So, the result exhibited that with increase in body weight, there was more navicular drop among overweight individuals leading to increase in Q-Angle also. Our inference about a greater Q-angle could be prognosticated by increased navicular drop was supported by preceding studies that delineated about association of an exaggerated pronation with internal rotation of the lower extremity and raised knee valgus and is therefore indicated to result in greater Q angle (Nguyen et al. 2009; Almeida et al. 2016).
Our findings are in line with the result of these studies. There was statistically significant positive correlation in both the groups between Quadriceps angle and NDT with slightly stronger association found in overweight group. One possible explanation for slightly stronger relationship among variables in overweight group is that increase bodyweight give rise to elevated loading of the foot mechanically, thus leading to collapse of medial longitudinal arch of the foot, which is followed by out-toeing and increased foot pronation (Chougala et al. 2015) In addition, when foot is functioning biomechanically with persistent pronation, it result in excessive internal rotation of the entire lower limb (Almeida et al. 2016).
This stress due to excessive internal rotation of the leg may upshot to viable mechanical problems around the knee, including increase pull of quadriceps muscle laterally (Cote et al. 2005). Hamstra-Wright et al. (2015) supported the findings of the present study as they specified that a raised BMI and alteration in the posture of the foot must be taken into account in order to manage medial tibial stress syndrome. A study disclosed that there is significant positive correlation between BMI & Q-angle which arrives in accord with our study results. Therefore, there was a slightly stronger correlation between Q angle and NDT in overweight group and the level of arch drop and Q-angle was also greater in fatter individuals (Hamstra-Wright et al. 2015; Prakash et al. 2017).
These results are complimented by a study performed by Kim et al. (2010) showed that there exist significant correlations among navicular drop and quadriceps angle (p<.05), and internal rotation of hip (p<.05) and concluded that navicular drop has a viable effect on biomechanical arrangement of the lower limb. So, there is need to take into account the biomechanical alignment of the entire lower limb rather than a single factor, as there is potential for one mechanical factor to compensate for or affected by another (Kim et al. 2010; Prakash et al. 2017).
CONCLUSION
The lower limb joints work in a kinematic chain where mal-alignment at one joint affect other and has been a well-established fact. With our study we have tried to fill in the gap of knowledge regarding the effect of increasing body weight on the relationship between Q angle and Navicular drop. The future modifications in guidelines for management of important knee and ankle conditions like knee OA, ankle sprain etc should definitely use this relationship as an important assessment and management tool, especially for overweight individuals, to achieve maximal improvements in patients.
Conflict of Interests: There was no conflict in the interests of participating authors.
Ethical Statement: It is to inform you that on the recommendations of Departmental Research Committee Board of Study made on 19.08.2015, the Academic Council of this University in its meeting held on 24.12.2015 vide agenda item no. 17.3 has approved to register Mr. Manish Kumar S/o Mr. Pashupati Nath for Ph.D programme of this University w.e.f. 24.12.2015 in the broad area/ topic of research Relationship Between Pelvic Tilt, Body Mass Index And Changes In The Plantar Arch In Middle Aged Individual in the Faculty of Applied Sciences under the supe sion of Dr. Divya Sanghi, Asst. Prof. – FAS, MRIU. The final topic of research will have to t finalized at the time of pre-submission seminar of thesis. His registration no. is 15/Ph.D/002.
REFERENCES
Almeida, GPL, Carvalho, A.P.D.M.C., França, F.J.R., Magalhães, M.O., Burke, T.N. and Marques, A.P., (2016). Q-angle in patellofemoral pain: relationship with dynamic knee valgus, hip abductor torque, pain and function. Revista Brasileira de Ortopedia (English Edition), 51(2):181-186.
Borges, CDS, Fernandes, LFRM and Bertoncello, D, (2013). Relationship between lumbar changes and modifications in the plantar arch in women with low back pain. Acta ortopedica brasileira, 21(3):135-138.
Chougala, A, Phanse, V, Khanna, E and Panda, S, (2015). Screening of body mass index and functional flatfoot in adult: an observational study. Int J Physiother Res, 3(3):1037-41.
Cote, KP, Brunet, ME, II, BMG and Shultz, SJ, (2005). Effects of pronated and supinated foot postures on static and dynamic postural stability. Journal of athletic training, 40(1):41.
Deng, J, Joseph, R and Wong, CK, (2010). Reliability and validity of the sit-to-stand navicular drop test: Do static measures of navicular height relate to the dynamic navicular motion during gait. Journal of Student Physical Therapy Research, 2(1):21-28.
Eldesoky, MT and Abutaleb, EE, (2015). Influence of bilateral and unilateral flatfoot on pelvic alignment. International Journal of Medical and Health Sciences, 9(8):641-645.
Freedman, BR, Brindle, TJ and Sheehan, FT, (2014). Re-evaluating the functional implications of the Q-angle and its relationship to in-vivo patellofemoral kinematics. Clinical biomechanics, 29(10):1139-1145.
Hamstra-Wright, KL, Bliven, KCH and Bay, C, (2015). Risk factors for medial tibial stress syndrome in physically active individuals such as runners and military personnel: a systematic review and meta-analysis. British journal of sports medicine, 49(6):362-369.
Heggannavar, A, Battula, L and Metgud, S, (2016). A Correlation Between Leg-Heel Alignment, Tibial Torsion and Q Angle Amongst Normal, Overweight and Obese Individuals. Int J Physiother Res, 4(3):1530-34.
Kim, JW, Lee, EH, Ko, KH and Kim, SY, (2010). The effect of navicular drop on the clinical measures of lower extremity alignment. The Journal of Korean Academy of Orthopedic Manual Physical Therapy, 16(1):1-8.
Letafatkar, A, Zandi, S, Khodayi, M and Vashmesara, JB, (2013). Flat foot deformity, Q angle and knee pain are interrelated in wrestlers. J Nov Physiother, 3(2):138.
Nguyen, AD, Boling, MC, Levine, B and Shultz, SJ, (2009). Relationships between lower extremity alignment and the quadriceps angle. Clinical journal of sport medicine: official journal of the Canadian Academy of Sport Medicine, 19(3):201.
Omololu, BB, Ogunlade, OS and Gopaldasani, VK, (2009). Normal Q-angle in an adult Nigerian population. Clinical Orthopaedics and Related Research, 467(8):2073-2076.
Park, DJ and Park, SY, (2018). Comparison of subjects with and without pes planus during short foot exercises by measuring muscular activities of ankle and navicular drop height. Korean Society of Physical Medicine, 13(3):133-139.
Prakash, V, Sahay, P and Satapathy, A, (2017). Correlation between body mass index, waist hip ratio & quadriceps angle in subjects with primary osteoarthritic knee. International Journal of Health Sciences and Research, 7(6):197-205.
Raizada, A, Shruthy, KM, Takiar, R and Bhuvanesh, S, (2019). Changes in Quadriceps Angle (Q-ANGLE) With Regard To Gender And Different Anthropometric Parameters. Int J Anat Res, 7(3.1):6756-6761.

