Department of Applied Mathematics, Maulana Azad National Institute of Technology, Bhopal, MP
Corresponding author Email: scholarpayalshrivastava@gmail.com
Article Publishing History
Received: 27/03/2019
Accepted After Revision: 22/05/2019
The variation of attribute varies the prediction of option price in the stock market. The variation of attribute value creates uncertain behaviour in the stock market and increases the risk factors for buyers. For the minimization of risk and prediction accuracy used various neural network models and optimization algorithm. The optimization algorithm reduces the impact of variance and neural network increase the accuracy of prediction. In this paper proposed cascaded neural network-based classifier for the purification of data. For the optimization of attribute correlation used hybrid swarm intelligence algorithm. The hybrid swarm intelligence algorithm is a combination of plant grows optimization and ant colony optimization. The hybrid swarm intelligence algorithm reduces the variation of prices and proceeds the data for the prediction. For the validation of proposed algorithm used NSE stock banking data of recent years. The total settles price for the processing used 20871. For the evaluation of the performance used standard parameters such as MAE, MSE, RMSE and MI. The proposed algorithm implemented in MATLAB 14.0. the cascaded neural network classifier is the combination of SOM and RBF neural network model. The SOM neural network model basically proceeds the task of clustering and RBF neural network model used for prediction.
Stock market, option predictions, Swarm Intelligence, SOM, RBF, NSE.
Shrivastava P, Verma C. K. Optimization of the Variance of Attribute by Hybrid Swarm Intelligence and Option Price Predication by Cascading Neural Network. A Retrospective Study. Biosc.Biotech.Res.Comm. 2019;12(2).
Shrivastava P, Verma C. K. Optimization of the Variance of Attribute by Hybrid Swarm Intelligence and Option Price Predication by Cascading Neural Network. A Retrospective Study. Biosc.Biotech.Res.Comm. 2019;12(2). Available from: https://bit.ly/2IKpgrF
Copyright © Shrivastava and Verma, This is an open access article distributed under the terms of the Creative Commons Attribution License (CC-BY) https://creativecommns.org/licenses/by/4.0/, which permits unrestricted use distribution and reproduction in any medium, provide the original author and source are credited.
Introduction
The forecasting of stock market implied the future of company assets and buyers of market. For the better forecasting and prediction of stock price used parametric and non-parametric model for option pricing. In option pricing, basically the role of variables is very high. The variation of variables changes the nature of prediction. For the better prediction, various authors and researcher used non-parametric model such as artificial neural network, deep learning, and optimization technique. Theattribute optimization process reduces the variance of variable value. The reduce variance implied the better prediction for the stock market. The impact of variance also impacts the performance of the prediction, ( Andreou et al, 2008, Park et al, 2014; Verma et al, 2014; Hajizadeh et al, 2018, Liu et al, 2019).
In the process of prediction used various classifications and clustering technique such as neural network and support vector machine. In the process of prediction, the rate of option price prediction basically depends on the sampling of data. The process of sampling of data reduces the size of data and normalized the data. Thenormalized data gives better prediction Liang et al, 2009 and Jang et al, 2019).In this paper proposed the cascaded based classifier for the prediction of option pricing.The cascaded classifier is a combination of SOM and RBF neural network models. Self-organized map(SOM) is basically used for the process of clustering of stock data. Radialbias function(RBF) is used here for the process of classification. The combination of two models plays a role of prototype classifier for the prediction of option pricing. For the optimization of attribute(variables) used the hybrid swarm intelligence. The hybrid swarm intelligence is a combination of plant grows optimization algorithm and ant colony optimization. The plant grows optimization algorithm work in three phase morphogen, branch and termination (Verma et al, 2016). The ant colony optimization algorithm basically works in the nature of real ants. The behaviours of real ants are finding shortest path source to the food (Chou et al, 2015; Barumik et al, 2016). In our optimization algorithm the ant colony optimization plays role of distance reduction of attribute. The reduce distance of attributes creates a new set of data in the process of prediction (Olatomiwa et al, 2015; Kang et al, 2014; Mitra et al, 2012, Jang et al, 2019).
The proposed classification algorithm compares with deep learning-based option pricing model. For the experimental analysis used NSE dataset of 20871 thousand of data of different settle price. The contribution of this paper is summarized as follows : Wang et al, 2013; Burkovska et al, 2015; Al et al, 2015 Fridrich et al, 2017,Hirsa et al, 2019).
- Optimized the value of variance of attribute (variable)
- Based on cascaded classifier enhanced the performance of option pricing
- A design hybrid optimization process based on plant grow optimization and ant colony optimization.
- Conduct experimental simulation of an NSE dataset of different sample data unit and measure their performance.
Material and Methods:
Hybrid Swarm Optimization: In this section describe the process of hybrid swarm intelligence. The hybrid swarm intelligence is a combination of plant grows optimization algorithm and ant colony optimization. The plant grows optimization algorithm follow the nature of natural plant grows under sunlight. And ant colony optimization follows the real ant behaviors in environments (Heaton et al, 2017; Feuerriegel et al, 2015; Xiong et al, 2015; Yang et al, 2014).
The development of plants divided into three sections as describe below
- Morphogen
In the case of morphogen check the status of plants for growing.
- Branching
In the case of branching check the section condition of new leaf policy
- Termination
Termination is the final process of plant theory. The termination process gives the optimal solution of given problems
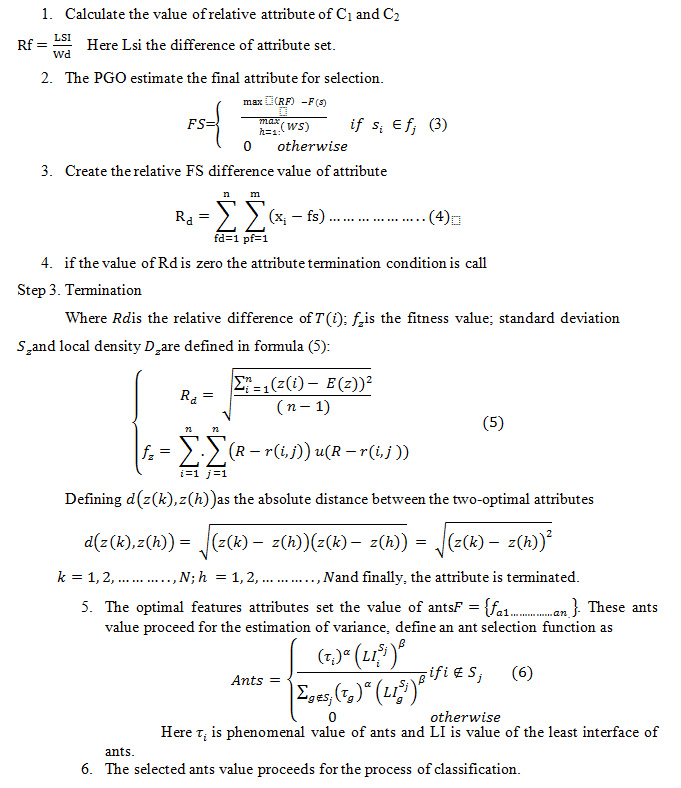
The following parameter is used for the process of attribute, x1, x2,…………..,xn is the attribute of NSE data for option pricing. W is the Wight factor for the attribute, is the value of a morphogen, C1 and C2 is the contour value of attribute.
Step1. Define the value of attribute-set S1{ x1, x2,…………..,xn} with population
Assign the value of the contour and weight of attribute C1=0, C2=0 and W=0
a. Morphogen selection of plant function
Here Ffd is initial attribute and Fpf is final attribute of the plant and w is set of attribute variable of sum sets
The attribute variables set the value of branch F= {fα……………..αn} . Thesebranchvalues proceed for theestimation Competition condition of local leaf.
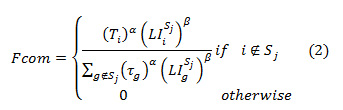
Here T is the target value of attribute, and LI is the value of attribute difference. Step2. Branching condition
Input the selected attribute for the Competition
Cascaded Classifier for Prediction
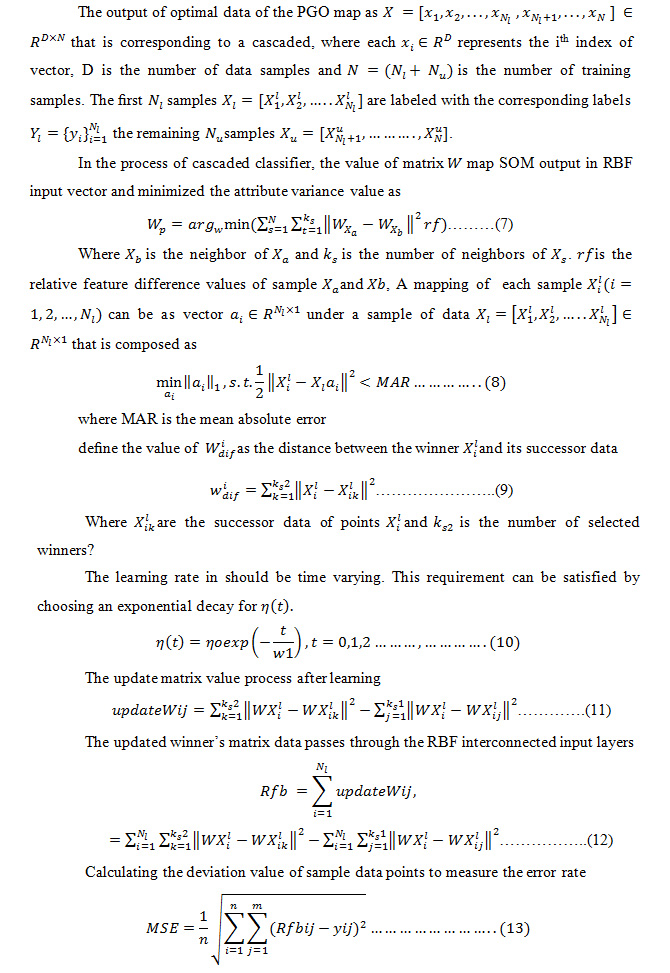
Cascading is a new area of neural network hybridization. In the process of cascading encapsulate two different neural network models based on requirement of the classification process. In option price prediction used two neural network models one is a SOM neural network and other is a RBF neural network model. In the process of cascading the SOM neural network model creates the clusters for the processing of RBF pattern. The RBF pattern is finally prediction value of option prices. The selection of settle price proceeds through the process of plant grows optimization. The RBF neural network model is a single hidden layer classifier and the process of classification is very fast and accurate. And other side used SOM network, it is self-organized map neural network and property of this network is unsupervised. Due to this property training process of the network is not required. In SOM network, optimal attribute which has been selected by selector passes to this network and create two different attribute vector one is winner attribute vector, and another is a successor attribute vector. The successor attributes vector passes through the RBF neural network in the process of training and pattern classification. The attributes vector passes through SOM acts as a clustering mechanism that projects N-dimensional attributes from the attribute matrix into an M-dimensional attribute space. The resulting vectors are fed into a SOM that categorizes them into one of the relearned optimal attributes. The transformed attribute vectors are fed into the SOM, which classifies them. We call the attribute space generated from the attribute selector function output as the primary attribute space and M-dimensional attribute space for SOM output as a secondary attribute space. The secondary attribute space passes through as vector input of RBF function.
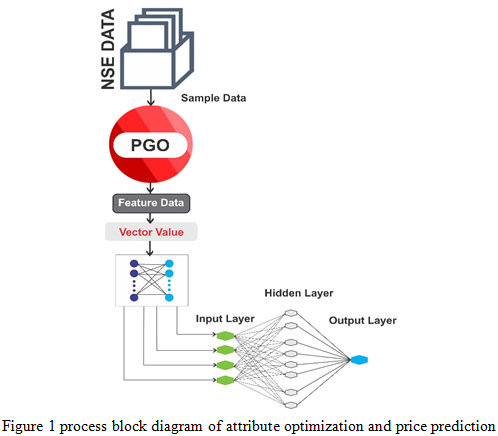 |
Figure 1: process block diagram of attribute optimization and price prediction |
Results and Discussion
Table 1: Input Data taken from National Stock Exchange of India (NSE) Stock option of Andhra Bank
| Symbol | Strike Price | Settle Price | Underlying Value |
| AXIXBANK | 75 | 0.05 | 49.85 |
| AXIXBANK | 75 | 0.05 | 50.65 |
| AXIXBANK | 75 | 0.1 | 51.05 |
| AXIXBANK | 75 | 0.05 | 51.5 |
| AXIXBANK | 75 | 0.05 | 51.85 |
| AXIXBANK | 70 | 0.05 | 49.5 |
| AXIXBANK | 67.5 | 0.1 | 47.85 |
| AXIXBANK | 75 | 0.05 | 53.2 |
| AXIXBANK | 70 | 0.05 | 49.85 |
| AXIXBANK | 75 | 0.05 | 53.95 |
| AXIXBANK | 70 | 0.05 | 50.65 |
| AXIXBANK | 75 | 1.5 | 54.35 |
| AXIXBANK | 67.5 | 0.05 | 49.5 |
| AXIXBANK | 67.5 | 1.4 | 49.6 |
Table 2: Input Data taken from National Stock Exchange of India (NSE) Stock option of ICICI Bank
| Symbol | Strike Price | Settle Price | Underlying Value |
| ICICIBANK | 310 | 0.2 | 190.75 |
| ICICIBANK | 300 | 0.05 | 192 |
| ICICIBANK | 310 | 0.05 | 198.45 |
| ICICIBANK | 300 | 0.05 | 193.55 |
| ICICIBANK | 310 | 0.35 | 204.05 |
| ICICIBANK | 300 | 0.15 | 199.25 |
| ICICIBANK | 280 | 0.05 | 187 |
| ICICIBANK | 270 | 0.05 | 183 |
| ICICIBANK | 300 | 0.25 | 203.5 |
| ICICIBANK | 270 | 0.2 | 184.8 |
| ICICIBANK | 280 | 0.05 | 192 |
| ICICIBANK | 300 | 0.15 | 207.25 |
| ICICIBANK | 280 | 0.05 | 193.55 |
| ICICIBANK | 280 | 0.1 | 196.6 |
| ICICIBANK | 260 | 0.3 | 183 |
| ICICIBANK | 270 | 0.15 | 190.05 |
| ICICIBANK | 280 | 0.05 | 198.45 |
| ICICIBANK | 280 | 0.05 | 198.8 |
Table 3: Input Data taken from National Stock Exchange of India (NSE) Stock option of RBL Bank
| Symbol | Strike Price | Settle Price | Underlying Value |
| RBLBANK | 620 | 0.05 | 505.85 |
| RBLBANK | 600 | 0.75 | 490.3 |
| RBLBANK | 600 | 0.8 | 490.35 |
| RBLBANK | 620 | 2.3 | 508.15 |
| RBLBANK | 620 | 0.05 | 508.95 |
| RBLBANK | 620 | 1.75 | 509.5 |
| RBLBANK | 620 | 0.15 | 511.7 |
| RBLBANK | 600 | 0.9 | 497.2 |
| RBLBANK | 620 | 0.65 | 516.35 |
| RBLBANK | 620 | 3 | 516.55 |
| RBLBANK | 620 | 0.45 | 518.1 |
| RBLBANK | 600 | 0.45 | 501.65 |
| RBLBANK | 600 | 3.3 | 501.65 |
| RBLBANK | 600 | 0.05 | 505.35 |
| RBLBANK | 600 | 0.2 | 505.85 |
In this section discuss the process of result analysis of proposed algorithm and optimization of swarm intelligence. The proposed algorithm implemented in MATLAB 14.0. For the process of analysis used NSE dataset. For the evaluation used standard parameters NMSE, RMSE, MAE and MI. The proposed result compares with Deep learning algorithms.
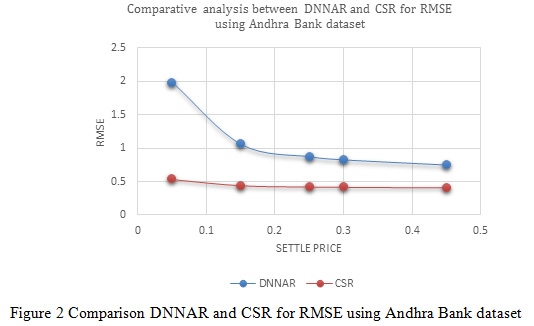 |
Figure 2: Comparison DNNAR and CSR for RMSE using Andhra Bank dataset |
In Figure 2, indicates the variation of normalized mean square error between deep neural network methods and proposed cascaded algorithm for the Andhra Bank dataset. The result of variation distributed in different settle price such as 0.05, 0.15, 0.25, 0.30 and 0.45 the variation indicates the value of RMSE is optimized due to the process of optimization and better prediction of cascaded classifier. According to the settle price (0.05, 0.15, 0.25, 0.30 and 0.45) sequentially deep neural network method RMSE values are 1.988, 1.0627, 0.8776, 0.8313 and 0.7542 and similarly proposed cascaded algorithm RMSE values are 0.5388, 0.44627, 0.42776, 0.42313 and 0.41542.
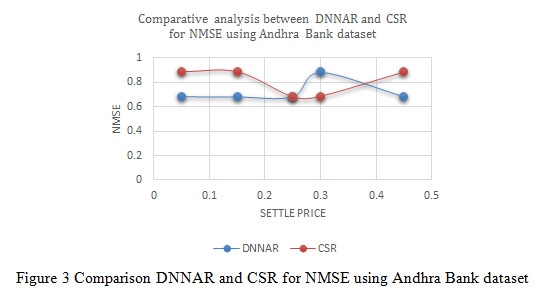 |
Figure 3: Comparison DNNAR and CSR for NMSE using Andhra Bank dataset |
In Figure 3, indicates the variation of normalized mean square error between deep neural network methods and proposed cascaded algorithm for the Andhra Bank dataset. The result of variation distributed in different settle price such as 0.05, 0.15, 0.25, 0.30 and 0.45 the variation indicates the value of NMSE is optimized due to the process of optimization and better prediction of cascaded classifier. According to the settle price (0.05, 0.15, 0.25, 0.30 and 0.45) sequentially deep neural network method NMSE values are 0.68428, 0.68549, 0.68763, 0.88549 and 0.68756 and similarly proposed cascaded algorithm NMSE values are 0.88521, 0.88791, 0.68194, 0.68756 and 0.88634.
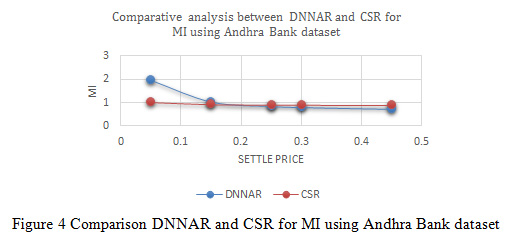 |
Figure 4: Comparison DNNAR and CSR for MI using Andhra Bank dataset |
In Figure 4, indicates the variation of normalized mean square error between deep neural network methods and proposed cascaded algorithm for the Andhra Bank dataset. The result of variation distributed in different settle price such as 0.05, 0.15, 0.25, 0.30 and 0.45 the variation indicates the value of MI is optimized due to the process of optimization and better prediction of cascaded classifier. According to the settle price (0.05, 0.15, 0.25, 0.30 and 0.45) sequentially deep neural network method MI values are 1.988, 1.0627, 0.8776, 0.8313 and 0.7542 and similarly proposed cascaded algorithm MI values are 1.0388, 0.94627, 0.92776, 0.92313 and 0.91542.
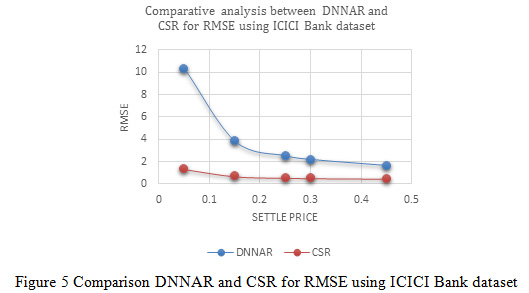 |
Figure 5: Comparison DNNAR and CSR for RMSE using ICICI Bank dataset |
In Figure 5, indicates the variation of normalized mean square error between deep neural network methods and proposed cascaded algorithm for the ICICI Bank dataset. The result of variation distributed in different settle price such as 0.05, 0.15, 0.25, 0.30 and 0.45 the variation indicates the value of RMSE is optimized due to the process of optimization and better predictionof cascaded classifier. According to the settle price (0.05, 0.15, 0.25, 0.30 and 0.45) sequentially deep neural network method RMSE values are 10.358, 3.8527, 2.5516, 2.2263 and 1.6842 and similarly proposed cascaded algorithm RMSE values are 1.3758, 0.72527, 0.59516, 0.56263 and 0.50842.
In Figure 6, indicates the variation of normalized mean square error between deep neural network methods and proposed cascaded algorithm for the ICICI Bank dataset. The result of variation distributed in different settle price such as 0.05, 0.15, 0.25, 0.30 and 0.45 the variation indicates the value of NMSE is optimized due to the process of optimization and better prediction of cascaded classifier.
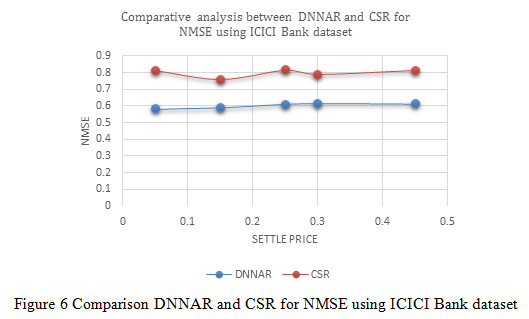 |
Figure 6: Comparison DNNAR and CSR for NMSE using ICICI Bank dataset |
According to the settle price (0.05, 0.15, 0.25, 0.30 and 0.45) sequentially deep neural network method NMSE values are 0.58403, 0.5906, 0.61145, 0.61555 and 0.61272 and similarly proposed cascaded algorithm NMSE values are 0.81272, 0.75999, 0.81555, 0.7906 and 0.81438.
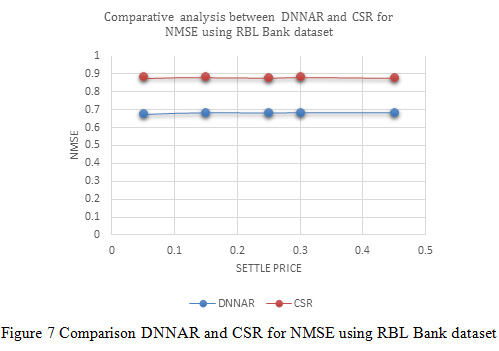 |
Figure 7: Comparison DNNAR and CSR for NMSE using RBL Bank dataset |
In Figure 7, indicates the variation of normalized mean square error between deep neural network methods and proposed cascaded algorithm for the RBL Bank dataset. The result of variation distributed in different settle price such as 0.05, 0.15, 0.25, 0.30 and 0.45 the variation indicates the value of NMSE is optimized due to the process of optimization and better predictionof cascaded classifier. According to the settle price (0.05, 0.15, 0.25, 0.30 and 0.45) sequentially deep neural network method NMSE values are 0.67728, 0.68376, 0.68195, 0.68393 and 0.68393 and similarly proposed cascaded algorithm NMSE values are 0.88311, 0.8824, 0.88025, 0.88325 and 0.87926.
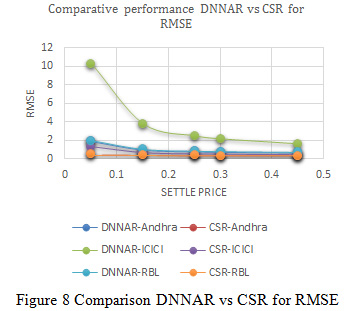 |
Figure 8: Comparison DNNAR vs CSR for RMSE |
In Figure 8, indicates the variation of normalized mean square error between deep neural network methods and proposed cascaded algorithm for Andhra Bank, ICICI Bank and RBL Bank dataset. The result of variation distributed in different settle price such as 0.05, 0.15, 0.25, 0.30 and 0.45 the variation indicates the value of RMSE is optimized due to the process of optimization and better predictionof cascaded classifier.
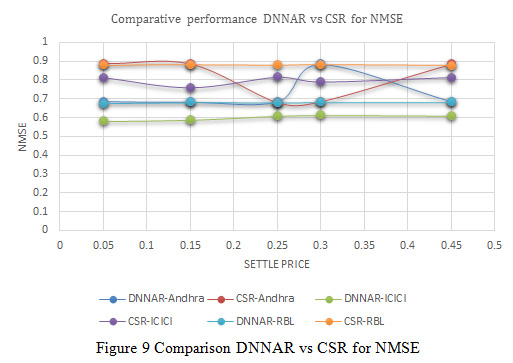 |
Figure 9: Comparison DNNAR vs CSR for NMSE |
In Figure 9, indicates the variation of normalized mean square error between deep neural network methods and proposed cascaded algorithm for Andhra Bank, ICICI Bank and RBL Bank dataset. The result of variation distributed in different settle price such as 0.05, 0.15, 0.25, 0.30 and 0.45 the variation indicates the value of NMSE is optimized due to the process of optimization and better prediction of cascaded classifier.
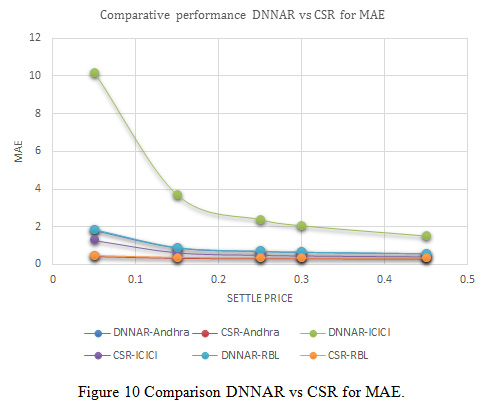 |
Figure 10: Comparison DNNAR vs CSR for MAE |
In Figure 10, indicates the variation of normalized mean square error between deep neural network methods and proposed cascaded algorithm for Andhra Bank, ICICI Bank and RBL Bank dataset. The result of variation distributed in different settle price such as 0.05, 0.15, 0.25, 0.30, 0.45 the variation indicates the value of MAE is optimized due to the process of optimization and better predictionof cascaded classifier.
In Figure 11, indicates the variation of normalized mean square error between deep neural network methods and proposed cascaded algorithm for Andhra Bank, ICICI Bank and RBL Bank dataset. The result of variation distributed in different settle price such as 0.05, 0.15, 0.25, 0.30 and 0.45 the variation indicates the value of MI is optimized due to the process of optimization and better prediction of cascaded classifier.
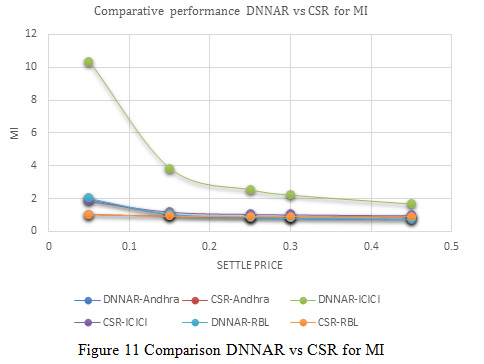 |
Figure 11: Comparison DNNAR vs CSR for MI |
The cascaded classifier reduces the variation of price and enhances the process of prediction. For the validation and analysis of algorithm used NSE dataset in recent years. The total data instance is 20871. The total data are distributed into different settle prices for the measuring the variation of real value and predicated value. For the evaluation used 4 non-parametric parameters such as normalized mean square error, root mean square error, mean absolute error and mutual information. The value of mutual information indicates the independency of a variable during the process of cascaded classifier. In Figure 2, shows the variation value of NMSE (normalized mean square error), in case of CSR (cascaded classifier) the value of variation is decreased. In case of the deep learning algorithm, the variation of error is increased in all distributed points for the selection of settle price.
The reduce value of NMSE increase the value of option price prediction. The enhance value of price also shows the best performance of the optimization of attribute selection and processing of data in the process of classification. In Figure 3, shows the value of RMSE (root mean square error). The variation value of RMSE is also decreasing in case of CSR. Due to the better selection and optimization of attribute according to the plant grow optimization algorithm, the deviation of attribute value is reduced. The reduced value of deviation indicates the minimum value of MSER. In Figure 4, describe the performance of mean absolute error, in case of CSR instead of DNNAR the value of MAE is down due to optimized patterns of price attribute of the RBF function. The processing of RBF function reduces the variation of attribute and enhance the predictionvalue of price and reduces the value of MAE. In Figure 5, describe the independency of price in the attribute selection process during the cascaded classifier. The target value of predictionis increase and value of error is decreasing, increase the value of MI shows that the better prediction ratio of classifier instead of DNNAR. In Figure 6 and 7, describe the process performance of individual algorithms satisfying the all parameters for the distribution of all settle prices. The interval ratio of settle price indicates that the variation in case of CSR is minimized instead of DNARR.
Conclusion
In this paper analyzed the performance of option price prediction using two algorithms. The used algorithms are a combination of optimization algorithm and cascaded neural network-based classification. The optimization algorithm reduces the variation of attribute selection in the process of classification. The optimization algorithm is called plant grow optimization. The plant grows optimization algorithm work in three phases. In a first phase basically dynamic define the population in the form of data loading for the process of optimization. In the second phase process used branch selection process for the new population, in this phase basically reduces the attribute variation relation of two distinct attributes. And finally measure the value of computation, for the final selection of the optimal value of the price of the input processing of cascaded classifier. The cascaded classifier is a combination of two neural network models. RBF and SOM neural network, here the SOM neural network model used for the process of clustering of input data by the optimization algorithms.
The rate of learning used 0.6 probability value and group data in good manners. The group of clusters passes through the RBF function, the RBF function generates the trained patterns and predict the value of option prices. For the validation and analysis of the optimization and cascaded classifier used NSE India dataset. The data interval is last 6 years. In all data instances used selected numbers of attributes. For the analysis of performance used 4 standard parameters NMSE, RMSE, MAE and MI. The values indicate better performance of cascaded classifier instead of deep neural network-based classifier. The deep neural network-based classifier suffers from the selection of feature attributes of price variation. The plant grow optimization algorithm reduces the variation of attributes and increase the value of option pricing.
References
Al-Jarrah, O. Y., Yoo, P. D., Muhaidat, S., Karagiannidis, G. K., & Taha, K. (2015). Efficient machine learning for big data: A review. Big Data Research, 2(3), 87-93.
Andreou, P. C., Charalambous, C., & Martzoukos, S. H. (2008). Pricing and trading European options by combining artificial neural networks and parametric models with implied parameters. European Journal of Operational Research, 185(3), 1415-1433.
Baruník, J., & Malinska, B. (2016). Forecasting the term structure of crude oil futures prices with neural networks. Applied energy, 164, 366-379.
Burkovska, O., Haasdonk, B., Salomon, J., & Wohlmuth, B. (2015). Reduced Basis Methods for Pricing Options with the Black–Scholes and Heston Models. SIAM Journal on Financial Mathematics, 6(1), 685-712.
Chou, J. S., & Pham, A. D. (2015). Smart artificial firefly colony algorithm‐based support vector regression for enhanced forecasting in civil engineering. Computer‐Aided Civil and Infrastructure Engineering, 30(9), 715-732.
Fridrich, M. (2017). Hyperparameter optimization of artificial neural network in customer churn prediction using genetic algorithm. Trends Economics and Management, 11(28), 9-21.
Feuerriegel, S., & Fehrer, R. (2015). Improving decision analytics with deep learning: the case of financial disclosures. arXiv preprint arXiv:1508.01993.
Hirsa, A., Karatas, T., & Oskoui, A. (2019). Supervised Deep Neural Networks (DNNs) for Pricing/Calibration of Vanilla/Exotic Options Under Various Different Processes. arXiv preprint arXiv:1902.05810.
Hajizadeh, E., & Mahootchi, M. (2018). Optimized radial basis function neural network for improving approximate dynamic programming in pricing high dimensional options. Neural Computing and Applications, 30(6), 1783-1794.
Heaton, J. B., Polson, N. G., & Witte, J. H. (2017). Deep learning for finance: deep portfolios. Applied Stochastic Models in Business and Industry, 33(1), 3-12.
Jang, H., & Lee, J. (2019). Generative Bayesian neural network model for risk-neutral pricing of American index options. Quantitative Finance, 19(4), 587-603.
Kang, S., & Cho, S. (2014). Approximating support vector machine with artificial neural network for fast prediction. Expert Systems with Applications, 41(10), 4989-4995.
Liu, S., Oosterlee, C. W., & Bohte, S. M. (2019). Pricing options and computing implied volatilities using neural networks. Risks, 7(1), 16.
Liang, X., Zhang, H., Xiao, J., & Chen, Y. (2009). Improving option price forecasts with neural networks and support vector regressions. Neurocomputing, 72(13-15), 3055-3065.
Mitra, S. K. (2012). An Option Pricing Model That Combines Neural Network Approach and Black Scholes Formula. Global Journal of Computer Science and Technology.
Olatomiwa, L., Mekhilef, S., Shamshirband, S., & Petkovic, D. (2015). Potential of support vector regression for solar radiation prediction in Nigeria. Natural Hazards, 77(2), 1055-1068.
Park, H., Kim, N., & Lee, J. (2014). Parametric models and non-parametric machine learning models for predicting option prices: Empirical comparison study over KOSPI 200 Index options. Expert Systems with Applications, 41(11), 5227-5237.
Verma, N., Das, S., & Srivastava, N. (2016). Multiple Kernel Support Vector Regression with Higher Norm in Option Pricing. International Journal of Applied Engineering Research, 11(5), 3168-3174.
Verma, N., Srivastava, N., & Das, S. (2014). Forecasting the Price of Call Option Using Support Vector Regression. IOSR Journal of Mathematics, 10(6), 38-43.
Wang, Y. (2013). Stock price direction prediction by directly using prices data: an empirical study on the KOSPI and HSI. arXiv preprint arXiv:1309.7119.
Xiong, R., Nichols, E. P., & Shen, Y. (2015). Deep learning stock volatility with google domestic trends. arXiv preprint arXiv:1512.04916.
Yang, C. C., Leu, Y., & Lee, C. P. (2014). A dynamic weighted distanced-based fuzzy time series neural network with bootstrap model for option price forecasting. Romanian Journal of Economic Forecasting, 17(2), 115.

