Department of Life Sciences, University of Calicut, Malappuram, Kerala-673635, India
Corresponding author Email: drds@uoc.ac.in
Article Publishing History
Received: 05/05/2019
Accepted After Revision: 25/06/2019
The objective of our study was to monitor bacteriological contamination in drinking water from northern districts of Kerala (Malabar) was carried out and also to detect the suitability of water for drinking purpose.Total coilforms can be detected by most probable number method and quantitative analysis through total Viable Count . Sixty drinking water samples were analysed both qualitatively and quantitatively.The total viable count varies from 90 to 8x10⁶CFU/ml and three samples have MPN more than 1600/100ml. About 105 bacterial isolates obtained from 60 samples comprised of eight species such as Staphylococcus aureus (18.1%) Bacillus Spp. (18.1%), Pseudomonas Spp. (17.14%), Klebsiella Spp.
(17.14%), Enterobacter Spp. (10.48%), Citrobacter Spp. (9.52%), E.coli (8.57%), and Shigella Spp. (0.95%) respectively. And the distribution of Escherichia coli in both public water supplies as well as in well water found to be 15.6% and 19.04% respectively. This reveals drinking water in this area is contaminated. So an urgent action is needed to eliminate this issue by conducting planned bacteriological assessment regularly and it helps to provide safe drinking water to public.
Bacteriological Assessment, Drinking Water, Escherichia Coli, Mpn, Northern Kerala
Ambili M, Sebastian D. Assessment of bacteriological quality of drinking water from North Kerala, India. Biosc.Biotech.Res.Comm. 2019;12(2).
Ambili M, Sebastian D. Assessment of bacteriological quality of drinking water from North Kerala, India. Biosc.Biotech.Res.Comm. 2019;12(2). Available from: https://bit.ly/2Lzyeui
Copyright © Ambili and Sebastian, This is an open access article distributed under the terms of the Creative Commons Attribution License (CC-BY) https://creativecommns.org/licenses/by/4.0/, which permits unrestricted use distribution and reproduction in any medium, provide the original author and source are credited.
Introduction
Large number of cases are reported annually due to consumption of unsafe drinking water because of lacks access to safe drinking water and poor sanitation(Hunter et al., 2001). The United Nations identifies improving water quality as one of the eight Millennium Development Goals (MDGs), and its target is to reduce the number of people without access to safe water by 50% in 2015 (Pandey et al., 2014). Even though waterborne outbreaks have been declining dramatically since the 1900s, the global burden of infectious waterborne disease is still considerable. Moreover, the numbers of outbreaks underestimate the real incidence of waterborne diseases (Leclerc et al., 2002). So there is an urgent need to take an action to control the cases of waterborne diseases. In India contaminated water consumption plays an important role in many waterborne diseases outbreaks occurrence. Coliforms are major contaminants in surface and ground water in developing countries and are the representative of important group of indicator bacteria as a measure of water quality, (Chitanand et al., 2010, Chauhan et al., 2017, Joseph et al., 2018).
Ground water is the major source of drinking water and the quality of water threatened by number of parameters including microbiological and chemical contamination, (Kolbel-Boelke et al., 1988). Drinking water is a major source of microbial pathogens in developing regions. Waterborne infections are those which are transmitted through ingestion, airborne or contact by wide variety of infectious agents such as bacteria, virus, protozoa and helminthes. Water contaminated with infectious and toxigenic microorganisms has been a major public health concern throughout the world. Heterotrophic bacteria is common in ground water mainly because of their phenotypic plasticity. Ground water examination shows prevalence of Pseudomonas spp. in many samples (Leclerc, 2003). When there is fecal or other contamination, dominance of pathogenic bacteria increases.
The major health risk from drinking water is caused by the presence or introduction of coliforms in the drinking water supply which may come from the nontreated sewage systems sited nearly the water source or distribution system as well as overflow from them. Water analysis mainly focuses on coliforms, thermo tolerant coliforms and E. coli is used as an indicator of fecal contamination of water. Fecal coliforms (or thermo tolerant coliforms) are coliforms which can ferment lactose at 44.5 °C, (Craun, 1978), (Grabow, 1996, Rompré et al., 2002, Payment et al., 2003). And the presence of faecal coliforms indicate recent contamination of water sources with human and animal wastes and this ‘indicator organisms’ indicate possible presence of other potential pathogens, (Cabral, 2010, Rodríguez et al., 2012).
Total coliforms are Gram-negative, oxidase-negative, non-spore forming bacilli and are facultative anaerobes ferment lactose with gas production at 35–37°C, after 48h and it comprised of Escherichia, Klebsiella, Enterobacter and Citrobacter. But the signifi cance of total coliforms as sanitary significance is very disparate because it also contain on soil and on vegetation. There is no relation between total coliform count and fecal pollution. The use of the coliform group as an indicator of fecal contamination is subject to strict governmental regulations. E. coli is the major coliform among the intestinal fl ora of warm blooded animals and its presence is associated with fecal contamination, therefore no E.coli is allowed in drinking water. Thus , detection of indicator organism is considered as the best method to detect the effectiveness of disinfection process and also recent and frequent fecal contamination of water (Rodríguez et al., 2012), (Tharannum et al., 2009).
Accurate identifi cation of bacteria is the next most important issue. Recently,many workers used different carbon sources utilization pattern (Biolog) and cellular fatty acids profiling using Microbial Identification System (MIDI) for bacterial identification (Holmes et al., 1994), (Müller and Ehlers, 2005), (Slabbinck et al., 2009).
Materials and Methods
The study was conducted in Northern Kerala which consists of 5 districts in Kerala such as Kasaragod, Kannur, Calicut, Wayanad and Malappuram. The geographical location of Kerala is on the southwest coast of India. Kerala is situated between latitude 10°00 North and longitude 76°25 East. Kerala shares its state borders with Tamil Nadu on the east and Karnataka on the north. It is flanked by the Arabian Sea on the west. In Kerala well water is the main drinking water source.
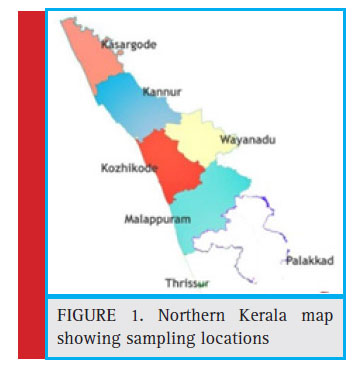 |
Figure 1: Northern Kerala map showing sampling locations |
Drinking water samples from different sources such as well water, bore well water and tap water samples were randomly collected aseptically from Malabar region of Kerala between the period of January 2015-August 2016.
Standard plate count: 0.1 ml of preenriched water samples were inoculated onto nutrient agar through spread plate technique for the isolation of total viable bacteria. Plates were incubated at 37°C for 24 hours. For the final identification, all the isolates were identified by using primary as well as secondary identification methods such as Gram’s staining, biochemical methods according to Bergey’s Manual of Systematic Bacteriology (Garrity et al., 2007).
Detection of total coliforms using most probable number: The media used was single and double strength phenol red lactose broth for presumptive test, tubes that were positive for gas production after 24 hrs incubation at 35°C were inoculated into brilliant green lactose bile broth for confirmed test and positive tubes were used to calculate the most probable number using statistical table [8,9]. In completed test, the samples from positive brilliant green lactose bile broth from the confirmed test are streaked onto eosin–methylene blue,nutrient agar slant and lactose broth. Streaked nutrient agar slant, was used to establish that coliforms were present in the sample using primary and secondary methods such as Gram’s staining, biochemical methods according to Bergey’s Manual of Systematic Bacteriology (Garrity et al., 2007).
Selective isolation of E.coli: By using membrane filter method, 100ml samples were filtered through 0.45- μm filter and filter paper was transferred to nutrient broth.Subcultured in Eosine methylene blue media and observed the characterestic colonies with green metallic sheen, the isolates were confi rmed by biochemical methods according to Bergey’s Manual of Systematic Bacteriology (Garrity et al., 2007). Selective isolation of Shigella Spp.:A 100ml samples were filtered through 0.45-μm filter and fi lter paper was transferred to nutrient broth,after incubation, subcultured
to Deoxy cholate Citrate agar and observed the pale colored colnies and the isolates were confi rmed by using biochemical reactions according to Bergey’s Manual of Systematic Bacteriology (Garrity et al., 2007).
Selective isolation of Salmonella Spp.: By using membrane filter method, 100ml samples were fi tered through 0.45-μm filter and filter paper was transferred to buffered peptone water and overnight incubated [pre enrichment]. 0.1ml of the culture was transferred to 10 ml of Rappaport–Vassiliadis Broth [selective enrichment] and incubated for 420c 24hrs, and then subcultured to DCagar and observed for colonies with black centres and further confirmed by biochemical reactions according to Bergey’s Manual of Systematic Bacteriology (Garrity et al., 2007).
Selective isolation of Vibrio cholerae.: For the isolation of Vibrio cholerae membrane filtration of 100 ml sample was carried out and incubated in alkaline peptone water, 370c 18-24hrs and then subcultured to thiosulphate citrate bile salt sucrose agar and observed the characterestic yellow colored colonies, then the isolates were confi rmed by by biochemical reactions according to Bergey’s Manual of Systematic Bacteriology (Garrity et al., 2007).
Selective isolation of Pseudomonas aeruginosa.: For the isolation of Pseudomonas aeruginosa membrane filtration of 100 ml sample was carried out and incubated in nutrient broth, 370c 18-24hrs and then subcultured to King’s B agar and observed the characterestic green fluorescent colonies, then the isolates were confirmed by by biochemical reactions according to Bergey’s Manual of Systematic Bacteriology (Garrity et al., 2007). Selective isolation of Aeromonas hydrophila.: For the isolation of Aeromonas hydrophila membrane fi ltration of 100 ml sample was carried out and incubated in alkaline peptone water, 370c 18-24hrs and then subcultured to Starch ampicillin Agar and incubated ,300c 24-48hrs [Characterestic yellow to honey colored colonies and after addition of 5ml of Lugols iodine colonies surrounded by clear halo ], then the isolates were confi rmed by biochemical reactions according to Bergey’s Manual of Systematic Bacteriology (Garrity et al., 2007).
Selective isolation of Yersinia enterocolitica.:For the isolation of Yersinia enterocolitica membrane filtration of 100 ml sample was carried out and incubated in Yersinia enrichment broth and incubated for 100c 10days and then subcultured to Yersinia selective agar and incubated, 300c 2 days [Characterestic transluscent colonies with dark pink centre ],then the isolates were confi rmed by biochemical reactions according to Bergey’s Manual
of Systematic Bacteriology (Garrity et al., 2007).
Results and Discussion
The standard plate count which indicates total microbial count in drinking water was in the range of 90 to 8 x 10⁶ CFU/ml. Obviously drinking water samples are seriously contaminated in these region. The presumptive coliform counts of the test samples were presented in table 1 & 2. In the present study, drinking water from this area is found to be highly unsatisfactorily with MPN up to >1600/100ml. About 32 well water samples analysed 16 got unsatisfactory results and in tap water (n=21) 11 were unsatisfactory , bore well water (n=7) no unsatisfactory results obtained.
Drinking water samples were seriously contaminated in these regions. Many reviews suggested these results in various regions in Kerala and India. In many surveys drinking water samples in India as well as Kerala is found to be unfit for drinking purposes and need regular monitoring for microbial contamination(Tyagi et al., 2014), (Sidhu et al., 2016), (Jain et al., 2010, Mahath and MophinKani, 2016). Borah et al (Borah et al., 2010) reported, water samples containing varying levels of coliforms ranging from 10 to 2.8 x 10³ cfu/100ml in Golaghat district, Assam. According to Suthar et al. the microbial load in drinking water from Rajasthan as measured though standard plate count (SPC) varied greatly from 8.3 × 10⁴ to 28.3 × 10⁴ .Suthar et al found many bacterial species prevalent in those area comprised of both Gram positive and Gram negative. (Suthar et al., 2009)
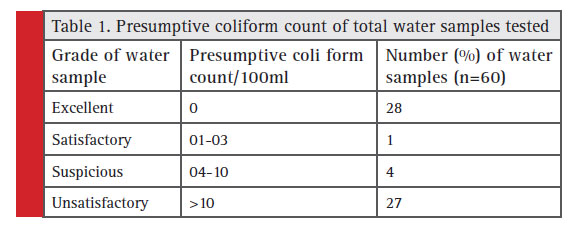 |
Table 1: Presumptive coliform count of total water samples tested |
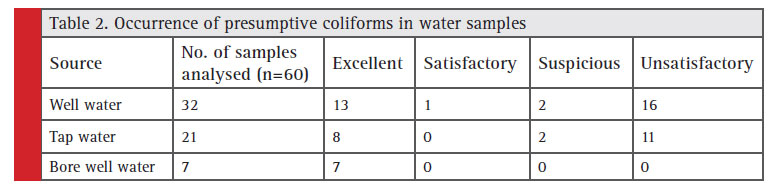 |
Table 2: Occurrence of presumptive coliforms in water samples |
A total of 105 bacterial isolates comprised of eight bacterial species were identifi ed in these samples. The organism isolated were found to be Staphylococcus aureus (18.1%) Bacillus spp (18.1%), Pseudomonas spp (17.14%), Klebsiella spp(17.14%), Enterobacter spp (10.48%), Citrobacter spp (9.52%), E.coli (8.57%), and Shigella spp (0.95%) respectively (Fig. 2).
 |
Figure 2: Occurrence of bacterial species in water samples |
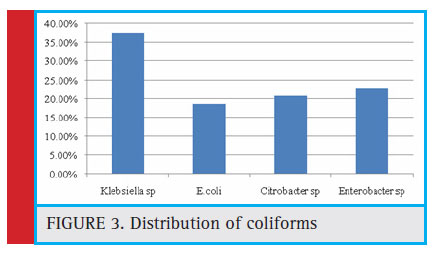 |
Figure 3: Distribution of coliforms |
Out of the 60 samples screened, 36 (60%) were positive for the presence of coliforms (number of coliforms=48). Among which E. coli accounts to be 18.75%, Citrobacter sp (20.83%), Enterobactersp (22.91%), and Klebsiella sp. (37.5%) respectively (Figure 3). The indicator organism E.coli was present in a total of 9 samples among which 5 undergoes well water samples and 4 tap water, and in bore well water no E.coli was found. (Table 3).
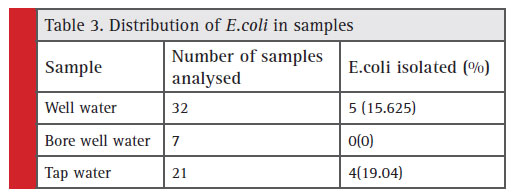 |
Table 3: Distribution of E.coli in samples |
In a study by Ahmed et al. the indicator bacterium Escherichia coli were detected in 32% using MPN method (Ahmed et al., 2015) from Dhaka metropolis. Sidhu S et al. (Sidhu et al., 2016) conducted a study in Northern Indian Schools and found that 39.8% samples were non potable. And a study by Chitanand MP et al. revealed high populations of Escherichia coli, followed by Citrobacter freundii, Citrobacter diversus, Enterobacter aerogens and Klebsiella species from six sites along the bank of the river Godavari (Chitanand et al., 2010). A study conducted by Rajendran et al revealed 37% of coliform contamination from tsunami hit areas of Kanyakumari, Tamilnadu (Rajendran et al., 2006).In a study conducted in different zones of Delhi to detect drinking water quality sold by road side vendors , all the samples were found to be coliform contaminated with a MPN value ranges from 14 – >1600 per 100 ml of sample, with 61% of E.coli contamination followed by Salmonella , S. aureus and P. aeruginosa contamination respectively, (Chauhan et al., 2017).
In a study by Mahath et al. (2016), conducted in Kollam district, Kerala, total coliforms and fecal coliforms were detected in household water samples and it was found to be 60% and 50% respectively. And in our study in Northern Kerala showed the presence of both total coliforms (53.3%) and fecal coliforms (15%) indicates the presence of fecal contamination. As compared with southern Kerala, the prevalence of total coliforms and fecal coliforms was lower in Northern Kerala. Recent reports says more than three million people in the world die of water related diseases due to contaminated water each year, including 1.2 million children (Hunter et al., 2001), (Cabral, 2010), (Fenwick, 2006).Many developing regions suffer from the lack of safe drinking water for their population. About 800 billion people in Asia and Africa are living without access to safe drinking water. Consequently this has caused many people to suffer from various waterborne diseases (Tanwir et al., 2003). Continuous consumption of these samples causes infection especially in children and infants.
Conclusion
The study concluded that the standard plate count in 60 samples was in the range of 90 to 8x10⁶CFU/ml. A total of 60% of the tested samples were contaminated with coliforms. Prevalence of E.coli in different water sources (8.57%) indicates the presence of faecal contamination. Consumption of contaminated water will cause serious health problems to the public. Routine monitoring will help solve this problem. Consistent and periodical examination of drinking water samples and disinfection process should be done periodically to prevent the spread of pathogenic microbes. Thus there is an urgent need for an awareness program to the people to decrease the cases of water borne diseases. The Government of India has already launched Swatchh Bharat Mission on 2nd October 2014, with an aim to eradicate open defecation by 2019. The mission with the help of its partners like UNICEF is looking at the challenge of Open Defecation very seriously.
Acknowledgements
The authors acknowledge funding support from the Department of Science and Technology (DST) INSPIRE Fellowship, Govt. of India.
Conflict of Interest Authors have declared that no competing interests exist.
References
A hmed, T., Baidya, S., Acharjee, M. & Rahman, T. 2015. Qualitative Analysis Of Drinking Water Through The Most Probable
Number (Mpn) Method. Stamford Journal Of Microbiology, 3,9-16.
B orah, M., Dutta, J. & Misra, A. K. 2010. The Bacteriological Quality Of Drinking Water In Golaghat Sub-Division Of Golaghat District, Assam, India. International Journal Of Chemtech Research, 2, 1843-1851.
C abral, J. P. 2010. Water Microbiology. Bacterial Pathogens And Water. Int J Environ Res Public Health, 7, 3657-703.
C hauhan, A., Goyal, P., Varma, A. & Jindal, T. 2017. Microbiological Evaluation Of Drinking Water Sold By Roadside Vendors Of Delhi, India. Applied Water Science, 7, 1635-1644.
C hitanand, M. P., Kadam, T. A., Gyananath, G., Totewad, N. D. & Balhal, D. K. 2010. Multiple Antibiotic Resistance Indexing Of Coliforms To Identify High Risk Contamination Sites In Aquatic Environment. Indian J Microbiol, 50, 216-20.
C raun, G. F. 1978. Impact Of The Coliform Standard On The Transmission Of Disease. In: Hendriks, C. W. (Ed.) Evaluation Of The Microbiology Standards For Drinking Water. Washington Dc: U.S. Environmental Protection Agency, Offi ce Of Drinking Water, Criteria Standards Division.
F enwick, A. 2006. Waterborne Infectious Diseases–Could They Be Consigned To History? Science, 313, 1077-81.
G arrity, G., Cole, J., Lilburn, T., Harrison, S., Euzéby, J. & Tindall, B. 2007, Taxonomic Outline Of The Bacteria And Archaea,
Release 7.7 Michigan State University Board Of Trustees. Doi: 10.1601/Toba7.7.
G rabow, W. O. K. 1996. Waterborne Diseases: Update On Water Quality Assessment And Control. Water Sa, 22, 193-202.
H olmes, B., Costas, M., Ganner, M., On, S. L. W. & Stevens, M. 1994. Evaluation Of Biolog System For Identifi cation Of Some Gram-Negative Bacteria Of Clinical Importance. Journal Of Clinical Microbiology, 32, 1970-1975.
H unter, P. R., Colford, J. M., Lechevallier, M. W., Binder, S. & Berger, P. S. 2001. Waterborne Diseases. Emerg Infect Dis, 7, 544.
J ain, C. K., Bandyopadhyay, A. & Bhadra, A. 2010. Assessment Of Ground Water Quality For Drinking Purpose, District Nainital, Uttarakhand, India. Environ Monit Assess, 166, 663-76.
J oseph, N., Bhat, S., Mahapatra, S., Singh, A., Jain, S., Unissa, A. & Janardhanan, N. 2018. Bacteriological Assessment Of Bottled Drinking Water Available At Major Transit Places In Mangalore City Of South India. Journal Of Environmental And Public Health, 2018, 1-7.
K olbel-Boelke, J., Anders, E. M. & Nehrkorn, A. 1988. Microbial Communities In The Saturated Groundwater Environment Ii: Diversity Of Bacterial Communities In A Pleistocene Sand Aquifer And Their In Vitro Activities. Microb Ecol, 16, 31-48.
L eclerc, H. 2003. Relationships Between Common Water Bacteria And Pathogens In Drinking-Water. In: Bartram., J., Cotruvo., J., Exner., M., Fricker., C. & Glasmacher., A. (Eds.) Heterotrophic Plate Counts And Drinking-Water Safety. London: Iwa Publishing.
L eclerc, H., Schwartzbrod, L. & Dei-Cas, E. 2002. Microbial Agents Associated With Waterborne Diseases. Crit Rev Microbiol, 28, 371-409.
M ahath, C. S. & Mophinkani, K. 2016. Examination Of Bacteriological Contamination Of Household Water Bodies In Meenambalam, Kollam District, Kerala, India. International Journal Of Scientifi c & Engineering Research, 7, 274-280.
M üller, E. & Ehlers, M. M. 2005. Biolog Identifi cation Of Non- Sorbitol Fermenting Bacteria Isolated On E. Coli O157 Selective Ct-Smac Agar. Water Sa, 31, 247-252.
P andey, P. K., Kass, P. H., Soupir, M. L., Biswas, S. & Singh, V. P. 2014. Contamination Of Water Resources By Pathogenic Bacteria. Amb Express, 4, 51.
P ayment, P., Waite, M. & Dufour, A. 2003. Introducing Parameters For The Assessment Of Drinking Water Quality. In: Dufour, A. P. (Ed.) Assessing Microbial Safety Of Drinking Water. London: Iwa Publishing.
R ajendran, P., Murugan, S., Raju, S., Sundararaj, T., Kanthesh, B. M. & Reddy, E. V. 2006. Bacteriological Analysis Of Water Samples From Tsunami Hit Coastal Areas Of Kanyakumari District, Tamil Nadu. Indian J Med Microbiol, 24, 114-6.
R odríguez, D. C., Pino, N. & Peñuela, G. 2012. Microbiological Quality Indicators In Waters Of Dairy Farms: Detection Of Pathogens By Pcr In Real Time. Science Of The Total Environment, 427–428, 314-318.
R ompré, A., Servais, P., Baudart, J., De-Roubin, M.-R. & Laurent, P. 2002. Detection And Enumeration Of Coliforms In Drinking Water: Current Methods And Emerging Approaches. Journal Of Microbiological Methods, 49, 31-54.
S idhu, S., Malhotra, S., Devi, P. & Gupta, A. 2016. Bacteriological Analysis Of The Drinking Water From Different Schools In Northern India: A Concern In Developing Countries. International Journal Of Medical Research And Review, 4, 630-634.
S labbinck, B., De Baets, B., Dawyndt, P. & De Vos, P. 2009. Towards Large-Scale Fame-Based Bacterial Species Identifi-cation Using Machine Learning Techniques. Systematic And Applied Microbiology, 32, 163-176.
S uthar, S., Chhimpa, V. & Singh, S. 2009. Bacterial Contamination In Drinking Water: A Case Study In Rural Areas Of Northern Rajasthan, India. Environ Monit Assess, 159, 43-50.
T antawiwat, S., Tansuphasiri, U., Wongwit, W., Wongchotigul, V. & Kitayaporn, D. 2005. Development Of Multiplex Pcr For The Detection Of Total Coliform Bacteria For Escherichia Coli And Clostridium Perfringens In Drinking Water. Southeast Asian J Trop Med Public Health, 36, 162-9.
T anwir, F., Saboor, A. & Shan, M. H. 2003. Water Contamination, Health Hazards And Public Awareness: A Case Of The Urban Punjab, Pakistan. International Journal Of Agriculture And Biology, 5, 560-562.
T harannum, S., Sunitha, S., Nithya, J., Chandini, M., Vanitha, J., Manjula, T. S. & Shyam Sundar, C. 2009. Molecular Confirmation Of The Presence Of Coliforms In Drinking Water Using Polymerase Chain Reaction. Kathmandu Univ J Sci Eng Technol, 5, 130-136.
T yagi, S., Singh, P., Sharma, B., Singh, R., Dobhal, R. & Uniyal, D. P. 2014. Bacteriological Assessment Of Drinking Water Sources Of Uttarakhand, India. National Academy Science Letters, 38, 37-44.

