Nafees Akhter Farooqui*![]() and Ritika
and Ritika![]()
Department of Computer Science, DIT University Dehradun-248009, Uttarakhand, India
Corresponding author email:nafees.farooqui@dituniversity.edu.in
Article Publishing History
Received: 05/10/2019
Accepted After Revision: 30/11/2019
In India, the economic, political, and social stability depends directly as well as indirectly on agricultural productivity. The agricultural product quality and productivity are affected by the different diseases in plants. Therefore, diseases detection in plants is very important in the agriculture field. Leaf disease detection by using different machine learning techniques is a very popular field of study. There have already been many promising outcomes but only a few real-life applications that can make life simpler for the farmer. Machine learning technique becomes the most accurate and precise paradigm for the detection of plant’s disease which is helpful to reduce an oversized work of watching in huge farms of crops, and an early stage itself it detects the symptoms of diseases on plant leaves. In this paper, we use a novel approach for detection and identification of leaf diseases by K-means clustering, multi-class SVM, and advanced neural network techniques to process data, on plant disease detection. Gray Level Co-occurrence Matrix (GLCM) is used for feature extraction. The disease classification is done using SVM classifier, and the detection accuracy is improved by optimizing the data using the Advanced Neural Network (NN). The extracted features are fit into the network. This is a great success, demonstrating the feasibility of this approach in plant disease diagnosis and high crop yielding. The aim of our research is solving the problem of detection and preventing diseases of crops. We also demonstrate the model for leaf diseases detection system for future trends of hyperspectral data.
Advanced Neural Network, Gray Level Co-Occurrence Matrix, Hyperspectral Data, K-Means Clustering, Support Vector Machine
Farooqui N. A, Ritika. An Identification and Detection Process for Leaves Disease of Wheat Using Advance Machine Learning Techniques. Biosc.Biotech.Res.Comm. 2019;12(4).
Farooqui N. A, Ritika. An Identification and Detection Process for Leaves Disease of Wheat Using Advance Machine Learning Techniques. Biosc.Biotech.Res.Comm. 2019;12(4). Available from: https://bit.ly/34pAJow
Copyright © Farooqui and Ritika This is an open access article distributed under the terms of the Creative Commons Attribution License (CC-BY) https://creativecommns.org/licenses/by/4.0/, which permits unrestricted use distribution and reproduction in any medium, provide the original author and source are credited.
INTRODUCTION
In the global economy, agriculture plays a crucial role. With the continued expansion of the human population, the pressure on the agricultural system will increase. Agri-technology and precision farming, now also known as digital agriculture, have emerged as fresh scientific fields using data-intensive methods to boost agricultural productivity while minimizing its effect on the environment. The Advance Machine Learning (ML) method offers high-performance computing to generate fresh possibilities in agricultural operating settings to unravel, quantify, and comprehend data-intensive procedures. ML is defined as the scientific field that gives machines the ability to learn without strict programming, among other definitions. Wheat is the largest humanoid nutrition in the world that can be fed directly from any other crop. Since nutrition is becoming increasingly essential in Asia, where most of the poor people reside (Shuang-Qi et al., 2017).
Agricultural productivity is the source of economic growth for developing countries like India. Chronologically, the primary goal of farming is to provide the country with food and feed it. Plant diseases not only pose a global threat to food security but can also have disastrous consequences for smallholder farmers who depend on healthy crops for their livelihoods. There are more than 80 percent crop production generated by small farmers in the developing countries (UNEP, 2013), and accounts of yield losses of more than 50 percent are prevalent owing to pests and diseases, (Abebe et.al.,2017).
Also, the biggest proportion of hungry individuals (50%) live in smallholder farming homes (Sanchez et.al, 2005), making smallholder farmers a group especially susceptible to pathogen-derived food supply disruptions. So, these leaf diseases in any forms in crop tend to cause a reduction in quality, yield, and fiscal progression, respectively. Therefore, looking to the current farming arena, instead of watching the crop through the naked eyes by a designated specialist where it does need a lot of efforts to implicate. Hence, as a result, the automation essentiality of leaf disease identification and its management has turned the pen-paper calculation into the reality of high magnitude. Therefore, this work can describe the finding of a solution for minimizing the cost by avoiding manual monitoring and an expert requirement for automatic detection of leaf diseases in a large area (LeCun. et al., 2015).
The plants are vulnerable to various disease-caused illnesses and assaults. The impacts on crops can be characterized by several factors, such as temperature, humidity, dietary excess or loss, bacterial, viral, and fungal illnesses. These diseases can demonstrate different physical characteristics on the leaves together with the plants, such as modifications in form, colors, etc. Due to various comparable patterns, the above modifications are hard to distinguish, making their identification, but the early detection and prevention will prevent the diseases in the entire crop. We will use K-means clustering, multi-class SVM, and advanced neural network techniques on plant disease detection. Gray Level Co-occurrence Matrix (GLCM) is used for feature extraction of plant leaf diseases that affect various plants (Vidyashanakara et al., 2018).
Here we take some of the articles concerning the identification of plant leaf illnesses using different sophisticated methods and some of them shown below. (Fujita et al.,2016) recommended the CNN classifier for cucumber diseases. It uses two datasets for training and validation. In addition to the healthy class, these datasets comprise seven distinct kinds of disease. The first dataset is made up of 7320 targeted images of captured leaves under excellent circumstances. The second dataset comprises of 7520 images captured that are healthy and unhealthy, Lu et al.,(2017) defined an automatic diagnostic system for wheat disease based on a supervised deep learning framework that integrates wheat disease identification and disease region. In addition, a fresh wheat disease image dataset, Wheat Disease Database 2017 (WDD, 2017), is being gathered to confirm the system’s efficiency. Andreas Kamilaris et al.,(2018) discussed and studied 40 research papers using deep learning methods that addressed multiple problems in agricultural and food production. Also, examined the specific agricultural problems with the help of the specific models and frameworks.
Ferentinos et al.,(2018) explained convolutional neural network models to detect and diagnose crop disease using plain leaf images of healthy and diseased crops using deep learning methods. The training model was carried out using an open database of 87,848 images, consisting of 25 distinct crops in a set of 58 different classes, including healthy plants. Several model architectures were trained with the greatest outcomes reaching 99.53 percent achievement rate when defining the corresponding combination. Kulkarni et al.,(2012) describes a methodology for early and accurate detection of plant diseases using the artificial neural network (ANN) and various techniques for image processing. Since the suggested method is based on the classification ANN classifier and the extraction function Gabor filter, it delivers better outcomes with a recognition rate of up to 91%. In Malus domestica, (Bashir et al.,2012) provided disease detection using an efficient technique such as K-mean clustering, texture, and color examination. It utilizes the texture and color characteristics that usually appear in ordinary and impacted fields to classify and acknowledge distinct agriculture. Kaundal et al.,(2006) contrasted the results of standard multiple regression, neural network, and support vector machine.
It was discovered that the SVM-based regression approach gives better result. The best description is the association of environmental circumstances with the amount of disease that could be helpful in disease management, (Bannerjee et al.,2018). There are various methods had been already developed to prevent the losses of the leaf disease. However, for many farmers, these methods are unavailable and require thorough knowledge of the domain or a lot of money and resources to be implemented. In this field of research, there are several existing limitations. One of them is that currently available data sets do not include images from real-life situations that have been compiled and labelled. Another limitation is that the existing methods accuracy is not good for the multiple disease in same plant, (Arsenovic et al.,2019). Therefore, in this paper our agenda is to resolve the above limitations by proposing the architectural model for disease detection in wheat leaf by combination of two methods and compare their accuracy.
Leaf Disease Learning Model from Image
We are proposing a Leaf Disease Learning Model from Image data, processing begins in this scheme with data collection in the form of the knowledge base, then training the data, which is used to apply the different machine learning algorithm. Feature extractor steps to be permitted through pre-processing and then identify the illnesses by implementing the various algorithms. Finally, it is possible to classify the defective region from the images. Fig.1 shows our proposed architecture.
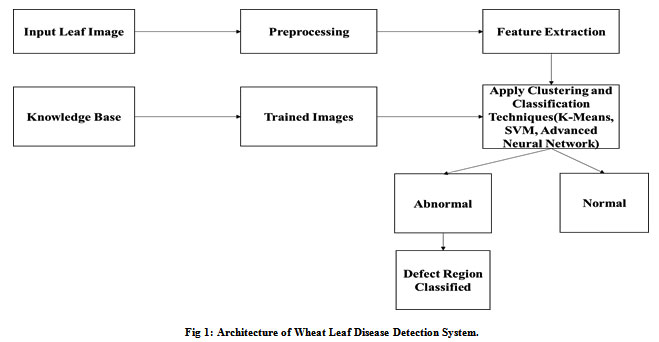 |
Figure 1: Architecture of Wheat Leaf Disease Detection System. |
MATERIALS and METHODS
The proposed methodology for disease identification is explained in the following sub-sections:
Dataset Preparation
We can download images from the website https:/plantvillage.psu.edu/ using the plant and disease names of the keywords. All images can be subsequently categorized into distinct groups. It is an open database with approx. 14,308 Healthy and infected plant leaf pictures were used to train and test the leaf disease detection system. The database used here involves five distinct classes, where each class is described as a couple of leaves of crops and associated disease, while some classes contain healthy crops.
There are 30 distinct healthy or diseased plants in these five groups. More than 1/3 of the images accessible (33.3%) were recorded in the field under actual circumstances of agriculture. Fig. 2 shows random samples of images from different wheat classes. The complexity of the images is evident, contributing to several elements such as various leaves and other plant components, irrelevant items, distinct ground textures, shading impacts, etc. Initially, the entire database was split into two datasets, the training set, and the test set, by dividing the 14,308 images randomly so that 75% of them formed the training set, and 25% formed the test set. Thus, 10,731 images were used for the model training, while the remaining 3,577 images were kept testing the model performance in the classification of new, previously “unseen” images. The first step for Leaf Disease Detection System initialization. First, take the wheat leaf image that has captured from the digital camera. The color of the input image is primary. The primary color is then transformed as required into a gray-scaled color.
Then we experimented with a gray-scaled version of the Plant Village dataset and subsequently run all the tests on a Plant Village dataset version where the leaves were segmented, removed all additional background information that could bring some inherent information. We have evaluated the color, lightness, and saturation aspects of the multiple components of the images. One of the processing measures also enabled us to readily be solved color casts, which occur to be very powerful in some of the dataset subsets.Fig.3 shows for a randomly selected set of leaves with the different versions of the same leaf.
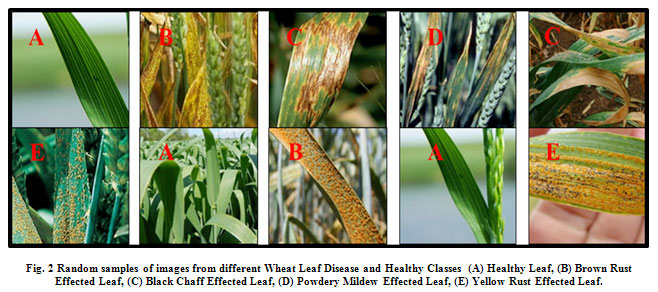
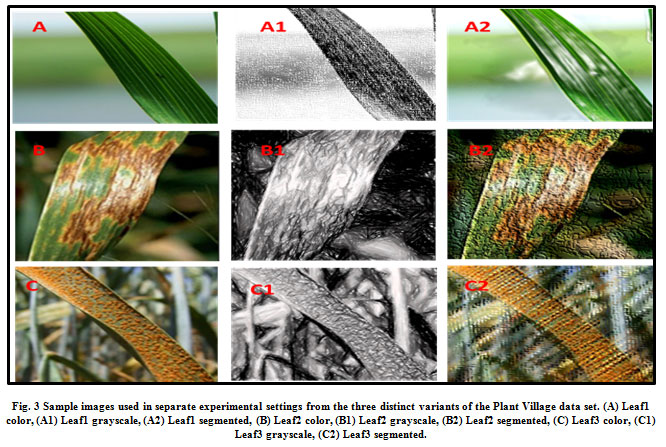
Image preprocessing
Images can be in various formats, quality and resolution in the dataset. For example, images with lower resolution and less than 500px dimensions will not be considered as valid images for the dataset. To extract the necessary data more effectively from the image using pre-processing methods for image resizing and contrast improvement.
Feature Extraction
Machine Learning techniques contain an element at the designing stage. In this stage, specialists propose the hand-made highlights to encourage gaining from precedents. This stage is significant and influences the general execution of the learning framework. Shockingly, include designing is a manual part of the machine learning technique, and it takes more time (Le Cun. et al., 2015). On the other hand, in an advanced machine learning technique feature extraction is embedded with the learning algorithm where features are extracted in a fully automated way without any intervention by a human expert. Feature extraction plays a vital role in the process of facsimile cataloging. Hence, GLCM could be an effectual and right resourceful technique for statistical parameter extraction based on texture mining (Gebejes et. al, 2013). The image features include Correlation, Entropy, Variance, Homogeneity, Contrast, Energy, and Mean are computed. The resulted topographies using the monochrome concentration and positioning can be indicated by the association of active dotted particles whose numerical relatives can be estimated in Table1. The graphical representation of the extracted feature is shown in Fig 4.
Table 1: Average Extracted Features Vector Using GLCM Method.
| S. No. | Contrast | Correlation | Energy | Homogeneity | Mean | Standard Deviation | Entropy | RMS | Variance | Kurtosis | Skewness |
| 1 | 0.520 | 0.82726 | 0.81 | 0.956992 | 11.42 | 42.14 | 1.088 | 3.194 | 1523.1 | 17.921 | 1.8645 |
| 2 | 0.453 | 0.88268 | 0.741 | 0.942985 | 18.62 | 51.96 | 1.6572 | 4.679 | 2206.1 | 10.582 | 2.3426 |
| 3 | 1.195 | 0.76266 | 0.57 | 0.931926 | 25.981 | 60.49 | 2.1984 | 7.044 | 3429.7 | 7.2729 | 1.8866 |
| 4 | 0.6984 | 0.91896 | 0.602 | 0.955868 | 35.465 | 71.82 | 2.391 | 7.347 | 4946.8 | 4.3601 | 2.3403 |
| 5 | 1.2426 | 0.76266 | 0.78 | 0.939879 | 12.649 | 46.03 | 1.0954 | 3.338 | 1823.7 | 16.636 | 3.0963 |
| 6 | 1.2304 | 0.91896 | 0.376 | 0.932311 | 36.484 | 61.36 | 3.7752 | 9.044 | 3009.9 | 5.777 | 2.3511 |
| 7 | 0.7108 | 0.68088 | 0.655 | 0.929282 | 24.433 | 58.77 | 2.0447 | 4.267 | 2085.4 | 7.2405 | 3.2904 |
| 8 | 0.9014 | 0.80841 | 0.576 | 0.927381 | 35.799 | 71.94 | 3.6071 | 7.978 | 3948 | 5.0127 | 3.1041 |
| 9 | 1.1222 | 0.87418 | 0.698 | 0.943924 | 28.194 | 69.98 | 2.4453 | 6.015 | 3597.8 | 6.7964 | 3.0347 |
| 10 | 1.361 | 0.90097 | 0.724 | 0.935854 | 18.952 | 55.79 | 1.9201 | 5.197 | 2359.1 | 11.386 | 4.1762 |
| 11 | 0.7258 | 0.8651 | 0.614 | 0.925867 | 23.879 | 56 | 2.135 | 5.346 | 2258.1 | 7.4625 | 3.7641 |
| 12 | 0.4065 | 0.73879 | 0.75 | 0.94786 | 17.785 | 56.2 | 1.5335 | 4.562 | 2827.8 | 12.644 | 0.8359 |
| 13 | 1.221 | 0.8602 | 0.734 | 0.923988 | 15.923 | 48.57 | 1.4202 | 4.269 | 2039.3 | 11.61158 | 1.6122 |
| 14 | 0.7435 | 0.91903 | 0.757 | 0.938948 | 18.945 | 56.55 | 1.8782 | 4.812 | 2798.3 | 10.949 | 2.836 |
| 15 | 0.2743 | 0.70682 | 0.823 | 0.976112 | 13.225 | 44.84 | 2.1005 | 5.159 | 1703.5 | 20.069 | 1.3342 |
| 16 | 0.2681 | 0.85746 | 0.786 | 0.962688 | 14.843 | 47.85 | 2.0682 | 4.844 | 1490.1 | 16.601 | 1.3215 |
| 17 | 0.6847 | 0.91649 | 0.378 | 0.906731 | 59.88 | 78.53 | 4.5886 | 9.207 | 2859.6 | 2.1288 | 4.221 |
| 18 | 1.1217 | 0.92901 | 0.48 | 0.896516 | 40.152 | 73.24 | 3.153 | 7.711 | 4661.7 | 4.0614 | 3.0734 |
| 19 | 0.5468 | 0.92833 | 0.723 | 0.947347 | 17.922 | 49.77 | 1.6294 | 4.534 | 2051.4 | 10.111 | 0.4327 |
| 20 | 1.8418 | 0.87307 | 0.478 | 0.883095 | 45.042 | 77.61 | 2.9739 | 7.068 | 4540.2 | 3.109 | 0.745 |
| 21 | 1.5751 | 0.84231 | 0.843 | 0.903862 | 47.808 | 80.98 | 3.1664 | 7.936 | 5354.2 | 3.0829 | 1.8645 |
| 22 | 0.8019 | 0.81905 | 0.709 | 0.96402 | 12.901 | 46.13 | 2.0809 | 5.212 | 2015.2 | 19.969 | 2.3426 |
| 23 | 0.328 | 0.86446 | 0.237 | 0.944129 | 16.123 | 44.55 | 1.6311 | 2.662 | 352.88 | 12.241 | 1.8866 |
| 24 | 1.4987 | 0.76745 | 0.27 | 0.877284 | 77.399 | 84.8 | 4.791627 | 11.2647 | 6629.51 | 1.5772 | 2.3406 |
| 25 | 1.346 | 0.86944 | 0.458 | 0.912759 | 62.05059 | 74.62 | 4.5629 | 10.71 | 4388.6 | 2.1224 | 3.0963 |
| 26 | 0.5789 | 0.87351 | 0.789 | 0.97456 | 68.999 | 66.78 | 4.3245 | 6.745 | 345.89 | 2.0789 | 2.0098 |
| 27 | 1.673 | 0.86979 | 0.399 | 0.982114 | 38.987 | 56.93 | 1.89789 | 3.679 | 661.78 | 9.0789 | 1.789 |
| 28 | 0.456 | 0.93412 | 0.897 | 0.911239 | 47.345 | 33.78 | 3.4567 | 5.8769 | 2897.9 | 13.1345 | 0.3344 |
| 29 | 1.876 | 0.8569 | 0.769 | 0.901987 | 59.8796 | 77.84 | 2.9897 | 10.78 | 2345.67 | 2.45908 | 5.789 |
| 30 | 1.798 | 0.789 | 0.749 | 0.80796 | 53.5346 | 79.1 | 1.79854 | 4.8999 | 3987.9 | 10.9089 | 1.0459 |
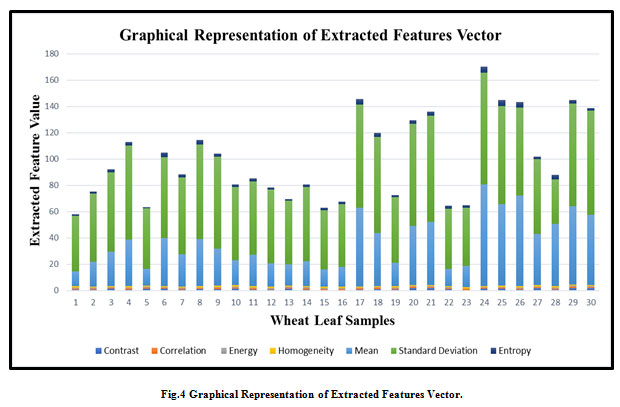 |
Figure 4: Graphical Representation of Extracted Features Vector. |
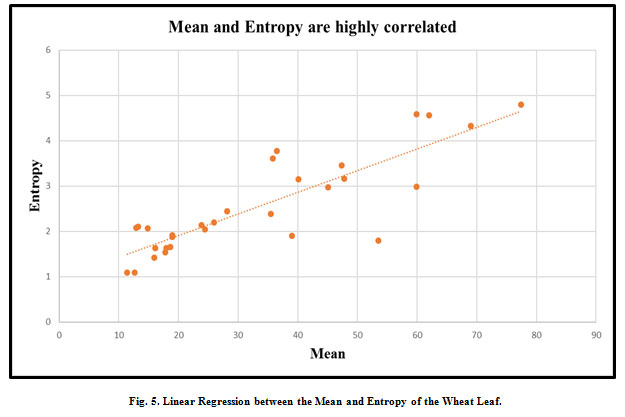 |
Figure 5: Linear Regression between the Mean and Entropy of the Wheat Leaf. |
Training
In this step, train the image of the wheat leaf by using K-means Clustering, Support Vector Machine, and advance neural network for making an image classification model.
Testing
The test set for leaf prediction as healthy/unhealthy with its disease name will be used in this stage to assess the classifier’s output.
Approaches
K-Means Based Clustering Method
This stage involves the use of the K-Means algorithm to cluster an image. Using a group of K-classes, it is a very helpful technique for entity recognition (Dubey et al., 2013). It can be done by limiting the square summation distance between the equivalent cluster and an entity to find the thought-provoking fragment of the source image. In K-Means clustering techniques, clusters are determined by pixel groups with the same value current in an image. Practically, this new image processing technique’s computational acceleration is very quick and provides a more precise output. The input data set is divided into K set of clusters, and each cluster is represented by a completely variable cluster center. Initially, known values are referred to as seed points and data points are also known as inputs. Only the K-Means clustering method can be used to estimate the distances between the centers, inputs, and allocate inputs to the closest center. Following are the steps for K-means grouping:
This stage involves the use of the K-Means algorithm to cluster an image. Using a group of K-classes, it is a very helpful technique for entity recognition (Dubey et al., 2013). It can be done by limiting the square summation distance between the equivalent cluster and an entity to find the thought-provoking fragment of the source image. In K-Means clustering techniques, clusters are determined by pixel groups with the same value current in an image. Practically, this new image processing technique’s computational acceleration is very quick and provides a more precise output. The input data set is divided into K set of clusters, and each cluster is represented by a completely variable cluster center. Initially, known values are referred to as seed points and data points are also known as inputs. Only the K-Means clustering method can be used to estimate the distances between the centers, inputs, and allocate inputs to the closest center. Following are the steps for K-means grouping:
Step 1: Image confirmation.
Step 2: Image transformation from primary color space to L*a*b* Color Space, which helps in the findings of pictorial transformations that present in the primary color space.
Step 3: Here the colors classification can be done in ‘a*b*’ Space using K-means.
Step 4: From the results, pixel ordering, and labeling can be render using K-means by maintaining a return index to the corresponding each cluster.
Step 5: Afterwards, the original image is partitioned based on its k- number of color cluster.
This process has already been implemented in other leaf images to cluster more than one groups having the respective diseases (Sethy et al., 2017). After the successful implementation K-Means cluster-based segmentation, the percentage of the infected area calculated, and features are extracted.
Classification of Diseases by SVM
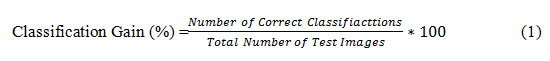
In this phase, the classification and comparison for the leaf diseases of the wheat crop have done through by storing the corresponding feature set of values to their respective dataset. Here a fully controlled learning method of classification is used that is none other than support vector machines (SVM) with high dimension spaces, efficient memory, and versatile decision function. Generally, SVM is categorized into two types: Linear SVM and Multiclass SVM. Linear SVM is used to classify two kinds of data set, and multiclass SVM is used to classify more than two kind of data set. So multiclass SVM is used to classify four types of wheat leaf diseases. First, the extracted feature dataset is optimized using the optimization technique, and then multiclass SVM is used for the classification process. The quantity of cataloging is performed by the proportion of high-scale classification gain, Equation (1).
Advanced Neural Network
There are two significant drawbacks to the machine learning techniques. First, they are extremely dependent on variables patterns as well as characteristics to be extracted. Second, it is necessary to train classifiers many times before applying to applications in the real world (Zhang et.al., 2015) ANNs (Advanced Neural Networks) are the most promising tools for analyzing hyperspectral data. ANNs ‘ mechanism is based on the nervous system of humans. ANNs are very helpful for pattern recognition, irrespective of any specific guidelines for recognition. (Cui et al.,2018) stated that ANNs need fewer formal statistics and are capable of modeling complicated nonlinear situations. There is an increasing interest in applying ANNs to achieve the greater goal of disease detection in wheat crop using hyperspectral data. ANNs have a higher degree of diagnosing ability than Neural Networks (NNs) (Ettabaa et. al.,2018). As a non-invasive rapid detection method, (Zhu et al.,2017) explored the potential of hyperspectral imaging. The Advanced Neural Networks support the strongest ability to discriminate against plant diseases because they combine the finest sets of trainers for precise classification. It can be used to detect four diseases, namely black chaff, brown rust, powdery mildew, yellow rust. The proposed framework for the advanced neural network represented in Fig. 6. This framework helps to detect leaf diseases accurately and automatically.
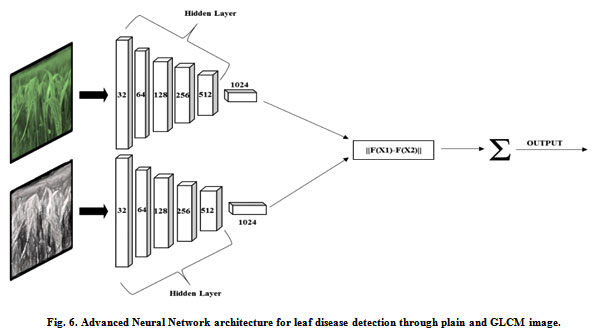 |
Figure 6: Advanced Neural Network architecture for leaf disease detection through plain and GLCM image. |
RESULTS and DISCUSSION
There is various type of diseased wheat leaf samples is taken as input. In this paper, four types of wheat leaf diseases are considered i.e. Brown Rust, Black Chaff, Powdery Mildew, and Yellow Rust. Fig. 7 shows the input image and output image classified as wheat Black Chaff disease. Fig. 8 shows the input image and output image classified as Brown Rust disease. Fig. 9 shows the input image and output image classified as Powdery Mildew disease. Fig. 10 shows the input image and output image classified as Yellow Rust disease. By the help of this proposed method, the total of 30 sets of wheat crop leaf disease specimens is taken and categorized into four broad categories of diseases which has displayed in Table 2 and Fig. 11. Among 30 number of test samples of Brown Rust Diseased leaf and Yellow Rust Diseased are erroneously classified as Brown and Yellow Spots on the leaf, which imply 93.33% and 90.00 % of accuracy respectively. And the other two categories of diseased leaf i.e. Black Chaff Disease and Powdery Mildew disease are successfully classified with 100% of accuracy. The average accuracy of the classification of the proposed method is 95.83%. In this paper, classification is first done using the K-Nearest Neighborhood (KNN) using K-Mean’s grouping with a productivity accuracy of 77.90%. The finding precision is enhanced by 85.64% using the advanced neural network (ANN). For the next stage, cataloging is done through using SVM ordering process and whose productivity accuracy of 90.50%. Here also we compare with other classification techniques with our proposed method and examine the performance analysis with respect to every four types of diseases which is illustrated in Table 3 and Fig.12. After all, among all classification techniques, the SVM technique result is outperforming, i.e. accuracy of 90.50%, illustrated in Fig. 13.
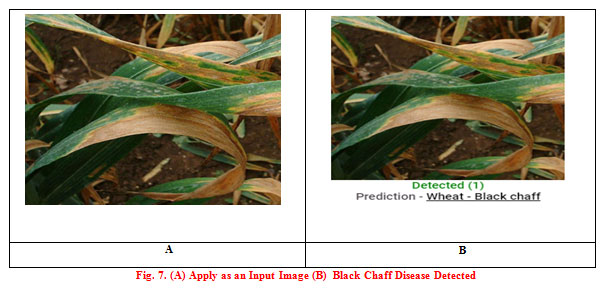 |
Figure 7. (A) Apply as an Input Image (B) Black Chaff Disease Detected |
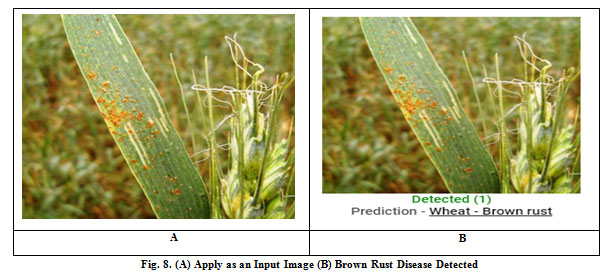 |
Figure 8: (A) Apply as an Input Image (B) Brown Rust Disease Detected |
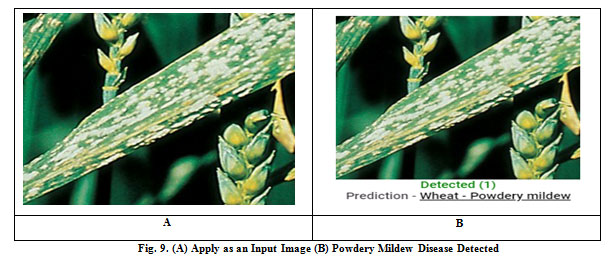 |
Figure 9: Fig. 9. (A) Apply as an Input Image (B) Powdery Mildew Disease Detected |
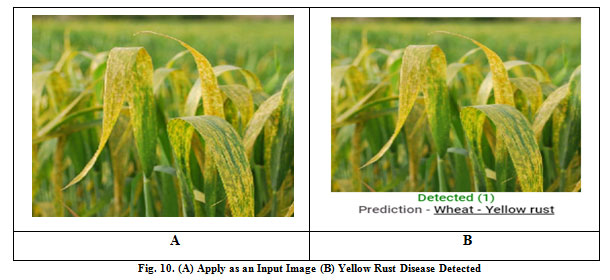 |
Figure 10: Fig. 10. (A) Apply as an Input Image (B) Yellow Rust Disease Detected |
Table 2: Classification results for different diseases for Proposed Method
| Leaf Disease | Black Chaff Disease | Brown Rust Disease | Powdery Mildew Disease | Yellow Rust Disease | Accuracy (%) |
| Black Chaff Disease | 30 | 0 | 0 | 0 | 100 |
| Brown Rust Disease | 0 | 28 | 0 | 2 | 93.33 |
| Powdery Mildew Disease | 0 | 0 | 30 | 0 | 100 |
| Yellow Rust Disease | 0 | 3 | 0 | 27 | 90 |
| Average Accuracy (%) | 95.83 | ||||
Table 3: Comparison of different classification techniques for different diseases. (a) Combination of the Gray-Level Co-Occurrence Matrix and K- Nearest Neighbor Experimented values, (b) Combination of the Gray-Level Co-Occurrence Matrix and Artificial Neural Network Experimented values, (c) Combination of the Gray-Level Co-Occurrence Matrix and Support Vector Machine Experimented Values.
| Leaf Disease | GLCM+ KNNa | GLCM+ ANNb | GLCM+ SVMc |
| Black Chaff Disease | 78.02 | 84.00 | 91.11 |
| Brown Rust Disease | 80.00 | 85.50 | 90.02 |
| Powdery Mildew Disease | 75.20 | 88.08 | 90.00 |
| Yellow Rust Disease | 78.40 | 85.00 | 91.01 |
| Average Accuracy (%) | 77.90 | 85.64 | 90.50 |
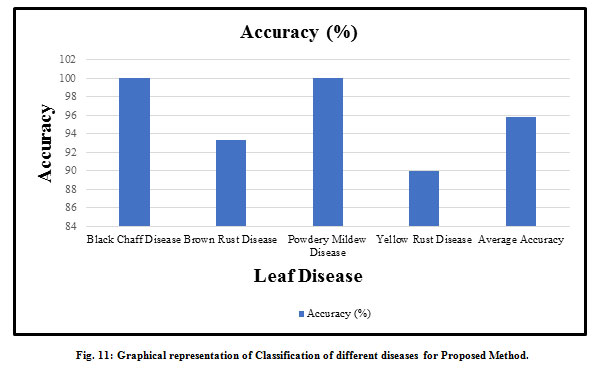 |
Figure 11: Graphical representation of Classification of different diseases for Proposed Method. |
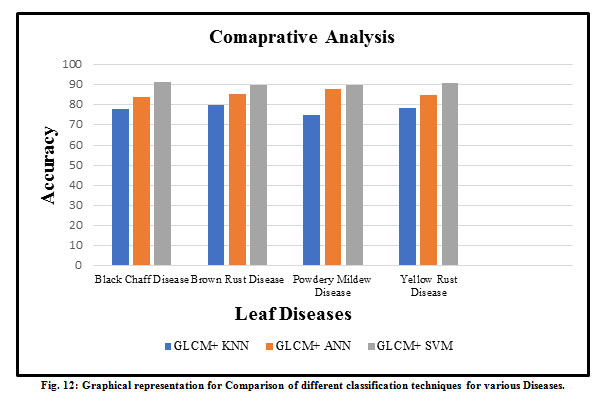 |
Figure 12: Graphical representation for Comparison of different classification techniques for various Diseases. |
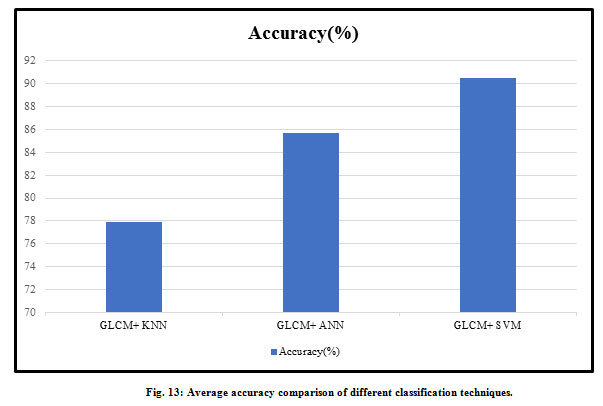 |
Figure 13: Average accuracy comparison of different classification techniques. |
CONCLUSION
In this paper, we suggest a leaf disease prediction model that can learn from the image datasets and then apply the different methods of machine learning for disease identification of the infected leaf. Protection of crops in organic farming is not an easy matter. Based on K-means clustering, SVM, advanced neural networks, advanced machine learning models were created in our scheme to detect leaf diseases. Our model use images that were captured by different camera systems and gathered from different resources. Our experimental findings and comparisons between distinct techniques with feature extractors showed how our sophisticated machine-learning-based model could effectively identify distinct categories of diseases in distinct crops as well as provide solutions for diseases. The proposed methodology was successfully tested and verified from the execution point of view on various types of wheat leaf diseases such as black chaff, brown rust, powdery mildew, yellow rust. Moreover, it was seen that the best result could be obtained resourcefully using least methodical pains to check the productivity of scheduled techniques. Another perspective of employing this method is that the plant disease can be documented at the beginning or primary stage only. SVM, therefore, proved to be the promising method for differentiating and categorizing wheat leaf diseases with other methods by using extracted feature vector dataset. Collecting a larger number of samples with more variation of the diseased wheat leaf can extend the study. We hope that our suggested scheme will contribute to agricultural research in a provocative manner.
ACKNOWLEDGEMENTS
The corresponding author wishes to thank Prof K.K. Raina and Prof. B. S. Panwar for the great cooperation and motivation for this research.
REFERENCES
Andreas Kamilaris, Francesc X. Prenafeta-Boldu (2018) Deep learning in agriculture: A survey, Computers and Electronics in Agriculture Vol 147 Pages 70–90.
Bannerjee, G., Sarkar, U., Das, S., Ghosh, I., (2018). Artificial Intelligence in Agriculture: A Literature Survey. International Journal of Scientific Research in Computer Science Applications and Management Studies. 7 (3), 1–6.
Bashir Sabah, Sharma Navdeep. (2012) Remote area plant disease detection using image processing. IOSR J Electron Communication Engg; 2(6):31–4. ISSN: 2278-2834.
Cui S, Ling P, Zhu H, Keener H. (2018) Plant pest detection using an artificial nose system: a review. Sensors;18(2):378.
Dubey, S. R., Dixit, P., Singh, N., & Gupta, J. P. (2013). Infected fruit part detection using K-means clustering segmentation technique. IJIMAI, 2(2), 65-72.
Ettabaa KS, Ben Salem M. (2018) Adaptive progressive band selection for dimensionality reduction in hyperspectral images. Journal of the Indian Society of Remote Sensing; 46(2):157–67.
Fujita, E., Kawasaki, Y., Uga, H., Kagiwada, S., Iyatomi, H.: Basic investigation on a robust and practical plant diagnostic system, (2016).15th IEEE International Conference on Machine Learning and Applications, ICMLA, pp. 989–992.
Gebejes, A., & Huertas, R. (2013). Texture characterization based on grey-level co-occurrence matrix. In Proceedings in Conference of Informatics and Management Sciences.
Jiang Lu, Jie Hu, Guannan Zhao, Fenghua Mei, Changshui Zhang, (2017) An in-field automatic wheat disease diagnosis system, Computers and Electronics in Agriculture Vol 142 Pages 369–379.
Konstantinos P. Ferentinos, (2018) Deep learning models for plant disease detection and diagnosis Computers and Electronics in Agriculture Vol 145 Pages 311–318.
Kulkarni Anand H, Ashwin Patil RK. (2012) Applying an image processing technique to detect plant diseases. Int J Mod Engg Res;2(5):3661–4.
Kirtan Jha, Aalap Doshi, Poojan Patel, Manan Shah, (2019) A comprehensive review on automation in agriculture using
artificial intelligence. Artificial Intelligence in Agriculture Vol 2 Pages 1–12 https://doi.org/10.1016/j.aiia.2019.05.004.
LeCun, Y., Bengio, Y., Hinton, G. (2015): Deep learning. Nature 521(7553), 436–444.
Marko Arsenovic, Mirjana Karanovic, Srdjan Sladojevic, Andras Anderla and Darko Stefanovic, (2019). Solving Current Limitations of Deep Learning Based Approaches for Plant Disease Detection. Symmetry11(7),939;https://doi.org/10.3390/sym11070939
Rakesh Kaundal, Amar S Kapoor and Gajendra PS Raghava, (2006) “Machine learning technique in disease forecasting: a case study on rice blast prediction,” BMC Bioinformatics.
Sethy P., Negi B., & Bhoi N. (2017). Detection of Healthy & Defected Diseased Leaf of Rice Crop Using K-Means Clustering Technique. International Journal of Computer Applications, 157(1), 0975-8887.
Shuang-Qi Tian, Yong-Heng L, Zhi-Cheng C, Yong-Feng Q (2017) Effects of layering milling technology on distribution of green wheat main physicochemical parameters. Journal of Food Quality Article ID 8097893: 1-7.
Sanchez, P.A., and Swaminathan, M.S. (2005). Cutting world hunger in half. Science307,357359.doi:10.1126/science.1109057.
UNEP (2013). Smallholders, Food Security, and the Environment. Rome: International Fund for Agricultural Development (IFAD).
Vidyashanakara, Naveena M, G Hemnatha Kumar (2018). Leaf Classification Based on GLCM Texture and SVM, International Journal on Future Revolution in Computer Science & Communication Engineering Vol 4 Issue: 3 Pages 156-159
Yitayal Abebe and Adam Bekele (2017). Vulnerability of Smallholder Farmers to Climate Change in the Central Rift Valley of Ethiopia: A Gender Disaggregated Approach. Ethiop. J. Agric. Sci. 27(2) 85-97
Zhang B, Huang W, Wang C, Gong L, Zhao C, Liu C, et al. (2015) Computer vision recognition of stem and calyx in apples using near-infrared linear-array structured light and 3D reconstruction. Biosyst Engg; Vol 139 Pages 25–34.
Zhu H, Chu B, Zhang C, Liu F, Jiang L, He Y. (2017) Hyperspectral imaging for pre-symptomatic detection of tobacco disease with successive projections algorithm and machine learning Classifiers. Sci Rep;7(1):4125.

