1Lecturer,Department of Pathology,Saveetha Dental College and Hospitals, Saveetha Institute of Medical and Technical Sciences, Chennai, Tamil Nadu.
1*Associate Professor, Department of Pathology,Saveetha Institute of Medical and Technical Sciences, Chennai, Tamil Nadu.
Corresponding author email: mpbrundha7@gmail.com
Article Publishing History
Received: 26/10/2020
Accepted After Revision: 06/12/2020
Time management comprises one of the most customary points in the field of learning and study techniques, involving a focal situation in the courses and various handbooks on study aptitudes. Time management can be characterized as the way toward arranging and performing pre-decided exercises over a particular length of time, fundamentally with the objective of expanding profitability, adequacy and effectiveness. It requires a cautious adjusting between professional life, social activity, hobbies or other activities. There are two dominating perspectives in presence regarding time management – multi-active time view and linear-active time view. The latter spotlights on a more prominent number of errands on the double, though, linear-active time view centers around each specific assignment in turn. Time management successfully goes about as a strategy for seat stamping progress and positively affects scholarly execution. This study aims at studying the effectiveness in time management among college students of various courses.
In this experimental research, 160 college students were selected across various colleges in Chennai. Questionnaires were prepared and distributed to the participants through an online portal. The descriptive statistics was carried out and chi square test was used and p value was calculated through SPSS software. The results have shown that there is significant statistical difference (p value < 0.05) with respect to time management. The results show that 36.8% of the female students spend more time in studying than the male students, 50.6% of the female students concentrated for more than half the class time during the lecture class than the male students and 49.3% of the female students felt that preparing timetable before exams for studying will improve their grades.
Time Management, Students, Examination, Performance, Results
Anjali A. K, Brundha M. P. A Survey on Time Management Among Students of Higher Education. Biosc.Biotech.Res.Comm. 2020;13(4).
Anjali A. K, Brundha M. P. A Survey on Time Management Among Students of Higher Education. Biosc.Biotech.Res.Comm. 2020;13(4). Available from: https://bit.ly/356oTCR
Copyright © Anjali and Brundha This is an Open Access Article distributed under the Terms of the Creative Commons Attribution License (CC-BY) https://creativecommons.org/licenses/by/4.0/, which permits unrestricted use distribution and reproduction in any medium, provide the original author and source are credited.
INTRODUCTION
The progress from higher secondary schooling to college speaks a significant change in the lives of youngsters. An exceptionally organized profoundly directed home condition to moderately unaided, unstructured ground conditions is a drastic change for youngsters. Despite the fact that numerous undergraduates have similar curricular and extracurricular demands on their time as they did before going to college, they are not required to truly be in a solitary structure for 8 hours every day nor are their recreation exercises observed by guardians. These external constraints do not have a role to play in their daily life activities and are free to choose their work as time permits which include devoting time for studies, socializing, engaging themselves in their passionate works, or other entertainment activities. The age clearing its path towards the beginning of the second decade of the 21st century has an exceptional number of alternatives regarding how to manage their recreation or leisure time. Their adolescence matched with the advocacy of new media served to duplicate the number of encounters. Academic competence is related to the student’s capacity to deal with their investigation load and is utilized to survey if the students can deal with the exam material in the curriculum.
It additionally gives a sign of whether the educational program is intriguing enough for students to make the most of their classes. Academic fitness has appeared to influence the student’s scholarly exhibition and an undergraduate with better scholastic skills would likely have better scholarly performance (Kleijn, Ploeg and Topman, 1994).In this examination, scholastic competency is characterized as the capability of students as for the substance instructed during courses over the past scholarly year and their capacity to comprehend the course material. Another factor is related to a student’s scholastic execution is test competence which reflects how higher education students adapt to the measure of study material for examinations (Indrieş and Bochiş, 2019).
It alludes to challenges related to dealing with the measure of study material for an assessment and in getting ready for them. Test competency is operationally characterized as any undergraduate or postgraduate’s capacity to oversee and adapt to the measure of study material for assessments as well as tests. Vital considering strategies may assist higher education students with accomplishing a high GPA. Vital considering is characterized as the information and utilization of compelling investigation abilities or procedures by students. There are numerous proficient examination methods that could be utilized by higher education students dependent on the learning environment. These investigation techniques incorporate Know-Want-Learn (K-W-L), Survey-Question-Read-Recite-Review (SQ3R), summarizing and note-taking, utilizing graphics, and self-questioning (Wiles, 1968; Brown and Day, 1983; Ogle, 1986; Armbruster, Anderson and Meyer, 1991; Burke, 2002; Pearson et al.., 2016).
Extensive course stacks and the comprehensive data shrouded in the present pharmacy educational programs require the utilization of viable examination methodologies for scholarly success. Time management aptitudes are additionally imperative to scholarly achievement. Time management has been characterized as groups of social ranges of abilities that are significant in the association of study/course load (Mchargue, 1977; Lay and Silverman, 1996; Deshler et al.., 2001).Time management skills incorporate exercises performed by students, for example, arranging ahead of time, organizing work, test arrangement, and following schedules (Kirschenbaum and Perri, 1982). Higher scholarly execution might be accomplished by adjusting the time management domain and study strategies effectively (Powell, 2004; Entwistle and Ramsden, 2015).
In this investigation, the time management area was operationalized as the capacity of higher education students to shuffle relaxation and study time to plan for their examinations (Hembree, 1988; Sarason and Sarason, 1990; Seipp, 1991). Test anxiety is adversely connected with scholarly performance Test tension is a set of responses like worry, depression, nervousness, task-irrelevant cognitions(Sarason, 1980; Zeidner, 2006), etc, to a class of stimuli arising from an individual’s experience of assessment or testing Test nervousness in this study was defined as the reaction to stimuli that are associated with an individual’s experience of testing or evaluative situations. Various programs that include the methods to reduce or improve the stress levels will help students to improve scholastic execution by decreasing feelings of anxiety.
Demographic details, for example, student’s age, sexual orientation, ethnicity, and marital and work status may likewise impact a student’s uneasiness levels (Lapp, 2011) The essential target of this investigation was to investigate the impact of scholarly ability, test capability, time management, vital examining aptitudes, and test tension on students’ scholastic execution. Early detection and understanding reasons for scholastic disappointment may enable certain students to perform better if satisfactory direction on progress is given proficiently (Powell, 2004; Entwistle and Ramsden, 2015).
Academic stress is supposed to be an upsetting pattern among the undergraduate students. Academic stressors affecting the college students include the lifestyle with respect to their health; time invested for studying, their financial limitations, self-imposed factors and the major criteria which is the time. These stressors were categorized based on the student’s perception of an extensive knowledge base and the perception of inadequate time required for it (Macan et al.. 1990). Poor time management behaviours, for example, not apportioning time appropriately or last-minute packing for tests, have been as often as possible examined as a wellspring of stress and helpless scholastic execution. As sensible as these desires seem to be, just a couple of experimental contemplates have endeavoured to test these connections. With an end goal to address this lack, we planned our examination to evaluate connections of higher education students’ time to the board to self-revealed scholastic execution and different feelings of pressure.
The essential proposals are to recognize needs and rank them with respect to their significance or need, and afterward apportion time and assets appropriately. Different tips include: Try to deal with each bit of paper just a single time, delegate work, and consistently ask yourself “What is the best utilization of my time at this moment?” Of the constrained exploration that has managed time on the board, most investigations have concentrated on the impacts of various kinds of guidance on saw pressure and conduct. Despite the fact that this past examination experiences methodological blemishes, the discoveries appear to demonstrate that preparation can change how one invests energy (Powell, 2004; Entwistle and Ramsden, 2015).
Undergraduate students report encountering scholarly worry at unsurprising occasions every year with the best wellspring of scholastic pressure coming about because of taking and reading for tests, grade rivalry, and the enormous measure of substance to ace in a modest quantity of time. At the point when stress is seen contrarily or experienced unnecessarily, students also face physical and mental weakness (Misra and Castillo, 2004). At the point when stress is seen contrarily, or when it becomes exorbitant higher education students experience physical and mental impedance. Strategies to diminish worry by higher education students regularly incorporate successful time with the executives, positive reappraisal, social help, and commitment to positive relaxation exercises.
Relaxation fulfilment is characterized as the constructive sentiment of satisfaction one sees because of addressing individual needs through recreation exercises. The administration aptitudes that make an interpretation of inspiration into the real world and adapting to mental imperatives between exercises are additionally significant (Jackson, Crawford and Godbey, 1993). These official capacities incorporate time the executives and objective directedness, (Goodale and Witt. 1980). Seen absence of time is frequently identified with hesitance to take part in life exercises. Time management is a self‐regulatory expertise that includes observing the most effective approaches to utilize time.
MATERIAL AND METHODS
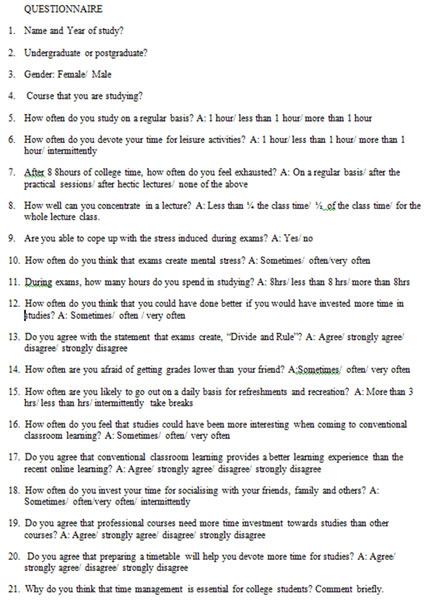
Sample collection: A total of 20 questions with multiple choice options (Annexure 1) were distributed among 160 college students studying various courses from different universities across Chennai. The questionnaire included questions regarding study time, recreation and leisure time and also various other constraints such as concentration time during lecture classes, preparing timetables to study for exams. Sampling Method: In the present study, the sampling method used is a random sampling method. Data Collection And Tabulation- The responses of the study population were retrieved in the google sheets and then tabulation of the data finally and the question comparison was done. The representation of the data is through the bar graph.
Annexure 1
Statistical Analysis: The statistical software used IBM SPSS V23.The statistical test used is Chi square test (p value).The software helps to describe the data and provide descriptive statistics, frequencies and percentage analysis for categorical variables and SD was used for continuous variables to find significant difference between the bivariate samples of independent groups. Inclusion Criteria: Selection criteria include age greater than or equal to 18 years and undergraduate and postgraduate students of medical, dental profession and students of other courses who are willing to participate were included in this study. Exclusion Criteria: Students who are willing to participate and other students were excluded from this study.
RESULTS AND DISCUSSION
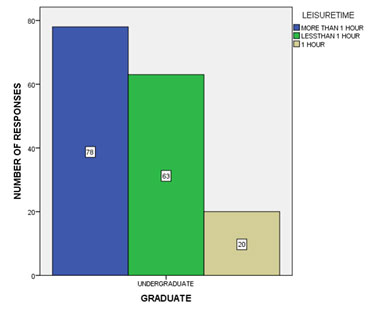
The results showed that all (100%) participants were undergraduate students and data collected were tabulated in google sheets and analysed in SPSS version 23. The figure 1 showed that the majority of the study population were females (79.3%) than males (21.25%). In our study population, the majority were undergraduate BDS students (73.75%), followed by 16.25% were students from other professional courses and 10.6% of MBBS students (figure 2). It was found that only 43.75% of the students study daily for more than 1 hour. Majority of the students study only for 1 hour or less 1 hour daily (figure 3). As in figure 4 around 50% of the students felt exhausted after normal class hours, remaining felt exhausted after hectic lectures and practical sessions. Similarly, 48.75% of the students were taking more than 1 hour for leisure activities and the remaining were taking leisure activities for exactly 1 hour or less than that (figure 5).
Figure 1: Bar graph shows the gender distribution of the study population. It shows that 79.3% of them were female (Blue) and 21.25% of them were males (green).
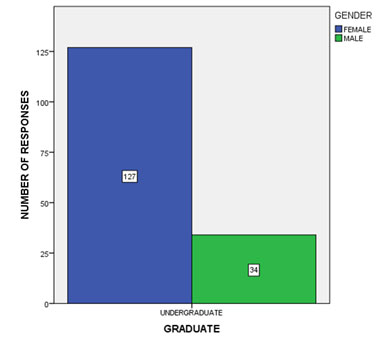
Figure 2: Bar graph shows the profession of the study population where 73.75% of them were BDS students, 10.6% were MBBS students and 16.25% belonged to other professional courses.
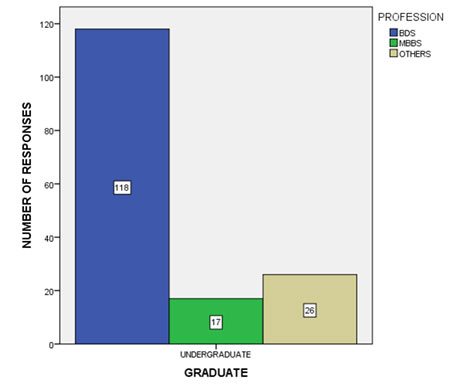
Figure 3: Bar graph shows the frequency distribution of student’s study time on a daily basis. It shows 43.75% of the students studied for more than 1 hour, 16.8% of the students studied for less than 1 hour and 40% of the students studied for exactly 1 hour.
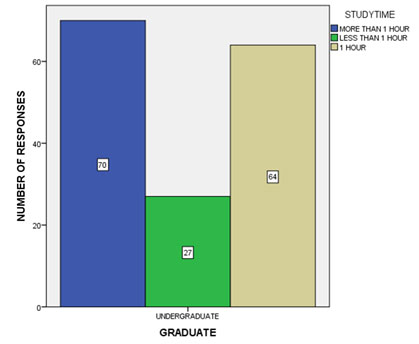
Figure 4: Bar graph depicts the frequency distribution of students getting exhausted on a daily basis. It shows that 23.75% of the students felt exhausted after hectic lectures, 49.375% of them felt exhausted even after the normal class days, 15% of the students felt exhausted after the practical sessions due to the workload experienced by them and 12.5% of the students did not get exhausted to the above said reasons.
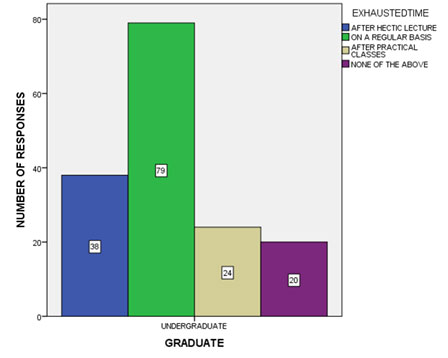
Figure 5: Bar graph shows the frequency distribution of students taking leisure time on a routine basis. It shows that 48.75% of the students take more than 1 hour for leisure activities, 39.375% of the students opted for less than 1 hour of leisure time and 12.5% of the students took exactly 1 hour of leisure time on a daily basis.
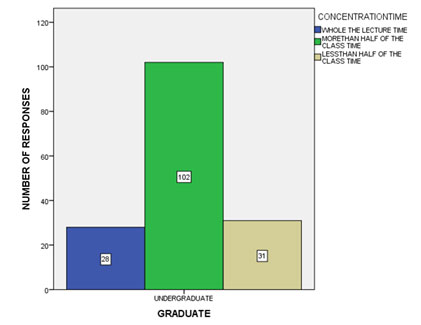
In figure 6 it was shown that only 17.5% can concentrate during the whole lecture class irrespective of the class hours, 19.375% of the study population could concentrate only for less than half of the lecture time and a majority of the study population opted that they could concentrate for more than half of the lecture time but not for full class time. This was well correlated with a study in which the authors discussed the focal points related to successful time management in which the instructions were allegedly various. In addition, inefficient time management practices, for example, inappropriate designation of time for work tasks, packing for tests and neglecting to comply with time constraints set by scholastic staff are often referred to as a significant source of stress and inefficient scholarly execution (Middendorf and Macan, 2002).
Figure 6: Bar graph shows the frequency distribution of students concentrating in a lecture conducted in their respective colleges. It shows that 17.5% of the students could concentrate for the whole of the lecture class, 63.75% of the students could concentrate for more than half the lecture time but not for full class and 19.375% of the students could concentrate only for less than half the lecture time.
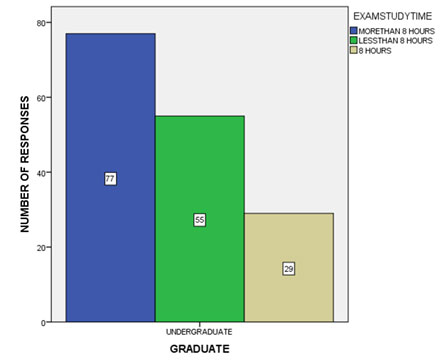
In relation to the exam and the study holidays (figure 7 and 8), 31.25% of the students agreed that they managed exam stress, 43.125% of the students that they could sometimes manage but fail to do so the rest of the time and 26.25% of the students agreed that they were not able to manage the exam stress. 26.8% of the students have opted that they often have stress during exam time, 23.12% of the students have agreed that they always have exam stress, 43.75% of the students have said that they experience exam stress only sometimes, 5% of the students rarely experienced stress during exams and 1.87% of the students never experienced exam stress. During study holidays, 48.12% of the students’ study for more than 8 hours during the exam time, 34.7% of the students’ study for less than 8 hours during exam time and 18.2% of the students studied exactly 8 hours a day during exam time (figure 9).
Figure 7: Bar graph shows the frequency distribution of students agreeing to manage their exam stress. It shows that 31.25% of the students agreed that they managed exam stress, 43.125% of the students that they could sometimes manage but fail to do so the rest of the time and 26.25% of the students agreed that they were not able to manage the exam stress.
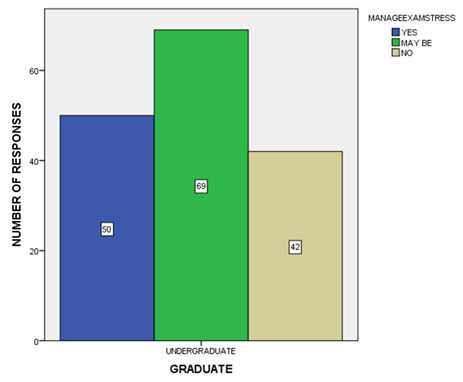
Figure 8: Bar graph shows the frequency distribution of how often the students have stress during their exam. 26.8% of the students have opted that they often have stress during exam time, 23.12% of the students have agreed that they always have exam stress, 43.75% of the students have said that they experience exam stress only sometimes, 5% of the students rarely experienced stress during exams and 1.87% of the students never experienced exam stress.
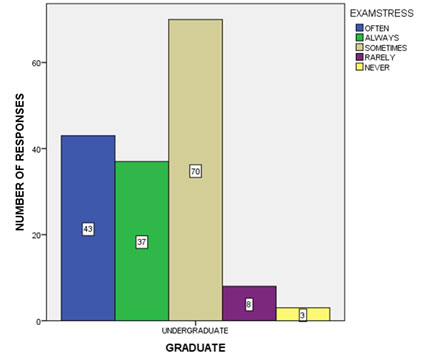
Figure 9: Bar graph shows the frequency distribution of students devoting their time to study during exam. It shows that 48.12% of the students study for more than 8 hours during the exam time, 34.7% of the students study for less than 8 hours during exam time and 18.2% of the students studied exactly 8 hours a day during exam time.
In figure 10 shows that 33.7% of the students (study population) have very often felt that they could have done better if they had devoted more time in studies, 24.37% of the students often felt the same, 32.5% of the students sometimes felt that they could have done better during exams, 1.87% of the students rarely felt and 1.87% of the students never felt that they could have done better even though they invested more time towards studies. In figure 13 we showed that 9.3% of the students spend more than 3 hours for their recreation, 40.6% of the students intermittently take breaks while studying and 50.65% of the students spend less than 3 hours for recreation. Around 39.3% of the students often spend time with their friends and family members in the study holidays, 26.25% of the students very often spend their time with them, 31.8% of the students sometimes spend time with friends and family and 3.12% of the students spend their time intermittently (figure 16).
Figure 10: Bar graph shows the frequency distribution of students afraid of getting grades lower than your friends. It shows that 17.5% of the students always had the fear of getting low grades than their friends, 52.5% of the students sometimes felt that they were afraid and 30.6% of the students never had the fear of getting low grades.
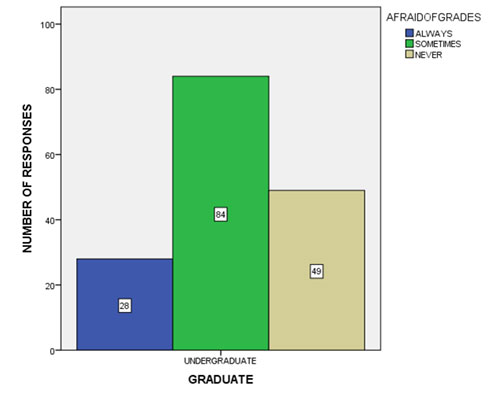
Figure 11: Bar graph shows the frequency distribution of students devoting their recreation time on a routine basis. It shows that 9.3% of the students spend more than 3 hours for their recreation, 40.6% of the students intermittently take breaks while studying and 50.625% of the students spend less than 3 hours for recreation.
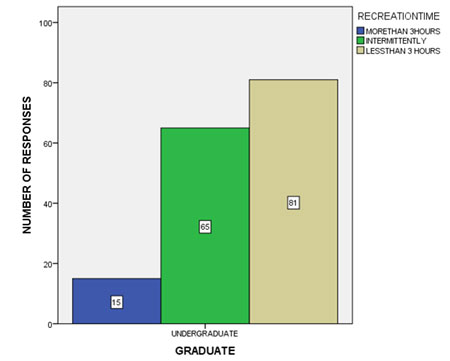
Figure 12: Bar graph shows the frequency distribution of students agreeing for conventional classroom learning rather than online learning. 35.6% of the students strongly agreed that classroom learning is more effective than the recent online learning, 8.12% of the students strongly disagreed that they did not felt that classroom learning did not prove to be very effective than the online learning, 11.8% of the students disagreed, 21.8% of the students agreed to the same and 23.12% were neutral regarding the statement.
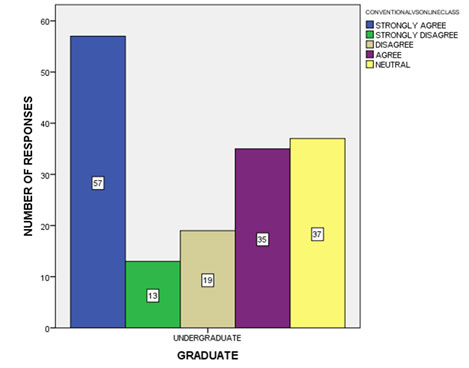
Figure 13: Bar graph shows the frequency distribution of students spending their time with family, friends and others. It shows that 39.3% of the students often spend time, 26.25% of the students very often spend their time with them, 31.8% of the students sometimes spend time with friends and family and 3.12% of the students spend their time intermittently.
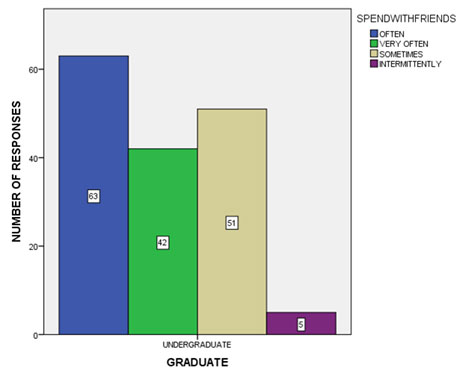
Figure 14: Bar graph shows the frequency distribution of students agreeing to differences in investing time for studies for professional courses than other courses. It shows that 27.5% of the students strongly agreed that professional courses needed more time investment than other courses, 3.75% of the students strongly disagreed to the same, 6.875% of the students disagreed, 38.75% of the students agreed and 17.5% of the students felt neutral regarding the said statement.
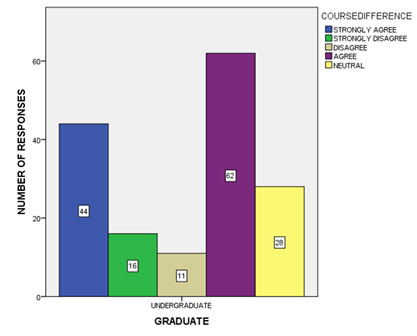
Figure 15: Bar graph shows the association between gender and the recreation time during their daily routine. X-axis represents the gender and Y axis represents the number of responses to recreation time. Majority (40.6%) of the female students agreed that they spend less than 3 hours for their recreation time than male students. There is a significant difference between the group and recreation time. Chi square test was used to associate the variables, p value 0.000 (p<0.05), Hence statistical significance present.
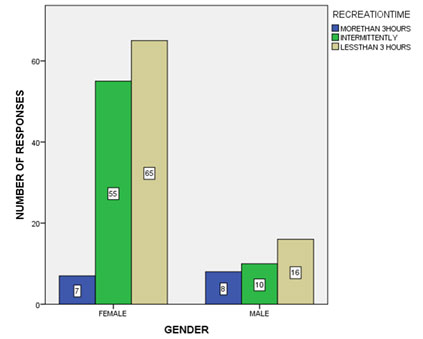
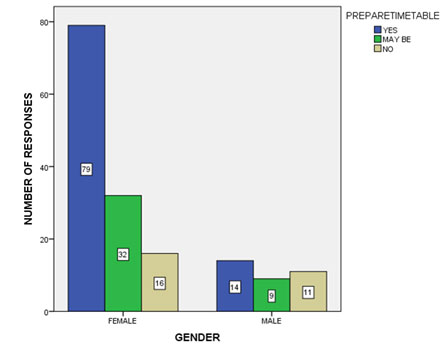
Figure 16: Bar graph shows the association between gender and the opinion on preparing timetables to study on a daily basis. X-axis represents the gender and Y axis represents the number of responses regarding the opinion on preparing timetables to study on a daily basis. Majority (49.37%) of the female students felt that preparing timetables for studying will therefore improve their quality time more than male students. There is a significant difference between the group and recreation time. Chi square test was used to associate the variables, p value 0.000 (p<0.05), Hence statistical significance present.
As shown in the figure 17, 27.5% of the students strongly agreed that professional courses needed more time investment than other courses, 3.75% of the students strongly disagreed to the same, 6.875% of the students disagreed, 38.75% of the students agreed and 17.5% of the students felt neutral regarding the said statement. A study done by Classens et al. (2007) characterized time management as “behaviours that aim at achieving an effective use of time while performing certain goal-directed activities “. Broadly, time management alludes to exercises that infer a successful utilization of time that is considered to encourage efficiency and ease pressure. A typical component among conceptualizations of time management is “planning behaviour (Classens et al.., 2007). Divide and rule (divide et impera in Latin) is a policy discovered by British ruling system in India to gain and maintain large concentrations of power into pieces of lesser power. This rule will be applicable to studies also in the matter that a larger part of the study area may be divided into small portions and then it will be easier for the reader to understand the concepts and retain the matter for a longer period (Sandhu, 2009).
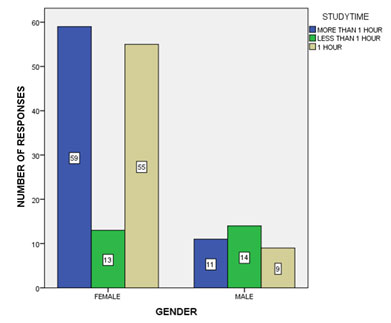
Figure 17: Bar graph shows the association between gender and study time. X-axis represents the gender and Y axis represents the number of responses regarding the study time on a daily basis. Majority (36.8%) of the female students spent more than 1 hour for their studies on a regular basis than male students. There is a significant difference between the group and recreation time. Chi square test was used to associate the variables, p value 0.000 (p<0.05), Hence statistical significance present.
In our study, we included the same and obtained a result that 21.8% of the students strongly agreed to the statement ‘Divide and Rule’ worked out very well for them, 13.75% of the students disagreed with the statement and 64.3% of the students agreed with the statement (figure 11). As a usual phenomenon, the students compare the marks (Falchikov and Goldfinch, 2000) with the marks of their peers after the exam results. We included these criteria in our study and found that 17.5% of the students always had the fear of getting low grades than their friends, 52.5% of the students sometimes felt that they were afraid and 30.6% of the students never had the fear of getting low grades (figure 12).
58.12% of the students agreed that preparing timetables would help them in studying systematically, 25.6% of students agreed that maybe the preparation of timetable could have been of some help and 16.8% of the students disagreed with the statement (figure 18). A traditional and conventional classroom teaching and learning is now becoming an old entity as the students and the teaching systems are moving towards e-learning (Zhang et al.., 2004). In this belief, we found that 29.3% of the students often agreed that classroom learning could have been more creative, 27.5% of the students always felt that classroom learning could have been more creative, 51.25% of the students sometimes felt the same and 4.3% of the students rarely felt the need to incorporate creative thinking in classroom learning(figure 14). Out of 100% study population, 35.6% of the students strongly agreed that classroom learning is more effective than the recent online learning, 8.12% of the students strongly disagreed that they did not feel that classroom learning did not prove to be very effective than the online learning, 11.8% of the students disagreed, 21.8% of the students agreed to the same and 23.12% were neutral regarding the statement(figure 15).
Figure 18: Bar graph shows the association between gender and concentration time during a lecture class. X-axis represents the gender and Y axis represents the number of responses regarding concentration time during a lecture class. Majority (50.6%) of the female students were able to concentrate for more than half the lecture time than male students. There is a significant difference between the group and recreation time. Chi square test was used to associate the variables, p value 0.000 (p<0.05), Hence statistical significance present.
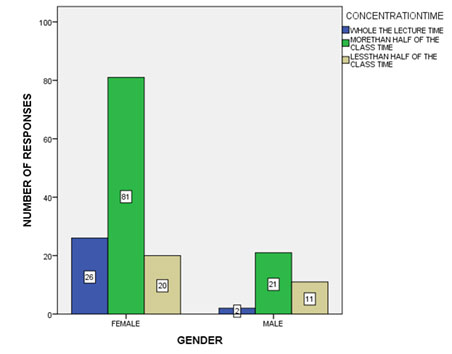
In our study we compared the results among the male and female students and we found that a majority (40.6%) of the female students agreed that they spend less than 3 hours for their recreation time than male students(p<0.05) (figure 19), majority (49.37%) of the female students felt that preparing timetable for studying will therefore improve their quality time than male students and the p value obtained was <0.05 (figure 20). Majority (36.8%) of the female students spent more than 1 hour for their studies on a regular basis than male students with a p value of <0.05 (figure 21) and incidentally we found that majority (50.6%) of the female students were able to concentrate for more than half the lecture time than male students(figure 22) .
A logical reality demonstrates that a human cerebrum can focus for just 17 minutes in one go. Sitting before a PC or keeping the books open, while the brain is in a through and through various world, would have neither rhyme nor reason. At the point when surge starts with one undertaking then onto the next without taking any breaks, it is hard to value one’s endeavours of sitting constantly in the work area. Lively walks, accomplishing something in between these times5 can be a useful distraction. Taking breaks while considering is worthy yet transforming examination time into unwinding time that won’t be acknowledged. Envision how much time is spent to squander in the event of 4 hours on TV or Internet. Numerous examinations have demonstrated that there is an ideal condition between a sound way of life and work efficiency. Getting enough rest, practicing and eating good food helps vitality level and permits us to concentrate all the more without any problem. Innovation is acceptable. Utilization of a schedule application or schedule journal consistently can make a difference where it tracks the time and marks the important assignments assigned. It is a productive instrument for time management.
CONCLUSION
From this survey, it can be concluded that female students spend more time studying their daily portions than the male students. Time management has been a long time discussion topic and is still being discussed as new improvisation in the methods of learning have constituted too many solutions to help students overcome their exam stress and fear. This study gives a better understanding and knowledge about time management among various college students pursuing different courses. More papers can be submitted in order to help students overcome their exam fear and stress and also show light on how to manage time effectively during virtual classes. There are certain limitations as to the equal proportion of participants from different courses.
ACKNOWLEDGEMENTS
We thank the participants who gave full support to conduct the study without any delay.
Conflict in Interests: Authors declare no conflict of interest.
REFERENCES
Acharya, S. (2003) Factors affecting stress among Indian dental students, Journal of dental education, 67(10), pp. 1140–1148.
Armbruster, B. B., Anderson, T. H. and Meyer, J. L. (1991) Improving Content-Area Reading Using Instructional Graphics, Reading Research Quarterly, p. 393. doi: 10.2307/747895.
Brown, A. L. and Day, J. D. (1983) Macrorules for summarizing texts: the development of expertise, Journal of Verbal Learning and Verbal Behavior, pp. 1–14. doi: 10.1016/s0022-5371(83)80002-4.
Burke, J. (2002) Tools for Thought: Graphic Organizers for Your Classroom. Heinemann Educational Books.
C., C. B. J. (2007) A review of the time management literature, Personnel Review. Emerald Group Publishing Limited, 36(2), pp. 255–276.
David Pearson, P. (2016) Handbook of Reading Research. Routledge.
Deshler, D. D. (2001) Ensuring Content-Area Learning by Secondary Students with Learning Disabilities, Learning Disabilities Research and Practice, pp. 96–108. doi: 10.1111/0938-8982.00011.
Entwistle, N. and Ramsden, P. (2015) Understanding Student Learning (Routledge Revivals). doi: 10.4324/9781315718637.
Falchikov, N. and Goldfinch, J. (2000) Student Peer Assessment in Higher Education: A Meta-Analysis Comparing Peer and Teacher Marks, Review of educational research. American Educational Research Association, 70(3), pp. 287–322.
Hembree, R. (1988) Correlates, Causes, Effects, and Treatment of Test Anxiety, Review of Educational Research, pp. 47–77. doi: 10.3102/00346543058001047.
Indrieş, M. and Bochiş, L. (2019) Sport anxiety, test anxiety and academic performance of primary school pupils: a correlational study, Health, Sports & Rehabilitation Medicine, pp. 165–169. doi: 10.26659/pm3.2019.20.4.165.
Jackson, E. L., Crawford, D. W. and Godbey, G. (1993) Negotiation of leisure constraints, Leisure Sciences, pp. 1–11. doi: 10.1080/01490409309513182.
Kirschenbaum, D. S. and Perri, M. G. (1982) Improving academic competence in adults: A review of recent research, Journal of Counseling Psychology, pp. 76–94. doi: 10.1037/0022-0167.29.1.76.
Kleijn, W. C., van der Ploeg, H. M. and Topman, R. M. (1994) Cognition, Study Habits, Test Anxiety, and Academic Performance, Psychological Reports, pp. 1219–1226. doi: 10.2466/pr0.1994.75.3.1219.
Lapp, D. (2011) Handbook of Research on Teaching the English Language Arts. doi: 10.4324/9780203839713.
Lay, C. and Silverman, S. (1996) Trait procrastination, anxiety, and dilatory behavior, Personality and Individual Differences, pp. 61–67. doi: 10.1016/0191-8869(96)00038-4.
Macan, T. H. (1990) College students’ time management: Correlations with academic performance and stress, Journal of Educational Psychology, pp. 760–768. doi: 10.1037/0022-0663.82.4.760.
Mchargue, M. (1977) Review of Student success: How to be a better student and still have time for your friends, Contemporary Psychology: A Journal of Reviews, pp. 341–341. doi: 10.1037/015939.
Middendorf, C. H. and Macan, T. H. (2002) Note-taking in the employment interview: effects on recall and judgments, The Journal of applied psychology, 87(2), pp. 293–303.
Misra, R. and Castillo, L. G. (2004) Academic Stress Among College Students: Comparison of American and International Students, International Journal of Stress Management, pp. 132–148. doi: 10.1037/1072-5245.11.2.132.
Ogle, D. M. (1986) K-W-L: A Teaching Model That Develops Active Reading of Expository Text, The Reading Teacher, pp. 564–570. doi: 10.1598/rt.39.6.11.
Powell, D. H. (2004) Behavioral treatment of debilitating test anxiety among medical students, Journal of Clinical Psychology, pp. 853–865. doi: 10.1002/jclp.20043.
Sandhu, A. H. (2009) Reality of’Divide and Rule’in British India, Pakistan Journal of History & Culture, 30(1). Available at: https://www.researchgate.net/profile/Akhtar_Sandhu/publication/273592633_Reality_of_’Divide_and_Rule’_in_British_India/links/5506a8d50cf2d60c0e6d3d62/Reality-of-Divide-and-Rule-in-British-India.pdf.
Sarason, I. G. (1980) Test Anxiety: Theory, Research, and Applications. Lawrence Erlbaum Assoc Incorporated.
Sarason, I. G. and Sarason, B. R. (1990) Test Anxiety, Handbook of Social and Evaluation Anxiety, pp. 475–495. doi: 10.1007/978-1-4899-2504-6_16.
Seipp, B. (1991) Anxiety and academic performance: A meta-analysis of findings, Anxiety Research, pp. 27–41. doi: 10.1080/08917779108248762.
Thomas L. Goodale and Peter A. (1980) Recreation and Leisure: Issues in an Era of Change. Witt. Venture Publishing, Inc., Journal of Travel Research, pp. 25–25. doi: 10.1177/004728758001900241.
Wiles, M. G., Wayne G. (1968) The Reality of Christianity: A Study of Adolf Harnack as Historian and Theologian. Harper and Row, Pp. xvii 359, doi: 10.1017/s0034412500003504.
Zeidner, M. (2006) Test Anxiety: The State of the Art. Springer Science and Business Media.
Zhang, D. (2004) Can e-learning replace classroom learning? Communications of the ACM, pp. 75–79. doi: 10.1145/986213.986216.

