Forecasting the ef ciency of staff based on
Information Technology
Mahmoud Ekrami
1
and Munira Barnasun
2
1
Associate Professor of Payam Noor University, Iran
2
MA student of Payam Noor University, Iran
ABSTRACT
The present study has been conducted with the aim of the relationship between ef ciency and IT. The statistical
population included all the principals, teachers, and administrative staff of Ministry of Education in Districts 3, 5, 9
and 18 in Tehran as more than 1800 people. Among these, 160 were selected as the sample. The assessment tool in
this study is the researcher-made questionnaire in which 26 multiple chose-items are used for the assessment of IT
and 27 multiple choice-items for the ef ciency. The ndings indicate that the level of information technology and
ef ciency, in their overall sense, are at a high level in the community. Social networks and electronic communication
components are respectively in the rst and last ranks. In addition, Career Mastery and ef ciency are respectively
in the rst and last ranks. Generally, Information Technology has no signi cant relationship with any of personal
traits. Moreover, the overall ef ciency is related to gender, place of work, age and service experience. Fundamental
correlation was used with the aim of explaining the set of ef ciency variables based on IT variables and personal
characteristics (age, service experience). Therefore, in this study a model is introduced based on the optimized model
of ef ciency of the fourfold contingency model based on the information technology factors.
KEY WORDS: INFORMATION TECHNOLOGY, EFFICIENCY, EDUCATION, IT FACTOR ANALYSIS, EFFICIENCY FACTOR ANALYSIS
222
ARTICLE INFORMATION:
*Corresponding Author: abbas_yaz@miau.ac.ir
Received 30
th
Dec, 2016
Accepted after revision 29
th
March, 2017
BBRC Print ISSN: 0974-6455
Online ISSN: 2321-4007
Thomson Reuters ISI ESC and Crossref Indexed Journal
NAAS Journal Score 2017: 4.31 Cosmos IF : 4.006
© A Society of Science and Nature Publication, 2017. All rights
reserved.
Online Contents Available at: http//www.bbrc.in/
Biosci. Biotech. Res. Comm. Special Issue No 1:222-233 (2017)
INTRODUCTION
Ef ciency is a fundamental and important measure in
Economy and is accepted as a criterion for determining
the wealth of a country. And it is an important deter-
mining factor for living standard. In addition, the ef -
ciency of countries is as an indicator for their devel-
opment and backwardness. In the era of globalization,
high national ef ciency is the necessary condition for
active role and it is achieved by producing more output
with constant or less inputs. According to Tof er (2010)
and Cohen (2013) and with the arrival of 21st century,
the emergence of new economic is evident and a para-
digm transfer takes place in each rotation and the new

Ekrami and Barnasun
BIOSCIENCE BIOTECHNOLOGY RESEARCH COMMUNICATIONS FORECASTING THE EFFICIENCY OF STAFF BASED ON INFORMATION TECHNOLOGY 223
paradigm brings with itself new theory, economics, life-
style and especial technology.
Obviously, we must follow new theories and architec-
ture in the organizational areas. Peter Drucker pointed
out that in the twentieth century, conscious activity in
the eld of increasing staff ef ciency could increase ef -
ciency by fty times. He believes the same task in the
twenty- rst century should be based on knowledge chores
and educated staff (worker knowledge). Educated employ-
ees are those who work with technology and in particular
the information technology. In recent years, organizations
have done the most investment on IT so that according to
some estimates, over 30% of total new investments have
been on information technology from 1987 to 2015.
In 2004, 484 billion dollars, equivalent to 40% of the
total investments of enterprises in America, was dedi-
cated to information processing equipment and software.
Methods of information technology have changed in
line with heavy investments in organizations. Personal
computers do things much faster than the old Maine
frames. These computers are programmed in organiza-
tions and allow their users to share thoughts, programs,
les and electronic messages. Internet and doing things
have provided an environment that the remote change
of information in organizations goes beyond organiza-
tions and geographical boundaries.
Providing a clear picture of the relationship between
ef ciency and the searching ways to maximize the ef -
ciency as the one of the priorities of organization invest-
ments on IT is been organized in developing countries.
According to a recent survey conducted by McKinsey
at the international level, 71 percent of senior execu-
tives believe that technological innovation has a positive
impact on rms’ pro tability. As one of the aspects of the
organization, they argue that the development of infor-
mation technology can improve individual and organiza-
tional performance, especially in information processing.
According to Faramarzi (2015, p. 3), information tech-
nology directly affects on the time barrier and spread of
information meaning that it leaves more time for devel-
opment by reducing the time required to perform normal
processes, and avoids duplication by providing a platform
for information spread.In recent years, the rapid growth of
information and communication technologies has had an
important in uence on human life and the performance
of organizations and institutions in different countries.
According to experts, Lorin and Erick (as cited in
Sohrabi et al., 2016), as the invention of the steam engine
and the Industrial Revolution caused a shift in work and
personal life of people, communications revolution has
similarly caused changes in life of man. According to
Chang and Cheung (as cited in Rezai, 2009), acceptance
is a multidimensional phenomenon which includes a
wide range of key variables some of them including per-
ceptions, beliefs, attitudes, characteristics and extent of
engagement with the IT. According to Dillon and Morris
(1996), quoted by Farahbod et al. (2013), user accept-
ance is de ned as a “demonstrable willingness among
a group to use information and communication tech-
nology to perform functions that these technologies are
designed to support”.
According to Cheung Kong (2008), studying the
literature with the development texts of the informa-
tion technology curriculum in recent decades in Hong
Kong indicates that the objective of curriculum in Hong
Kong is the change from computer studies to create and
develop the knowledge related to the information pro-
cessing approaches. According to Sun and Zhang (2006),
information and communication technologies have been
introduced as the dominant technology in the new mil-
lennium. These technologies are as means to increase
ef ciency and growth in all areas of human activity
with the increase of information communication process
and reduction of transaction costs. In the past two dec-
ades, different theories and models are proposed, tested,
modi ed and extended in the eld of technology accept-
ance and the source of most of these models is from
information, psychology and sociology systems. These
models contribute to our understanding of the factors
in uencing the acceptance of technology by users and
the relationships between them. Then, these models are
examined in detail.
According to Lee and Kim (2009), Technology Accept-
ance Mode by Davis et al can be noted as one of the
most widely used models in the eld among different
models that information technology researchers have
used to explain or predict motivational factors used in
technology acceptance by users. The model is based on
the idea that the perception of individuals of technology
affects their attitudes toward technology. This model
suggests that the use of ICT is determined by the desire
to behavior (desire to use) and this behavioral intention
is determined by two beliefs:
1. The mental perception of usefulness: the extent
to which a person believes that using a particular
technology will improve his performance.
2. The mental perception of the ease of use: the ex-
tent to which a person believes that using tech-
nology will be easy for him (Yi, Jackson, Park and
Probst (2006, p. 357), Walter and López (2008, p.
207)).
The use of ICT by the user in the model is the result of
the function a four-step process that includes:
- Exogenous variables will affect users’ ideas for
using information and communication technolo-
gies.

Ekrami and Barnasun
224 FORECASTING THE EFFICIENCY OF STAFF BASED ON INFORMATION TECHNOLOGY BIOSCIENCE BIOTECHNOLOGY RESEARCH COMMUNICATIONS
- Users’ opinions will affect their attitude in using
information and communication technology.
- Users’ attitude will affect their willingness to
use ICT.
- The willingness of users determines their level
of use of ICT (Burton-Jones and Hubona, 2006).
According to Hong, Thong and Tam (2006), technol-
ogy acceptance model is based on the willingness to take
that technology is a good predictor. Also, it can be used
to predict user behavior before using information and
communication technologies. Kuo and Yen (2009) states
that willingness to accept is as mental probability of a
person of doing a particular behavior which is an impor-
tant factor in its actual behavior.
According to Oliveira (2002), during the 1970s, fac-
tory ef ciency went up to 90-85 percents, while the
performance of of ce work only increased 4 percent.
Therefore, there was a need for systems to increase both
the ef ciency of factories and of ces. Hence, of ce
automation systems came into existence after the evolu-
tion of data processing systems, management informa-
tion systems and supportive decision-making systems.
These systems support administration of ces through
IT and increase their ef cacy. The increased ef ciency
caused by the completion of information transfer and
the speed and accuracy of information are between and
within of ces and can ultimately bene t the manager
by presenting better information for decision making.
The presence of information technology in organiza-
tions has improved ef ciency and decision-making.
Today, 50% of the capital budget costs in manufacturing
organizations are spent on information technology and
nearly 40 percent of the costs of re-engineering of the
organizations in 1977 have been spent on information
systems. Although we assume the investment on infor-
mation technology coordinates organizational changes
to enhance communication, the researches showing the
role of information technology in such a role meticu-
lously are few.
According to Matthew (2001), according to the neces-
sity of the use of information technology and its devel-
opment, it seems that there is a need to increase profes-
sional staff and the automation of tasks. Therefore, it is
necessary for organizations to attract and retain expert
staff to survive in the competition and bene t massive
human resources systems in this regard. Organizations
need consulting services about the nancial justi cation
of the use of information technology to prove that their
rivals have gained more than the average percentage of
income using ICT.
Fletcher (2013), in a study entitled as the “Staff Man-
agement in Business, Human Capital Management axis”
states that if the role supportive human resources of the
workforce and the management is based on business
needs, using information technology will lead to improve
staff ef ciency.Sanjra and Gonjalez (2010) studied the
role of information and communications technology in
the improvement of the ef ciency of teachers in primary
and secondary schools and indicated that the expansion
of information technology in education is bene cial for
the teaching/learning process and the portion of IT is
high in the betterment of teaching/learning process in
schools and technology is considered as innovation.
There is a need not only for the modernization of the
technological devices but also for the change in the
teaching models as well as the role of teacher to reach
the highest level of information technology at a school.
In a study conducted by Darvish khezri and Rouhani-
fard (2014) in the Islamic Azad University of Gorgan as
“the relationship between the use of information tech-
nology by staff and their ef ciency in Islamic Azad Uni-
versity of Gorgan and its af liated centers” they found
that the ef ciency of human resource on each eight
components (motivation of human resources, innova-
tion and creativity, spirit of competitiveness, cost reduc-
tion of activities, improving quality, reducing time work,
job satisfaction and morale of the workforce) is different
due to the use of technologies. In other words, there is a
signi cant relationship between the use of information
technology and human resource ef ciency.
In a study conducted by Esfandiari Bayat (2013) in
the city of Shiraz as “the relationship between the use
of information technology by staff and organizational
commitment with organizational ef ciency”, he con-
cluded as follows: there is a relationship between the
organizational commitment and the use of information
technology by staff with ef ciency and this relationship
is positive and meaningful. In explaining, it can be said
that the staff would have more job satisfaction in case of
organizational commitment and the more the individual
have commitment to the organization, the more they
will be loyal to the objectives and values of the organi-
zation (emotional commitment) and there is a tendency
to more trying and endeavor for beyond responsibilities.
A study conducted by Hosseinpour and Karimi Jaafar
(2012) in the Markazi province entitled as “The Effect
of Information and Communication Technology (ICT)
on labor force ef ciency in manufacturing industries of
Markazi province”. The aim of carrying out of this study
was to investigate the effect of ICT indexes on labor
force ef ciency in industry of Markazi Province. Results
show that ICT studies are of factors affecting labor
force ef ciency in the economy. Generally, by consid-
ering theoretical foundations regarding production and
ef ciency, the industries with a four-digit code of ef -
ciency model are estimated using panel data method and
the coef cients of the used variables in the work force
Ekrami and Barnasun
BIOSCIENCE BIOTECHNOLOGY RESEARCH COMMUNICATIONS FORECASTING THE EFFICIENCY OF STAFF BASED ON INFORMATION TECHNOLOGY 225
ef ciency model con rm the used model. In this study,
four models are estimated among which the third model
was selected as the proper model of this study that fol-
lows the index of industrial enterprises that use the
Internet as an indicator of ICT. The results show that
information and communications technology has a pos-
itive effect on the ef ciency of work force. On the other
hand, human resource including the important, effective
and complementary changes is for accepting the role of
information technology on the ef ciency of work force
in Markazi province. Because whatever the workforce is
more educated, they have higher ability in the imple-
mentation and acceptance of new technologies. Capital
stock per capita has also a positive and signi cant effect
on the ef ciency of labor force.
In a study conducted by Shari , Mohammad Davoodi
and Islamiyah (2012) in Tehran entitled as “The relation-
ship between the use of information and communication
technologies with the performance of teachers in the
teaching-learning process”, the relationship between the
use of information and communications technologies
with the performance of teachers in the teaching-learn-
ing process was studied. The results indicated that there
is a signi cant relationship between the use of informa-
tion and communications technologies by teachers and
with their performance in the teaching-learning process
and 60.6 percent of the changes of the dependant varia-
ble of the research (performance of teachers) are de ned
by the use of practical software, the use of databases and
then the use of internet.
Also, there is no signi cant difference observed
between the comments of participants in both compo-
nents of the study (using information and communica-
tion technology and performance) in terms of teaching
experience.
Accordingly, the main objective of the research is to
study the effect of the use of ICT by the staff, principals
and teachers of the smart schools on their ef ciency.
RESEARCH METHODOLOGY
The research method in this study is descriptive and
correlation-based due to the subject and the data collec-
tion method and it is applied research since the objective
is to predict the criterion variables based on the pre-
dicting variables. The hypothesis presentation has not
been done in this research. Then, we have only provided
research questions:
First question: To what extent there is IT and each
of its components in the studied population?
Second question: To what extent is the ef ciency
of each of its components in the studied popula-
tion?
Third question: What is the ranking of IT compo-
nents?
Fourth question: What is the ranking of ef ciency
components?
Fifth question: Is there a relationship between IT
and each of its components with personal charac-
teristics of managers?
Sixth question: do ef ciency and its components
have a relationship with personal characteristics
of managers?
Seventh question: does IT have a relationship with
ef ciency?
The statistical population of the present study included
all principals, teachers and administrative staff in sec-
ondary smart schools for girls in Tehran in 2015 and
2016 academic years. The statistical population is esti-
mated as 1800 people. The sample size using Cochran
formula was determined as 160 people who were selected
by cluster multistage random sampling including princi-
pals, teachers and administrative staff.
RESULTS AND DISCUSSION
Cronbach’s alpha coef cient has been used in this study
to determine the reliability of the test. The alpha coef-
cient has been 0.8844 in the ef ciency questionnaire
and 0.8630 in IT questionnaire. Moreover, the primary
output indicates that correlation matrix determinant of
information technology is equal to 0.0000061 and oppo-
site to zero and KMO in the ef ciency questionnaire is
equal to 0.759 showing the adequacy of sampling this
study. In the study, the statistical value of Bartlett’s
spheral test is equal to 1780.0523 and its signi cance
level is equal to 0.000 and the implementation of factor
analysis and factor analysis is justi able and a set of 5
factors of information technology explain 62.2 percent
of the total variance of the information technology. In
the next step, it is determined that the especial values for
5 factors are bigger than 1 and therefore, the question-
naire has 7 factors.
The primary output indicates that correlation matrix
determinant of ef ciency is equal to 0.000434 and it
should be opposite to zero in order to nd the invert
correlation matrix and do the calculations. KMO in the
ef ciency questionnaire is equal to 0.755 showing the
adequacy of sampling this study. Bartlett’s spheral test
is used in order to investigate whether the correlation
matrix of the data is not zero. The purpose of this test is
to reject the null hypothesis (H0). Bartlett test examines
the hypothesis that the observed correlation matrix is
associated to a population with uncorrelated variables.
It is necessary for variables to be correlated with each
Ekrami and Barnasun
226 FORECASTING THE EFFICIENCY OF STAFF BASED ON INFORMATION TECHNOLOGY BIOSCIENCE BIOTECHNOLOGY RESEARCH COMMUNICATIONS
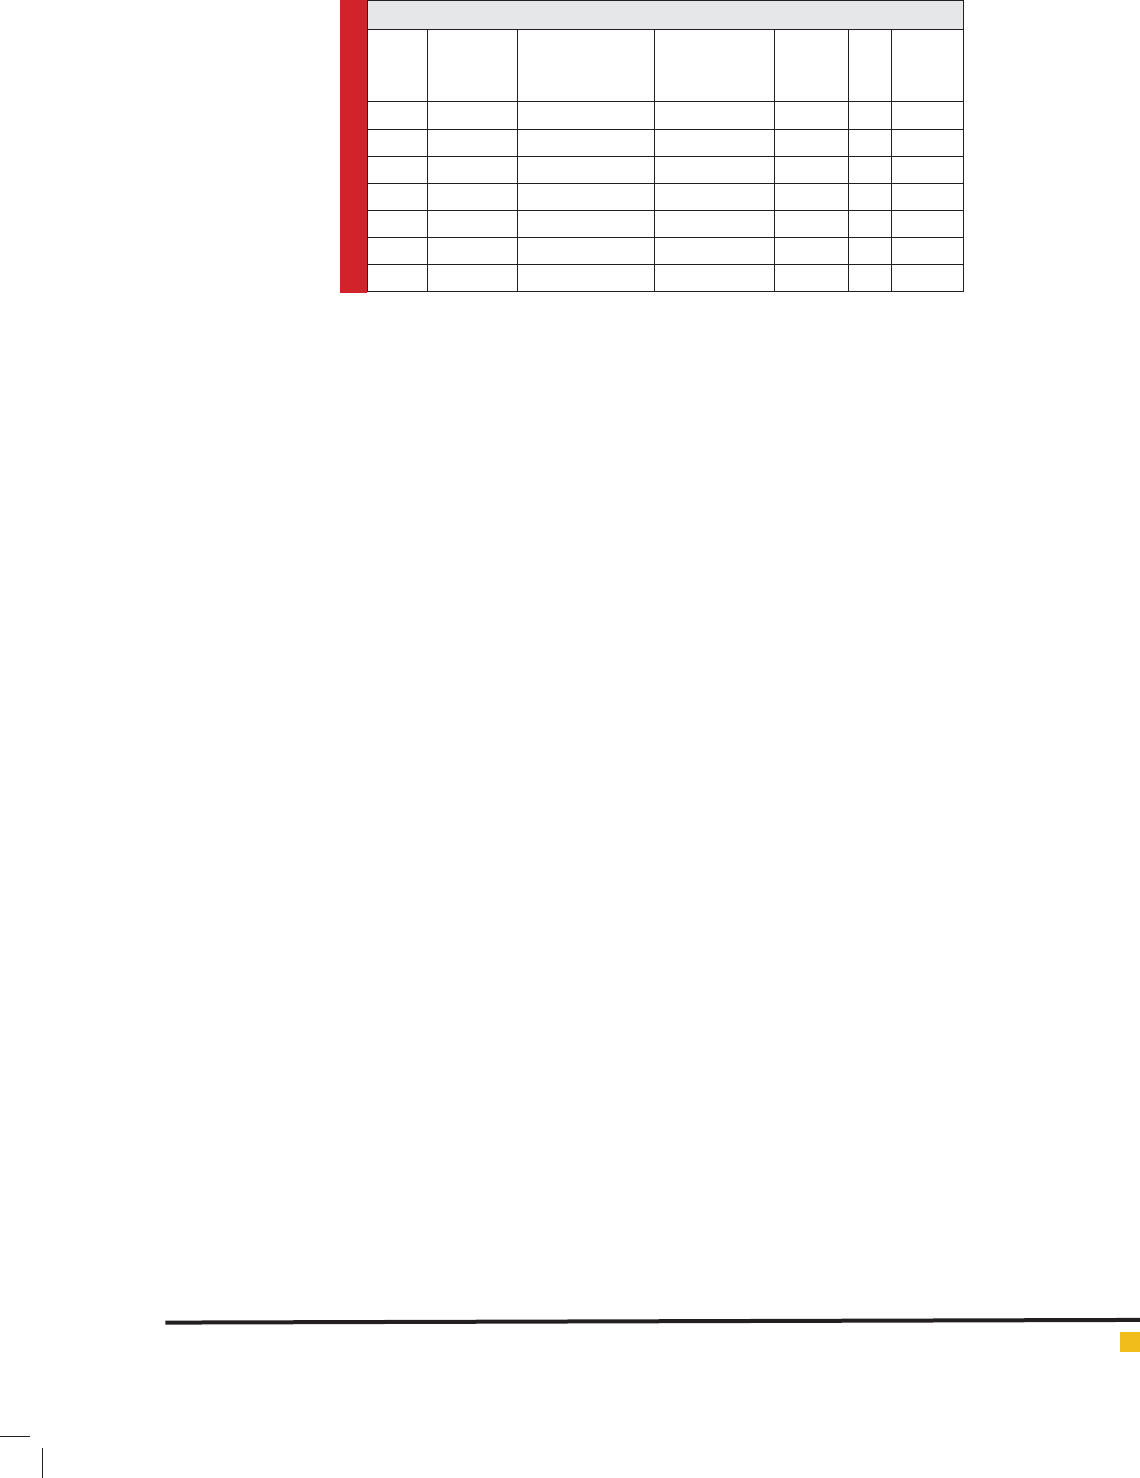
Table 1. Central and dispersion characteristics of information technology and ef ciency variables in the study sample
(n= 160)
Variable Symbol Mean Std.
deviation
Std.
error
skewness T
skewness
kurtosis T
kurtosis
Min Max damane
Electronic
empowerment
F1 3.086 0.562 0.044 -0.528 -2.73 -0.042
-0.110
1.57 4 2.43
Electronic
communication
F2 2.048 0.668 0.052 0.617 3.187 -0.296 0.766 1 3.8 2.6
Electronic
learning
F3 2.928 0.661 0.052 -0.200 -1.033 -0.264 0.684 1 4 3
Social network F4 0.151 0.686 0.054 -0.729 -3.768 -0.058 -0.150 1 4 3
Electronic job F5 2.15 0.549 0.043 0.475 2.454 0.272 0.703 1 3.8 2.8
Information
technology
Ftot 2.686 0.438 0.034 -0.206 -1.066 0.968 2.500 1.21 3.73 2.52
Monitoring and
reaction
B1 2.996 0.740 0.058 -0.907 -4.684 1.084 2.799 1 4 3
Organizational
support
B2 2.889 0.645 0.051 -1.032 -5.331 2.170 5.603 1 4 3
Cooperation and
implementation
B3 2.922 0.661 0.052 -0.924 -4.772 1.561 4.031 1 4 3
Competitiveness B4 3.007 0.700 0.055 -0.773 -3.994 1.221 3.153 1 4 3
Practicality B5 2.973 0.570 0.045 -0.987 -5.101 3.383 8.736 1 4 3
Performance B6 2.797 0.739 0.058 -0.344 -1.779 0.134 0.347 1 4 3
Career Mastery B7 3.287 0.567 0.044 -1.668 -8.615 6.031 15.572 1 4 3
Ef ciency Btot 2.983 0.483 0.038 -1.642 -8.479 7.826 20.207 1.41 3.81 2.4
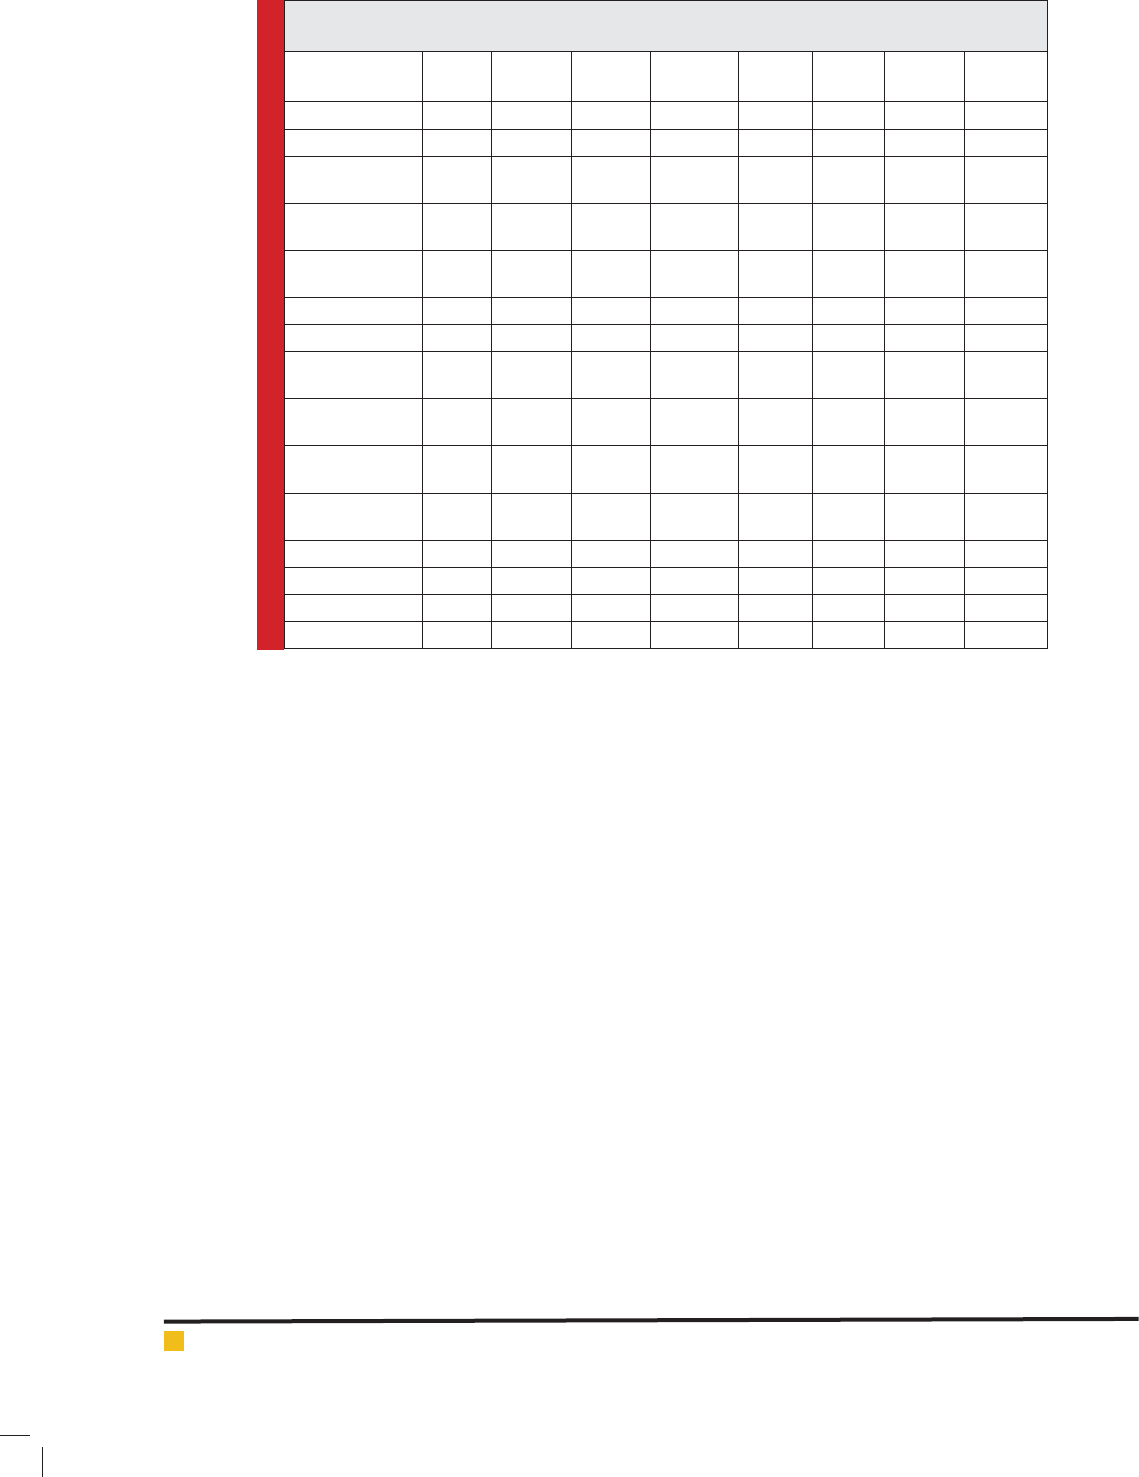
Table 2. The results of one-sample t model to determine the level of information technology and
ef ciency in the studied population
Variable Symbol Mean Std. deviation T value Ho The variables level
in population
Electronic
empowerment
F1 3.086 0.562 13.1 rejected Very high
Electronic
communication
F2 2.048 0.668 -8.5 rejected Very low
Electronic
learning
F3 2.928 0.661 8.1 rejected High
Social network F4 0.151 0.686 12.01 rejected Very high
Electronic job F5 2.15 0.549 -8.05 rejected Very low
Information
technology
Ftot 2.686 0.438 5.3 rejected High
Monitoring and
reaction
B1 2.996 0.740 8.47 rejected High
Organizational
support
B2 2.889 0.645 7.6 rejected High
Cooperation
and
implementation
B3 2.922 0.661 8.06 rejected High
Competitiveness B4 3.007 0.700 9.12 rejected Very high
Practicality B5 2.973 0.570 10.5 rejected Very high
Performance B6 2.797 0.739 5.09 rejected High
Career Mastery B7 3.287 0.567 17.5 rejected Very high
Ef ciency Btot 2.983 0.483 12.6 rejected Very high
Ekrami and Barnasun
BIOSCIENCE BIOTECHNOLOGY RESEARCH COMMUNICATIONS FORECASTING THE EFFICIENCY OF STAFF BASED ON INFORMATION TECHNOLOGY 227
Table 3. Ranking of IT (F) and ef ciency (B) variables in the studied population
Variable Sym. Mean rank Rank Variable Sym. Mean rank Rank
Electronic
empowerment
F1 3.86 2 Social network F4 3.97 1
Electronic
communication
F2 1.64 5 Electronic job F5 2.01 4
Electronic learning F3 3.52 3
Signi cance
0.0000
d.f.
4
Chi-square
306.9438
Cases
160
Variable Sym. Mean rank Rank Variable Sym. Mean rank Rank
Monitoring and reaction B1 4.12 3 Practicality B5 3.79 4
Organizational support B2 3.53 6 Performance B6 3.37 7
Cooperation and
implementation
B3 3.77 5 Career Mastery B7 5.28 1
Competitiveness B4 4.13 2
Signi cance
0.0000
d.f.
6
Chi-square
81.4500
Cases
160
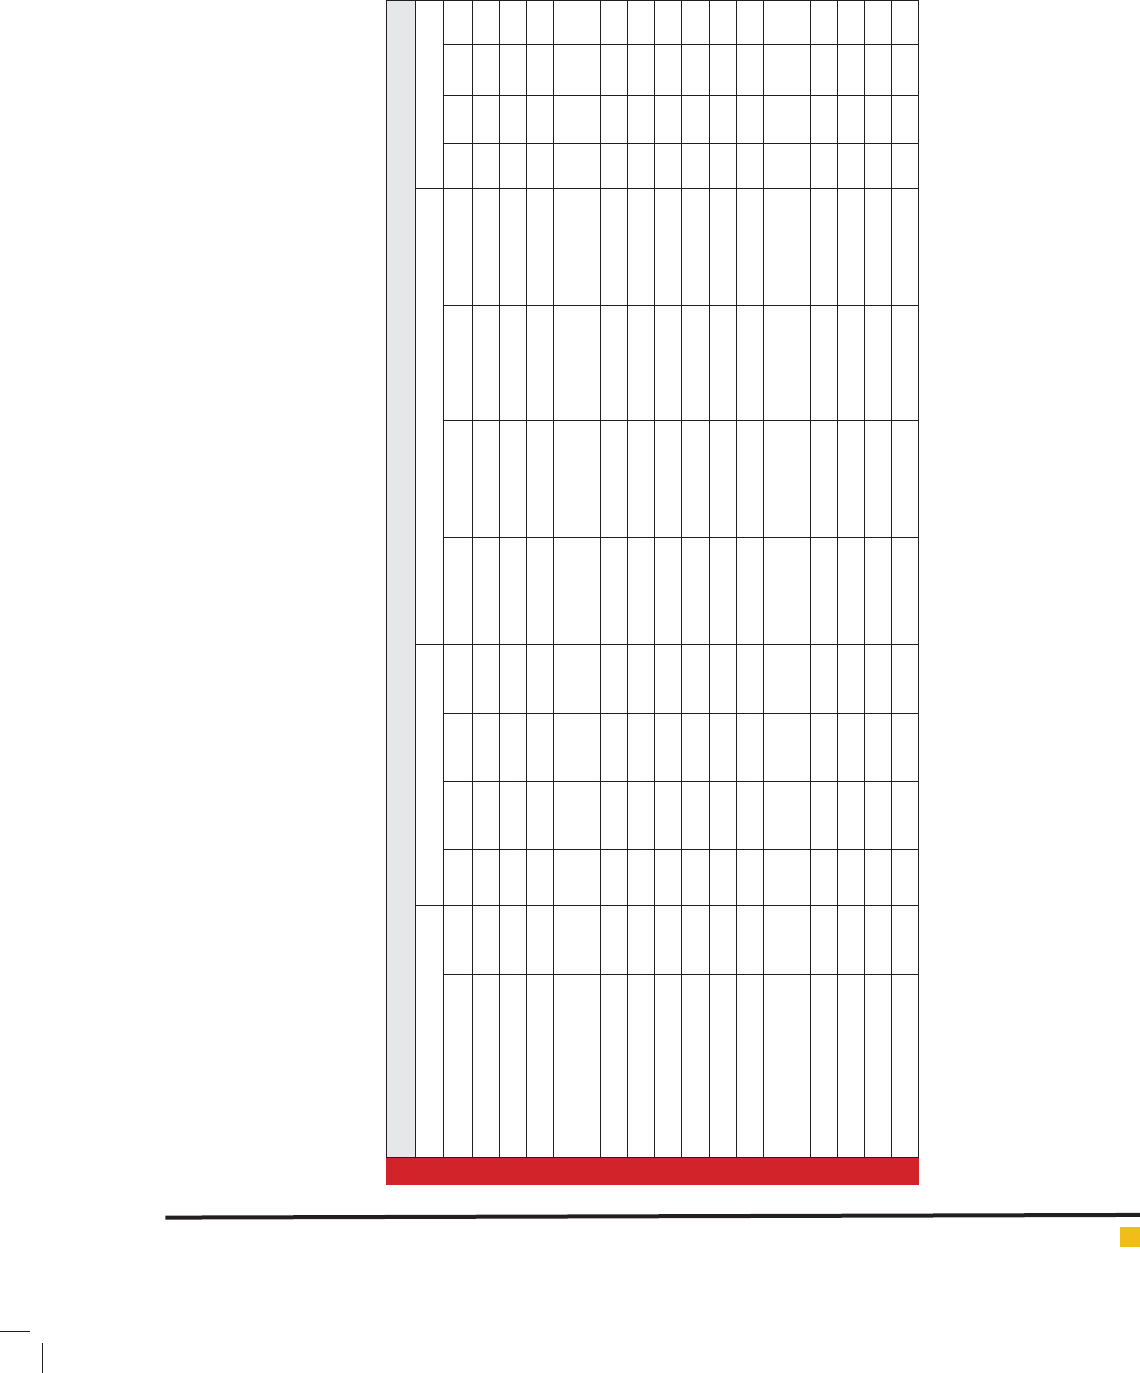
Table 4. Results implementing consistent chi-square model to determine the relationship between information
technology and individual characteristics of employees
Variable Sym. Gender Education Rank Service area Age Experience
Electronic
empowerment
F1 X
2
= 0.96
=0.8
no
relationship
X
2
= 10.44
=0.01
It has a
relationship
X
2
= 0.19
=0.97
no
relationship
X
2
= 19.21
=0.02
It has a
relationship
X
2
= 14.48
=0.10
no
relationship
X
2
= 13.57
=0.13
no
relationship
Electronic
communication
F2 X
2
= 2.12
=0.54
no
relationship
X
2
= 1.28
=0.73
no
relationship
X
2
= 2.88
=0.41
no
relationship
X
2
= 6.33
=0.70
no
relationship
X
2
= 10.8
=0.28
no
relationship
X
2
= 1.50
=0.99
no
relationship
Electronic learning F3 X
2
= 0.75
=0.86
no
relationship
X
2
= 5.22
=0.15
no
relationship
X
2
= 2.53
=0.46
no
relationship
X
2
= 9.54
=0.38
no
relationship
X
2
= 14.82
=0.09
no
relationship
X
2
= 14.7
=0.09
no
relationship
Social network F4 X
2
= 3.57
=0.31
no
relationship
X
2
= 1.12
=0.77
no relationship
X
2
= 4.48
=0.21
no
relationship
X
2
= 6.62
=0.67
no
relationship
X
2
= 14.64
=0.10
no
relationship
X
2
= 5.76
=0.76
no
relationship
Electronic job F5 X
2
= 2.42
=0.48
no
relationship
X
2
= 5.43
=0.14
no
relationship
X
2
= 13.41
=0.003
It has a
relationship
X
2
= 22.77
=0.006
It has a
relationship
X
2
= 25.04
=0.002
It has a
relationship
X
2
= 18.68
=0.02
It has a
relationship
Information
technology
Ftot X
2
= 0.94
=0.81
no
relationship
X
2
= 4.57
=0.20
no
relationship
X
2
= 1.82
=0.61
no
relationship
X
2
= 9.39
=0.40
no
relationship
X
2
= 9.36
=0.40
no
relationship
X
2
= 7.35
=0.60
no
relationship
other; otherwise, there is no reason to explain the fac-
tor model. In this study, the statistical value of Bartlett’s
spheral test is equal to 1501.6582 and its signi cance
level is less than 0.000.
Therefore, the implementation of factor analysis and
factor analysis is justi able in addition to the adequacy
of sampling and a set of 5 factors of ef ciency explain
52.8 percent of the total variance of the ef ciency. The
construct validity shows that the ef ciency is able to
determine 52.8 percent of the total variance of the ef -
ciency. In the next step, it is determined that the especial
values for 7 factors are bigger than 1 and therefore, the
questionnaire has 7 factors.
Central and dispersion characteristics of IT and ef -
ciency variables are determined and shown in Table 1.
In response to the rst and second question of the research,

Ekrami and Barnasun
228 FORECASTING THE EFFICIENCY OF STAFF BASED ON INFORMATION TECHNOLOGY BIOSCIENCE BIOTECHNOLOGY RESEARCH COMMUNICATIONS
Table 5. The results of the implementation of the chi-square consistent model to determine the relationship between
ef ciency and personal characteristics of employees
Variable Sym. Gender Education Rank Service area Age Experience
Monitoring and
reaction
B1 X
2
= 3.39
=0.33
no
relationship
X
2
= 1.45
=0.69
no
relationship
X
2
= 0.46
=0.92
no
relationship
X
2
= 19.95
=0.01
It has a
relationship
X
2
= 22.58
=0.007
It has a
relationship
X
2
= 20.03
=0.01
It has a
relationship
Organizational
support
B2 X
2
= 4.91
=0.17
no
relationship
X
2
= 2.65
=0.44
no
relationship
X
2
= 3.50
=0.32
no
relationship
X
2
= 13.82
=0.12
no
relationship
X
2
= 23.69
=0.004
It has a
relationship
X
2
= 8.01
=0.53
no
relationship
Cooperation and
implementation
B3 X
2
= 2.86
=0.41
no
relationship
X
2
= 4.96
=0.17
no
relationship
X
2
= 3.02
=0.38
no
relationship
X
2
= 8.20
=0.51
no
relationship
X
2
= 22.84
=0.006
It has a
relationship
X
2
= 33.42
=0.0001
It has a
relationship
Competitiveness B4 X
2
= 2.45
=0.48
no
relationship
X
2
= 4.65
=0.19
no
relationship
X
2
= 6.44
=0.09
no
relationship
X
2
= 23.87
=0.004
It has a
relationship
X
2
= 32.60
=0.0001
It has a
relationship
X
2
= 36.44
=0.0003
It has a
relationship
Practicality B5 X
2
= 2.56
=0.46
no
relationship
X
2
= 29.36
=0.0001
It has a
relationship
X
2
= 1.14
=0.76
no
relationship
X
2
= 14.24
=0.11
no
relationship
X
2
= 9.94
=0.35
no
relationship
X
2
= 6.68
=0.66
no
relationship
Performance B6 X
2
= 6.53
=0.08
no
relationship
X
2
= 3.74
=0.29
no
relationship
X
2
= 3.72
=0.29
no
relationship
X
2
= 18.37
=0.03
It has a
relationship
X
2
= 30.49
=0.0003
It has a
relationship
X
2
= 27.02
=0.001
It has a
relationship
Career Mastery B7 X
2
= 3.89
=0.27
no
relationship
X
2
= 3.37
=0.33
no
relationship
X
2
= 9.54
=0.02
It has a
relationship
X
2
= 17.05
=0.04
It has a
relationship
X
2
= 7.25
=0.61
no
relationship
X
2
= 9.22
=0.41
no
relationship
Ef ciency Btot X
2
= 8.25
=0.04
It has a
relationship
X
2
= 2.76
=0.42
no
relationship
X
2
= 3.15
=0.36
no
relationship
X
2
= 22.63
=0.007
It has a
relationship
X
2
= 26.63
=0.001
It has a
relationship
X
2
= 20.09
=0.01
It has a
relationship
the one-sample t model is been used and as table 2 shows,
the ef ciency components are higher than medium in the
population in which the sample is extracted.
To answer the third and the fourth questions of study,
Friedman’s model is used and the results are shown in
Table 3. As it is determined in table 3, in the studied
population from the variables of information technol-
ogy, social network (F4) is placed in the rst rank, elec-
tronic empowerment (F1) in the second rank, electronic
learning (F3) in the third rank, electronic job (F5) in the
fourth rank and electronic communication (F4) in the
last rank. Among ef ciency variables, Career Mastery is
placed at the rst rank (b7), Competitiveness (B4) in the
second rank, monitoring and reaction (B1) in the third
rank, practicality (B5) in the fourth rank and coopera-
tion and implementation (B3) in the fth rank, organi-
zational support (B2) in the sixth rank and Performance
(B6) in the last rank.
According to Tables 4 and 5, a non-parametric model
is used to answer fth and sixth research questions.
Table 4 shows the results of the implementation of Chi
square consistent model to determine the relationship
between information technologies with personal charac-
teristics of employees.
The results in Table 4 show that electronic empow-
erment variable has a relationship with education at
=0.01 lower than the Pearson (0.05) level. Moreover,
electronic empowerment variable has also a relationship
with service area at =0.02 lower than the Pearson (0.05)
level. In the studied population, electronic job variable
has a relationship with rank at =0.003 lower than the
Pearson (0.05) level. Also, electronic job variable has a
relationship with service area at =0.006 lower than the
Pearson (0.05) level as well as age at =0.002 lower than
the Pearson (0.05) level and with experience at =0.02
lower than the Pearson (0.05) level.
In Table 5, the results of the implementation of Chi
square consistent model are presented to determine the
relationship between ef ciency and personal character-
istics of employees.
Ekrami and Barnasun
BIOSCIENCE BIOTECHNOLOGY RESEARCH COMMUNICATIONS FORECASTING THE EFFICIENCY OF STAFF BASED ON INFORMATION TECHNOLOGY 229
Results of Table 5: Monitoring and reaction variable
has a relationship with service area at =0.01 lower than
the Pearson (0.05) level. Monitoring and reaction varia-
ble has a relationship with age at =0.007 lower than the
Pearson (0.05) level and experience at =0.01 lower than
the Pearson (0.05) level. Organizational support variable
has a relationship with age at =0.004 lower than the
Pearson (0.05) level. Cooperation and implementation
variable has a relationship with age at =0.006 lower
than the Pearson (0.05) level and with experience at
=0.0001 lower than the Pearson (0.05) level. Competi-
tiveness variable has a relationship with service area at
=0.004 lower than the Pearson (0.05) level, with age at
=0.0001 lower than the Pearson (0.05) level and with
experience at =0.0003 lower than the Pearson (0.05)
level. Practicality variable has a relationship with edu-
cation at =0.0001 lower than the Pearson (0.05) level.
Performance variable has a relationship with service
area at =0.03 lower than the Pearson (0.05) level and
with age at =0.003 lower than the Pearson (0.05) level
and with experience at =0.001 lower than the Pearson
(0.05) level.
Career Mastery variable has a relationship with rank
at =0.02 lower than the Pearson (0.05) level and with
service area at =0.04 lower than the Pearson (0.05)
level. It has a relationship with gender variable at =0.04
lower than the Pearson (0.05) level and with service area
at =0.007 lower than the Pearson (0.05) level and with
age at =0.001 lower than the Pearson (0.05) level and
with experience at =0.01 lower than the Pearson (0.05)
level.
Fundamental correlation model is used to answer
the last question (does IT have a relationship with ef -
ciency?). A summary of the fundamental correlation
analysis is shown in Table 4-11.
As it can be seen in table 6, the corresponding F value
with 1= 0.7870 is equal to 5.35 which is signi cant for
the 7*7=49 of degree of freedom at a lower level than
0.0001. F value with 2= 0.5162 is equal to 4.35 which
is signi cant for the (7-1) (7-1) =36 of degree of freedom
at a lower level than 0.0001. The corresponding F value
with 3= 0.3626 is equal to 3.40 which is signi cant for
the (6-1) (6-1) = 25 of degree of freedom at a lower level
than 0.0001. The F value with 4= 0.2012 is equal to
2.16 which is statistically signi cant for the (5-1) (5-1)
= 16 of degree of freedom at = 0.0057 but the cor-
responding F value is not signi cant for 5, 6 and 7.
Based on the summary of this table, tow matrixes of
the standardized coef cients are obtained of the funda-
mental variables (for each of the two sets that could be
analyzed there is only one matrix). These values give
exact information about the combination of correspond-
ing couples with fundamental variables of table six and
present them in table 7.
As Table 7 shows, the coef cients are the portion of
the main variables in the combination of fundamental
variables and they are usually only calculated for the
fundamental correlations couples statistically signi -
cant.
R
C12
means 0.440399 that indicates the variance ratio
of ZY1 that is explained or justi ed by the ZX1, which
means that about 44% of the ZY1 variance is explained
by ZX1. R
C22
means 0.340435 that is explained by ZX3
and R
C32
means 0.266112 indicates the variance ratio
of ZY3 that is explained by the ZX3, and R
C42
means
0.167484 indicates the variance ratio of ZY4 that is
explained by the ZX4. The relevant size of weights indi-
cates the importance of each variable in a collection in
comparison with the variables in another collection. The
relevant size of this weight is the base for the de nition
of fundamental variables and explaining it in addition
to being as its sign and each of them measures some-
thing. Structural vectors of the rst to fourth factors
along with the Wight are shown in table 8.
The left four columns of Table 8 gures show that
four appropriate models are extracted based on four
fundamental variables. Before introducing each model,
it is necessary to be reminded that the age variable has a
trivial and neutral effect on all four models. As experi-
ence (work) variable in the rst three models, electronic
Table 6. Consecutive Ratings signi cance test
Row special
value
fundamental
correlation
coef cient R
c
fundamental
correlation
square R
c
2
F value df Sig.
1 0.7870 0.663625 0.440399 5.35 49 <0.0001
2 0.5162 0.583468 0.340435 4.35 36 <0.0001
3 0.3626 0.515861 0.266112 3.40 25 <0.0001
4 0.2012 0.409249 0.167484 2.16 16 0.0057
5 0.0251 0.156482 0.024487 0.68 9 0.7292
6 0.0154 0.123181 0.015173 0.59 4 0.6715
7 0.0002 0.015094 0.000228 0.03 1 0.8526
Ekrami and Barnasun
230 FORECASTING THE EFFICIENCY OF STAFF BASED ON INFORMATION TECHNOLOGY BIOSCIENCE BIOTECHNOLOGY RESEARCH COMMUNICATIONS
Table 7. Standardized fundamental weighting coef cients between independent (var) and
dependent (with) variables
Independent
variable
Sym. V1 V2 V3 V4 V5 V6 V7
Age Age 0.4549 -0.2359 -0.4503 0.2980 -0.7287 1.4326 -0.1690
Experience work -0.2178 -0.3222 0.4356 -1.0912 0.8896 -1.0063 -0.1802
Software/
hardware
F1 0.5030 -0.9339 0.5786 0.2066 -0.1443 -0.1559 -0.0651
Electronic
communication
F2 0.0069 -0.0798 -0.5486 0.6534 0.8906 0.0652 0.0133
Electronic
learning
F3 0.6079 0.4364 -0.5407 -0.5495 -0.4148 -0.4690 -0.5325
Social networks F4 0.1164 0.6521 0.4125 0.0180 0.2103 0.5093 0.8665
Electronic Job F5 -0.2304 0.2635 0.7129 -0.0743 0.0080 0.2441 -0.7383
Dependent
variable
Sym. W1 W2 W3 W4 W5 W6 W7
Monitoring and
reaction
B1 -0.1405 -0.7090 0.1499 0.2291 0.9668 -0.1166 -0.5388
Organizational
support
B2 0.6339 0.2558 0.7322 -0.4638 -0.0237 -0.5446 -0.5108
Cooperation and
implementation
B3 0.0738 0.1796 -0.3438 0.9159 0.7325 -0.2865 -0.1894
Competitiveness B4 -0.3374 0.5449 0.5223 0.4021 0.0609 0.5961 -0.6032
Practicality B5 0.0757 0.6333 -0.7280 -0.0851 0.5992 -0.1802 0.1727
Performance B6 0.2579 -0.0772 -0.4441 -0.4162 -0.3022 0.9903 -0.3120
Career Mastery B7 0.4855 -0.5265 0.1273 0.1247 -0.1171 0.0348 0.8914
communication (F2) in the rst model, and social net-
works (F4) in the fourth model have a trivial or neutral
effect in the production or prediction of ef ciency.
The ef ciency of staff in an environment in which
using software/hardware (F1) is high (with the coef cient
of 8), the amount of electronic learning/teaching (F3) is
also very high (with the coef cient of 9), the relationship
with social networks (F4) is very low (with the coef cient
of 1) and in the opposite, electronic Job (F5) is relatively
high (with the coef cient of -4) is stated as follows: the
lack of monitoring and reaction (B1) is low (with the
coef cient of -1), each of the variables of organizational
support (B2), Cooperation and implementation (B3), and
Practicality (B5) id very low(with the coef cient of 1),
and in the opposite, Competitiveness (B4) is high(with the
coef cient of -5), Performance (B6) is relatively low(with
the coef cient of 3) and in the last, Career Mastery (B7)
is very high (with the coef cient of 9).
In the second model, if staff insist on not using soft-
ware/hardware (F1) (with the coef cient of 16), the lack
of electronic communication (F2) is low (with the coef-
cient of -1), Electronic learning (F3) is high (with the
coef cient of 6), the use of social networks ( F4) is very
high (with the coef cient of 9), and electronic Job (F5)
is relatively high (with the coef cient of 4), the ef -
ciency of employees in these conditions will be as such:
Lack of monitoring and reaction (B1) is low (with the
coef cient of -1), lack of monitoring and reaction (B1)
as well as inef ciency (B6) is low (with the coef cient of
-1), organizational support (B2) is relatively high (with
the coef cient of 4), cooperation and implementation
(B3) is relatively Low (with the coef cient of 2), com-
petitiveness (B4) and ef ciency (B5), with 8 and 12 coef-
cients respectively are very high, and in last lack of
career mastery (B7) is very large (with the coef cient of
-10) are anticipated.
The third model, if staff using software/hardware
(F1), the use of social networks (F4), and electronic Job
(F5) are very high with the coef cients of 10, 6, and 12
respectively, and on the other hand, the lack of elec-
tronic communication (F2) and lack of electronic learn-
ing (F3) are very high (each with the coef cient of -8),
the ef ciency of staff is evaluated as such: monitoring
and reaction (B1) and career mastery (B7) is relatively
low (each with the coef cient of 2), competitiveness (B4)
and organizational support (B2 ) and performance (B6)
are very high with coef cients of 2, 12, 7 and 6 respec-
tively, lack of cooperation and implementation (B3) is
relatively low (with the coef cient of -5), and lack of
practicality (B5) is very high (with the coef cient of -13).
Ekrami and Barnasun
BIOSCIENCE BIOTECHNOLOGY RESEARCH COMMUNICATIONS FORECASTING THE EFFICIENCY OF STAFF BASED ON INFORMATION TECHNOLOGY 231
Table 8. The coef cients of structural vectors of rst to fourth along with weight factor and their weight ratios
Fundamental structure Fundamental weights Weight ratios
Independent variable Sym. V1 V2 V3 V4 V1 V2 V3 V4 V1 V2 V3 V4
Age Ag 0.122 -0.333 -0.237 -0.5282 0.06813665 -0.035333655 -0.067455611 0.044634381 0 0 0 0
Experience wk 0.027 -0.320 -0.071 -0.7618 -0.032951 -0.048738691 0.0659021116 -0.165071606 0 0 0 -1
Software/hardware F1 0.758 -0.284 0.4508 0.3175 0.89340266 -1.658788126 1.0276806454 0.3669959192 8 -16 10 3
Electronic
communication
F2 0.433 0.0097 -0.182 0.3810 0.01024246 -0.119227962 -0.82008774 0.9767728632 0 -1 -8 9
Electronic learning F3 0.827 0.0428 -0.092 -0.0506 0.91953512 0.6601950525 -0.817876621 -0.831276451 9 6 -8 -8
Social networks F4 0.625 0.4235 0.3567 -0.1102 0.16951815 0.9501000821 0.6009807608 0.026235686 1 9 6 0
Electronic Job F5 0.044 0.3698 0.5139 0.1928 -0.419306 0.4795124326 1.297469579 -0.135199189 -4 4 12 -1
Dependent variable Sym. W1 W2 W3 W4 W1 W2 W3 W4 W1 W2 W3 W4
Monitoring and reaction B1 0.325 -0.245 0.1042 0.5403 -0.19988637 -0.008955643 0.2133758739 0.325996724 -1 -1 2 3
Organizational support B2 0.783 0.3418 0.4141 0.0678 1.048485066 0.4230755139 1.211132173 -0.76719553 1 4 12 -7
Cooperation and
implementation
B3 0.465 0.1364 -0.132 0.7984 0.118847150 0.2893474616 -0.553908318 1.475802677 1 2 -5 14
Competitiveness B4 0.134 0.4512 0.4659 0.4684 -0.51155043 0.8261035512 0.7918446722 0.609570296 -5 8 7 6
Practicality B5 0.506 0.4821 -0.443 0.1353 0.145517143 0.2170621732 -1.39901473 -0.16362494 1 12 -13 -1
Performance B6 0.588 0.0257 -0.159 0.0670 0.365309816 -0.10931526 -0.62901808 -0.58953443 3 -1 6 -5
Career Mastery B7 0.761 -0.313 -0.012 0.2154 0.955296870 -1.35979597 0.2504985474 0.250751441 9 -10 2 2

Ekrami and Barnasun
232 FORECASTING THE EFFICIENCY OF STAFF BASED ON INFORMATION TECHNOLOGY BIOSCIENCE BIOTECHNOLOGY RESEARCH COMMUNICATIONS
In the fourth model, ef ciency based IT variables is
formed as follows: If staff are with very few experience
(work) (with the coef cient of -1) in an environment
with very low Electronic Job (F5) (with the coef cient of
-1), using relatively high software/hardware (F1) (with
the coef cient of 3), very large electronic communica-
tion (F2) (with the coef cient of 9), and lack of very high
electronic learning (F3) (with the coef cient of -8), the
ef ciency is explained and justi ed as relatively high
monitoring and reaction (B1) (with the coef cient of 3),
very high lack of organizational support (B2 ) (with the
coef cient of -7), very high cooperation and implemen-
tation (B3) (with the coef cient of 14), relatively high
competitiveness (B4) (with the coef cient of 6), very low
practicality (B5) (with the coef cient of -1), lack of good
performance (B6) (with the coef cient of -5), and low
career mastery (B7) (with the coef cient of 2).
In general, ndings show that if the use of software/
hardware and electronic learning is at very high level,
the career mastery of staff will be also high. On the one
hand, the heavy use of social networks is followed by
the high ef ciency of staff and on the other hand, the
very much use of software/hardware and high electronic
job are followed by high organizational support and
high competitiveness. But they cause a great inef ciency
and at last, high electronic communication has caused
a huge increase in cooperation and implementation and
in turn, the reduction of organizational support and ef -
ciency. Thus, in this study, ef ciency is introduced as an
optimal model of a contingency model (four) in uenced
by information technology.
DISCUSSION AND CONCLUSION
Any society needs different organizations to realize its
own objectives, also the correction and betterment of
any organization is in line with the attention to the indi-
viduals in that society that is effective in ef ciency and
betterment of using organizational IT. In this regard, this
study seeks to study the relationship between ef ciency
and IT.
In the present study, the existence of relationship
between IT and ef ciency was con rmed and other
researches in line with this research such as: Darvish
Khezri and Rouhani Fard (2014) that in their study there
was a signi cant relationship between ef ciency of work
force and information technology. In the study of Esfan-
diari and Biat (2013), there is a relationship between
organizational commitment and the amount of use of
staff of the information technology with ef ciency and
this is a positive signi cant relationship. The results of
Hosseinpur and Karimi Jaafari (2012) showed that ICT
has a positive relationship with labor ef ciency. Bozorgi
(2012) has concluded that ICT and human resource ef -
ciency are related to each other. Imani, Shari and Vafa-
manesh (2011) concluded that there is a signi cant rela-
tionship between using IT and the ef ciency of human
resource. The following researches are in line with the
research results of the present study: Afsheh, Kianfar
and Ali Shaeidi (2011), Faryany and Tajvidi (2011), San-
jera and Gonjalez (2010) and Kim (2009). In the present
study, the convenience sample is being used, so it is nec-
essary to generalize the results with caution.
RECOMMENDATIONS
It is suggest conducting such studies in other areas
so that the population includes a greater number
of managers with a variety of individual charac-
teristics and compared with existing research.
The study only bene ts questionnaire to gather
data of the population. It is better to use other data
gathering tools for the information technology
and ef ciency such as observation, interview and
standard questionnaires as well to strengthen the
research results due to the process of the research.
It is suggested comparing the relationship between
IT and ef ciency in different organizations in
order to strengthen ef ciency theory.
It is suggested suing the available ndings based
on the ndings Seventh question (last) in order to
strengthen the ef ciency factors in the population.
REFERENCES
Burton-Jones, Anderw. & Hubona, Geoffrey S. (2006). The
mediation of external variables in the technology acceptance
model,Information & Management,43, 706–717.
Cheung Kong, siu. (2008). ”A curriculum framework for imple-
menting information technology in school education to foster
information literacy”, computers & Education, No. 51, pp. 129-
141.
Dillon, A., and Morris, M. G. (1996). User acceptance of infor-
mation technology: theories and models. Annual review of
information science and technology,31, 3-32.
Farahbod, Farzin; Baghersalimi, Saeed (2013). Acceptance and
use of ICT based on the model of UTAUT among Village Masters
of Guilan, Master’s Thesis, Islamic Azad University of Guilan.
Faramarzi, Zohre (2015). Development of organizational learn-
ing based on IT, Education Management master thesis, Payam-
noor University of Tehran.
Hong, Se-Joon., Thong, James Y.L. & Tam, Kar Yan. (2006).
Understanding continued information technology usage
behavior: A comparison of three models in the context of
mobile internet,Decision Support Systems,42, 1819–1834.
Kuo, Ying-Feng & Yen, Shieh-Neng. (2009). Towards an under-
standing of the behavioral intention to use 3G mobile value-
added services,Computers in Human Behavior,25, 103–110.

Ekrami and Barnasun
BIOSCIENCE BIOTECHNOLOGY RESEARCH COMMUNICATIONS FORECASTING THE EFFICIENCY OF STAFF BASED ON INFORMATION TECHNOLOGY 233
Lee, Sangjae. & Kim, Byung Gon. (2009). Factors affecting the
usage of intranet: A con rmatory study,Computers in Human
Behavior,25, 191–201.
Mitev, Nathalie, N (2001) “Empowerment change and infor-
mation technology. Technical design and business process Re-
engineering”, Personnel Reeview, vol. 4.
Rezaei, Masud (2009). Current theories on the acceptance of
information and communication technologies, Communica-
tion Researches Journal (Research and Evaluation) 2010, Vol-
ume 16, Issue 4, Pages 63-93
Sun, Heshan and Zhang, Ping. (2006). The role of moderating
factors in user technology acceptance,Int. J. Human-Computer
Studies,64, 53–78.
Walter, Zhiping. & Lopez, Melissa Succi. (2008). Physician accept-
ance of information technologies: Role of perceived threat to pro-
fessional autonomy,Decision Support Systems,46, 206–215.
Yi, Mun Y., Jackson, Joyce D., Park, Jae S. & Probst, Janice
C. (2006). Understanding information technology accept-
ance by individual professionals: Toward an integrative
view,Information & Management,43, 350–363.