
Biosci. Biotech. Res. Comm. Special Issue No 1:181-194 (2017)
Analysis of post-processing method for dynamic models
output using network data for the drought in North
West of Iran
Behrooz Sari Sarraf
1
, Ali Akbar Rasouli
1
, Majid Habibi Nokhandan
2
, Sina Samadi Naghab
3
*
and Sharareh Malboosi
4
1
Professor, Faculty of Geography and Planning, Tabriz, Iran
2
Associate Professor, Meteorology Research Institute, Tehran, Iran
1,3
PhD student of Climatology, University of Tabriz, Tabriz, Iran,
4
Expert of Climatological Research Institute, Mashhad, Iran
ABSTRACT
Since long time ago, prediction of precipitation status and investigation of drought hazards in catchment areas of North West of
Iran, due to the critical importance of discharge rate of related catchments for Lake Uromia, has been one of the most important
challenging issues in ef cient management of water resources; management of vast capital of water resources and energy produc-
tion of the country is highly affected by the aforesaid factors. Therefore, application of dynamic methods may play signi cant
role in adjustment of such conditions concerning the frequencies of climate parameters and occurrence of imbalance behaviors
in precipitation pattern of the country. Regarding improper distribution of observed data, this research rstly completes post-
processing operation using precipitation data of Aphrodite network, and Model Output Statistics(MOS) post-processing methods
on the output of dynamic prediction model MRI-CGCM3 in a 28-year period(1980-2007), the precipitation grid of post-processed
model and upon weighting output climate variables of dynamic model for each cell of data network and also, determining sta-
tistical model coef cients of multivariable correlation; output systematic error of the model highly reduced to be used in small
scale applications. Then, post-processed prediction data of dynamic model were applied for computing Standardized Precipitation
Index (SPI) provided in order to predict drought. Capabilities of selected post-processing method were assessed using evaluation
criteria. Findings showed that application of statistical post-processing on direct output of dynamic model results in developing
the monthly prediction of precipitation up to 29% in selected post-processing method. Accuracy of Standardized Precipitation
Index (SPI) predicting may increase up to 22.3% than no post-processing mode, in a way that this value reaches to 79.5% after
the implementation of post-processing operation.
KEY WORDS: POST-PROCESSING, DROUGHT, DYNAMIC MODELS, SEASONAL PREDICTION
181
ARTICLE INFORMATION:
*Corresponding Author: sisamadi@yahoo.com
Received 27
th
Nov, 2016
Accepted after revision 26
th
Dec, 2016
BBRC Print ISSN: 0974-6455
Online ISSN: 2321-4007
Thomson Reuters ISI ESC and Crossref Indexed Journal
NAAS Journal Score 2017: 4.31 Cosmos IF : 4.006
© A Society of Science and Nature Publication, 2017. All rights
reserved.
Online Contents Available at: http//www.bbrc.in/

182 ANALYSIS OF POST-PROCESSING METHOD FOR DYNAMIC MODELS OUTPUT BIOSCIENCE BIOTECHNOLOGY RESEARCH COMMUNICATIONS
Behrooz Sari Sarraf etal.
INTRODUCTION
Drought has been regarded as a basic parameter in sus-
tainable development issues; it is considered as one of
the most prominent climatic hazards, both in the short
and long-term scale. Concerning that drought is a prom-
inent natural hazard in Iran, and that in the last few
years, various parts of the country have been affected
by this hazard; therefore, it is of particular importance to
perform its assessment, monitoring and prognosis. One
of the methods used for quantifying drought hazards
deals with using drought indices which may be applied
for determining intensity and extension of drought on a
periodical style. So far, these indices have been used for
monitoring drought; but, we may use output of seasonal
predictions to predict such pro les. Seasonal predic-
tions provide some information about long-term aver-
ages. Land surface properties, especially calm variabil-
ity of ocean surface temperature can affect the Earth’s
weather. These effects are not observable in diurnal
scale, but they are observable on a larger time scale of
months and the seasonal averages.
A wide range of studies have been conducted within
and outside the country; but, most studies applied
hydro-climate observed data or climatic indices such
as El Niño–Southern Oscillation (ENSO) and the North
Atlantic Oscillation (NAO) and establishing interrelation
of rainfall and large-scale climate signals and they rarely
have used dynamic methods in the prediction of precipi-
tation. Concerning climatic variations of the recent years
and the occurrence of unusual behaviors in precipitation
pattern of the most parts of the country, application of
dynamic methods bear advantages than the statistical
methods which are solely based on the behaviors of sta-
tistical periods. Nowadays, the most common method
used in international centers for predicting rainfall on
hourly to seasonal time scales is the application of the
numerical dynamic models. The output of the aforesaid
models can be used as input for other applied models.
The main objective for predicting climatic conditions in
dynamic method is predicting the future of the status
of climatic variables according to their current condi-
tions and information and the application of numerical
approximations for dynamic equations. In the dynamic
method, we rstly provide prediction using a general
circulation model; then, dynamic downscaling will be
done on the desired area using a regional model. General
Circulation Models (GCM) simulate the climate system
with more complexities. Dynamic part includes numeri-
cal schemes which compute large scale atmospheric
transmissions. These transmissions are calculated in a
physical space or a spectrum space.
Nowadays, the outputs of these models are pre-
sented to users by international seasonal predicting
centers. Concerning the relatively large scale output of
these models, ranged from about 0.1 * 0.1 geographical
degrees to 2.5 * 2.5 geographical degrees which results
in lower resolution and more errors in the direct use
of the output of such models. Therefore, their output
has errors especially for the near ground surface vari-
ables including precipitation which requires correction
and post-processing analysis. There are a wide range of
methods used for post-processing analysis of the output
of numerical Prediction models of which we may name
Model Output Statistics (MOS). Application of tech-
niques and special conditions is required for determin-
ing correlation coef cient and effect of each parameter
of output model with the regional climate conditions.
Another problem in using post-processing methods is
lack of spatial and temporal distribution of observed
data to be used in the post-processing analysis of the
output of dynamic model, (Azadi etal., 2011).
In this regard, application of Aphrodite data can
greatly reduce calculation errors and considers proper
distribution of time and place in the category of post-
processing framework (Yatagai , et al., 2012). A wide
range of methods have been used in the post-processing
analysis of the output of dynamic methods; for example.
Babaeian et al. applied linear multivariable regression
method for post-processing the precipitation output of
MRI-CGCM3 model, (Babaeian etal., 2013).
In another study, (Kim et al 2012) performed sea-
sonal prediction of winter in the Northern Hemisphere
using seasonal predicting systems which were recently
updated using ECMWF and NCEP; through the revision
of predicting period (1982-2010), the paper evaluated
coupled seasonal climate prediction systems of ocean-
atmosphere and using ECMWF System 4 (Sys4) and the
National Center for Environmental Prediction (NCEP)
for model (CFSv2); they evaluated analysis with the use
of both data sets (Kim et al., 2012a). Also in another
research, Wilkes (2008) presented seasonal prediction
of temperature parameter in network form on North
America using developed statistical methods based on
the surface temperature data of the water bodies of the
North Paci c. Two time-series including long-term data
(from 1880 to 2007) and short term data (from 1950
to 2007) were tested the surface temperature of water
bodies in terms of Extended Reconstructed Sea Surface
Temperature version 2 (ERSST v.2) grid data with a hori-
zontal resolution of 2 × 2 degrees in statistical models
of Canonical Correlation Analysis (CCA) and Maximum
Covariance Analysis (MCA) and it showed that applica-
tion of long-term data, despite low accuracy of some of
them, may result in major promotion in accuracy of sea-
sonal predictions for winter temperature (Wilks 2008).
Also, Kim et al (2012) applied multivariable linear
regression method to provide seasonal predicts in South

BIOSCIENCE BIOTECHNOLOGY RESEARCH COMMUNICATIONS ANALYSIS OF POST-PROCESSING METHOD FOR DYNAMIC MODELS OUTPUT 183
Behrooz Sari Sarraf etal.
Korea using teleconnection indices. The present study
applied a maximum of ve predictive variables used for
the multivariable correlation models. The results of Kim
et al showed that monthly correlation coef cients of
temperature varied from 0.42 to 0.65 and for precipita-
tion changes from 0.37 to 0.63. Correction coef cients
for temperature vary from 18% to 42% and for precipi-
tation changes from 14% to 39% (Kim etal., 2012b). In
a research, Lim etal (2009) performed downscaling of
predicted seasonal precipitation (NCEP/CFS) with a reso-
lution of 2.5° to spatial scale of 20km on the South-East
United States, including Florida, Georgia and Alabama
using CSEOF model which is based on statistical down-
scaling (Lim etal., 2009). Jeffery and colleagues (2005)
demonstrated that the use of MOS technique (applica-
tion of statistical methods on the output of dynamic
models) results in development of two-week predictions.
They applied this method on global models of NCEP and
ECMWF. Application of MOS technique on two mod-
els results in development of prediction results higher
than application of MOS technique on one model (Jef-
frey, ,et al., 2005). Krishnamurti and colleagues (2000)
performed a research in connection with the seasonal
and climatic predictions with the use of research based
corrective multi-model predicts.
Finally, statistical weight of each model was deter-
mined using linear multivariable regression. They con-
cluded that the predictions of multiple models have
better performance than single models. The ndings
showed that the use of statistical methods in post-
processing multi-model predicts can improve multiple
predict system of distinct models (Krishnamurti, T. K.,
et al., 2000). Some of the statistical post-processing
methods do not require long-term data of the model
including neural network method (Fathi et al. 2010,
Hasanzadeh etal. 2012) and Genetic Algorithm method
(Kishtawal 2003) or Kalman ltering method (Rastgu
et al. 2010,) and the moving average method (Azadi,
et al. 2011, McCollor 2008, Johnson and Swinbank.
2010).
Gene and Renwick (2003) performed Seasonal Pre-
dicting of New Zealand temperature by using linear
multivariable correlation method and the parameters
of temperature, rainfall and water bodies’ surface tem-
perature for Paci c Ocean. (Zheng, Renwick 2003).Quito
etal. (2011) conducted a research on precipitation cli-
mate data of the Middle East using Aphrodite data and
comparing them with the output of MRI-CGCM3 Model.
They found that application of Aphrodite data may
highly increase spatial accuracy of the research; espe-
cially, application of network data instead of station-
based observed data in areas with mountainous con-
ditions may increase ef ciency of the downscaling of
climate models (Kitoh etal., 2011).
In another study conducted by Kasanicky and Kob-
ayashi (2003) evaluated the ef ciency of prediction prob-
abilities and the seasonal predictability of atmosphere
using Atmospheric General Circulation Model (AGCM) at
Japan Meteorological Agency (JMA), which is a global
spectral model with T63 resolution. The results showed
that the probable prediction contrary to de nite predic-
tion related to some seasonal and regional similarities,
such as higher relative ability in winters of the North-
ern hemisphere, East Asia and North America (Kusunoki
Kobayashi, 2003).
Meanwhile in another research, Rasa et al (2012)
developed Aphrodite data by the Research Institute for
Humanity and Nature (RIHN) and the Meteorological
Research Institute |Japan Meteorological Agency (MRI/
JMA) for wet areas and wet adjacent areas of Pakistan
with a Resolution of 0.05 degrees in decade form (Rasu
etal., 2012). Yasutomi etal. (2011) studied the develop-
ment of long-term networked temperatures data series
and its application in the separation of rain / snow at
daily precipitations (Yasutomi etal., 2011)
Therefore, application of post-processing technique
may develop outputs of dynamic models to be used
in subscales and the outputs of these models may be
implemented in macro-environment management with
a more comprehensive approach. Main objective of the
present research consisted of developing the accuracy
of seasonal predictions of precipitation of North-west of
the country using dynamic model output post-process-
ing method used toward managing the drought hazard.
MATERIAL AND METHODS
In this study, we used three data series; the rst series
is observed data of monthly precipitation obtained
from Meteorological Stations in the North-West of Iran,
including West Azerbaijan and East Azerbaijan and
Ardabil provinces (Figure 1). Selection of stations with
regard to the availability of long-term observed data of
precipitation (1980 - 2007) was according to predict data
and Aphrodite data.
Table 1 shows existing observation stations of the
studied region along with precipitation data of the obser-
vation stations, respectively presented for all seasons of
the year Second Series of Data are Aphrodite Data.
Aphrodite Project was developed in 2006 with the
aim of creating diurnal precipitation data in high res-
olution networks across Asia (Yatagai, et al. 2012). In
the same year, a project named APHRODITE was devel-
oped by the Research Institute for Humanity and Nature
(RIHN) and the Meteorological Research Institute |Japan
Meteorological Agency (MRI/JMA)in order to establish
networked diurnal precipitation databases across Asia
with high spatial resolution and as per the observations
Behrooz Sari Sarraf etal.
184 ANALYSIS OF POST-PROCESSING METHOD FOR DYNAMIC MODELS OUTPUT BIOSCIENCE BIOTECHNOLOGY RESEARCH COMMUNICATIONS
FIGURE 1. The studied region (North West of Iran)
Table 1. Climate statistics of observation stations in the studied region
Province
Station
Precipitation (mm) Total Precipitation (mm)
Precipitation Percentage
(%)
Variation
Range
Variance
Average
Max
Min
Spring
Summer
Autumn
Winter
Spring
Summer
Autumn
Winter
West Azerbaijan
Uremia
312.3 51 2.2 114.2 14.1 91.7 92.3 %37 %5 %29 %30 48.8 307.23
Piranshahr
662.9 106.5 1.6 170.7 7.1 196.8 288.3 %26 %1 %30 %43 104.9 1927
Takab
337.5 60 3.1 125.3 13.3 93 105.9 %37 %4 %28 %31 56.9 395
Khoy 263.2 52.6 6.2 114.9 29.2 64.7 54.4 %44 %11 %25 %21 46.4 163.55
Sardasht
833.5 135.9 1.3 214.4 4.9 253 361.2 %26 %1 %30 %43 134.6 3248.13
Mako
305.1 60.1 12.6 142.2 48.9 62.4 51.6 %47 %16 %20 %17 47.5 214.78
Mahabad 397 63.1 1.2 115.9 6.6 124 150.5 %29 %2 %31 %38 61.9 598.42
East zerbaijan
Ahar
287.6 55.4 6.4 123.8 25.5 75.5 62.8 %43 %9 %26 %22 49 190.77
Tabriz
247.2 46.8 3.4 102.3 13.7 65.6 65.6 %41 %6 %27 %27 33.4 180.56
Sarab
244.4 51 7 107.7 29.1 59.6 48 %44 %12 %24 %20 44 158.97
Mianeh 278.4 48.4 3.1 101.6 14.3 75.7 86.8 %36 %5 %27 %31 45.3 218.64
Ardebil
Ardebil
275.3 34.6 5.1 99.8 22.7 80.5 72.3 %36 %8 %29 %26 38.7 137.74
Pars Abad
274.2 62.2 6.2 91.1 32.6 92.7 57.8 %33 %12 %34 %21 28.4 94.42
Khalkhal 372.8 6.1 144.2 25.7 101.8 101.1 %39 %7 %27 %27 56.1 336.23
made by rain gauge. APHRODITE consisted of an inter-
national cooperation plan for collection and analysis of
rain gauging observed data collected from thousands of
stations across Asia plus the reports provided by World
Meteorological Organization (WMO) which resulted in
providing diurnal precipitation data for 57 years. This
database was provided by ADW interpolation method.
Aphrodite Data consists of integrated observed data of
precipitation in Asia with high-resolution which are
used for evaluating water resources in form of three
separate collections consist of the monsoon regions of
Asia, the Middle East and Russia with the spatial reso-
lution of 0.25 × 0.25 and 0.5 × 0.5 and with diurnal
timescale.
The initial step in using such data is to perform their
veri cation and contrast with the observed data obtained
from meteorological stations which are equipped with
rain gauge stations. Toward this, observed data in the

Behrooz Sari Sarraf etal.
BIOSCIENCE BIOTECHNOLOGY RESEARCH COMMUNICATIONS ANALYSIS OF POST-PROCESSING METHOD FOR DYNAMIC MODELS OUTPUT 185
same period were compared with Aphrodite data on the
synoptic station and rain gauge stations of North West
region of Iran including Ardabil and East Azerbaijan
and West Azerbaijan provinces. Figure 2 shows con gu-
ration of considered region in terms of using Aphrodite
data. The target area has 59 grids with 0.5x0.5 degrees;
where, corresponding Aphrodite data were extracted
through programming and changing format.
The third series of data is retrospective predicts of
rainfall and some meteorological variables affecting it,
such as geo-potential height, thickness of different lay-
ers, ground level pressure and other meteorological vari-
ables of model outputs. Generally, each seasonal pre-
diction model should be performed during each model
development for a 30-year period in order to compare
its results with the observed data. Comparing the predic-
tions of the last 30-year period with observed values,
accuracy of seasonal prediction model will be evaluated
and in terms of verifying the aforesaid model and it will
be used for the issuance of seasonal prediction.
In this research, we applied re-prediction data of MRI-
CGCM model output including 14 variables and general
index of the model output and 6 retrospective predictive
variables related to the network of the studied stations.
MRI-CGCM3 Model (Yukimoto etal., 2012) consists of
two components including atmospheric general circula-
tion model (MRI-AGCM3) and oceanic general circula-
tion model (MRI.COM) where its atmospheric component
is coupled with aerosol model of MASINGAR km
-2
. Cou-
pling intervals or data exchange between atmospheric
and oceanic models is one hour and the same interval
for Aerosol is 0.5 hour. In the atmospheric model of
MRI-AGCM3, atmospheric component of the model is
in spectral form in which the hydrostatic equations are
used as predictors.
The horizontal resolution of Tl159 model (about 120
km) is with 48 vertical layers in ETA coordinate system.
The structure of this model consists of three major com-
ponents, namely: (a) the initial eld input data of the
model, obtained through the analysis of meteorological
variables, ocean and land surface variables, (b) an inte-
grated prediction system of the atmosphere, oceans and
land and (c) the map products and error analysis and
assessment system. Applied variables and indices with
their explanations are given in Table 2.
Total of the rst 14 parameters of the output of MRI-
CGCM3 model have been used on a monthly basis at
Tokyo Climate Centre (TCC) for post-processing. They
have been chosen in a way to be appropriate for the
climate of South-East Asia; but, a signi cant number of
them are suitable for our climate, too. In addition to the
aforesaid 14 indices, 6 other variables including H500,
SLP, T2M, T850 and Model-Pr will be extracted from the
model output les.
Table 2. Output Parameters of MRI-CGCM3 Model
Parameter Variable Parameter Variable Parameter Variable
Z2030
Geopotential height of 500
millibar
NINOSST
Water surface
temperature
H500
Geopotential height of 500
millibar
Z3040
Average Geopotential height of
500 millibar
NINOWESTSST
Water surface
temperature
SLP Mean sea level pressure
Z4050
Geopotential height of 500
millibar
DLRAIN Precipitation SST Water surface temperature
Z5060
Geopotential height of 500
millibar
WIORAIN Precipitation T2M Temperature in 2m
THMD
Thickness between 300 and 850
millibar
SAMOIRAIN Precipitation T850 Temperature in 850milibar
THEX
Thickness between 300 and 850
millibar
WNPRAIN Precipitation Model-Pr Precipitation in Network
WIOSST Water surface temperature MCRAIN Precipitation
FIGURE 2. Regular grids of Aphrodite data with
0.5x0.5 degrees on the studies region

186 ANALYSIS OF POST-PROCESSING METHOD FOR DYNAMIC MODELS OUTPUT BIOSCIENCE BIOTECHNOLOGY RESEARCH COMMUNICATIONS
Behrooz Sari Sarraf etal.
POST-PROCESSING OF PRECIPITATION DATA
AND VERIFYING RESULTS
The method applied in statistical post-processing is lin-
ear multivariable regression method on precipitation
data. Multivariable regression methods may modify both
types of random and systematic errors in model outputs.
The predictability of random error is much more dif-
cult than systematic errors. In this method, prediction
and observed data are divided into two courses “statis-
tical post-processing model” and “examination”. Multi-
variable regression method is a method of making model
equation from past data series (Shimizukawa etal. 2009).
This method is one of the most powerful ways to
explain the inter-relationship of observed and modeled
variables. The general form of multivariable regression
equation is as follows:
(1)
Where, Y
t
is dependent variable or predictant and X
kt
is independent variable or predictor. Since, total of 20
seasonal prediction variables are applied for the devel-
opment of multivariable correlation model and some of
which have no signi cant relation with observed precip-
itation of the region; therefore, all predictors (independ-
ent variables) were inserted in model toward omission
of non-effective variables; then, the variable with least
correlation became omitted.
In selection of the nal variables for adjustment coef-
cient of R
2
, balanced adjustment coef cient of R
2
-Adjust
and F and t statistics are also effective. R
2
presents the
percentage of variable changes of the predictant using
predictors. R
2
-Adjust or balanced R
2
will be used when the
number of independent variables increased. Negative val-
ues of balanced adjustment coef cient are not accepted.
Advantage of linear multivariable correlation method
is that despite the non-intervention of atmosphere phys-
ical processes, a signi cant relationship may be estab-
lished between predictants of the region and predictors
of large-scale atmospheric circulation model output and
then applied its results for downscaling local parameters
including precipitation (Lee, J., Y., 2003).
In this study, the 28-year period of seasonal Predic-
tion model can be divided into two periods of 22-years
and 6-years. Data of the 22years period are used for the
extraction of the precipitation behavior of MRI-CGCM3
Model on the studied network points. This has been per-
formed through determining the variable of prediction
indices with highest correlation with point precipitation
of the network and determining statistical model coef-
cients of multivariable correlation. Then, the statistical
model obtained from 22 years output of MRI-CGCM3
model and precipitation network data were applied for a
6 years period to predict monthly rainfall. Jump (JMP4)
software was used in this research for the determination
of partial correlation between 20 variable output indices
of MRI-CGCM3 Model with observed precipitation of the
station. Investigations showed that if number of input
variables in multivariable model exceeds from 3, post-
processing errors increase the same and prediction of the
precipitation points of the network increases with the
same trend; therefore, multivariable model was designed
based on 3 input variables.
Also, four evaluation indices of Mean Square Skill
Score (MSSS), Relative Operating Characteristics (ROC),
Mean Bias Error (MBE) and Relative Error (RE) were
applied for investigating capabilities of selected post-
processing method in predicting point precipitation of
studied regional stations network.
Mean Square Skill Score (MSSS) index predicts the
relative accuracy of post-processed model compared
with the actual values of observed data; whereas:
It is necessary to calculate the Mean Square Error (MSE)
of observed data (MSE
c
) and prediction (MSE
f
).
Where and xi respectively are the ith predicted value
and ith observed value of n data. RMSE
f
and RMSE
c
values are obtained respectively for square root of the
mean square error prediction and observed values. In an
accurate prediction, square root of the mean square error
prediction equals 1 (MSSS=1) and in a full incorrect pre-
diction, it equals 0 (MSSS=0). It shows that application
of post-processed model output is more successful in
comparison with climate means (Gheti, 2007).
In addition to the two aforementioned indices, mean bias
error (MBE) and the mean relative error were also applied
in examining the capabilities of post-processing method
which are calculated according to the following formula.
Where Mi and Oi are respectively predicted and observed
values. Relative errors (RE) of predictions are calculated
as follows:
(2)
(3)
(4)
(5)
(6)

Behrooz Sari Sarraf etal.
BIOSCIENCE BIOTECHNOLOGY RESEARCH COMMUNICATIONS ANALYSIS OF POST-PROCESSING METHOD FOR DYNAMIC MODELS OUTPUT 187
On one hand, we may calculate ROC curve and also cor-
rect Hit Rate (HR) prediction indices and False Alarm
Rate (FAR) incorrect prediction indices for each class
of predictions in which the ROC sub-curve area shows
evaluation of the prediction; where, much more closing
to 1 shows higher capability of the model (WMO, 2006).
DROUGHT PREDICTION INDEX (SPI)
Concerning the importance of being aware of drought
status for the future months in planning for agricul-
ture, water resources and environments, we may use
predicted precipitations to compute Drought Prediction
Index (SPI) in monthly and seasonal (3 months) scales
for studied network cells. The reason for this index deals
with the monthly data of Aphrodite network and conse-
quently, in having monthly post-processing data. Since,
SPI index may be calculated only if having monthly
precipitation data; therefore, this index is suggested for
predicting drought. SPI index was presented by McKee
and colleagues to quantify the precipitation and drought
observation. Wide range of applications enables SPI
index to observe drought in short-term scales includ-
ing soil moisture and long-term scales including surface
waters and ground waters (Fattahi etal., 2007). Based on
SPI method, drought period occurs when the SPI is con-
tinuously negative and reaches a value of -1 or less; and
it ends when the SPI is positive, and the cumulative val-
ues of SPI show the magnitude and severity of drought
period and wet periods. The classi cations of SPI values
are shown in Table 3 (Moghaddam 2007).
RESULTS AND DISCUSSION
This research regarded the selected course of study from
1980 to 2007; 70% of which i.e. 1980-2001 was consid-
ered as the test course and providing monthly post-pro-
cessing regression equations and 30% of which i.e. 2002-
2007 was considered as veri cation period. Aphrodite
data networked in 59 network cells of 0.5x0.5 degrees
were extracted for the studied region and validated with
the observed data of regional stations; whereas, results
showed proper accuracy of Aphrodite data which nally
resulted in their application instead of sparse data of
stations (Figures 3 - 7). It is to be noted that networked
Aphrodite data absolutely increased accuracy of the
study with regard to topographic conditions of the stud-
ied region and dispersion of stations.
In the rst step and corresponding to the test period,
precipitation prediction was calibrated during the period
of 1980-2001; variables with highest correlation with
Table 3. Classi cation of SPI index as per McKee etal
Classi cation of SPI drought index as per McKee etal (Ensa moghaddam, 2007)
Status SPI Index Status SPI Index
Sever wet ≤2 Relatively Dry -1 to -1.49
Very wet 1.5 to 1.99 Very dry -1.5 to -1.99
Relatively wet 1 to 1.49 Sever dry ≥-2
Near normal -0.99 to +0.99
FIGURE 3. Zoning rainfall data of March; Right: Observed Data and Left: Aphrodite data

Behrooz Sari Sarraf etal.
188 ANALYSIS OF POST-PROCESSING METHOD FOR DYNAMIC MODELS OUTPUT BIOSCIENCE BIOTECHNOLOGY RESEARCH COMMUNICATIONS
FIGURE 6. Zoning rainfall data of December; Right: Observed Data and Left: Aphrodite data
FIGURE 4. Zoning rainfall data of June; Right: Observed Data and Left: Aphrodite data
FIGURE 5. Zoning rainfall data of September; Right: Observed Data and Left: Aphrodite data

Behrooz Sari Sarraf etal.
BIOSCIENCE BIOTECHNOLOGY RESEARCH COMMUNICATIONS ANALYSIS OF POST-PROCESSING METHOD FOR DYNAMIC MODELS OUTPUT 189
monthly precipitations were extracted for each net-
work cell and their monthly post-processed equations
were designed. In next step, gross output of MRICGCM3
Model was amended for each of the network cells using
monthly post-processed equations for each network cell
in the studied area; and prediction of cell precipitation
was extracted for the test period of 2002-2007. Finally
for the accuracy of the performance of results and equa-
tions in future predictions, results of validation period
were validated using actual data. Applying the results of
the precipitation predicted in SPI index, we may study
zoning of drought prediction in the studied region.
Due to the high volume of maps and charts, which
were carried out separately for each cell, 505 cell analy-
sis with 45.25 degrees in longitude and 37.75 degrees
in latitude were presented as samples in this research
which can be generalized to other cells, as well.
Table 4 shows the input parameters for different
months of the year in regarded network cells which were
obtained through multivariable regression equations
and they were determined for the post-processed model
and they were given toward post-processed precipita-
tion model; they are mentioned along with the accu-
racy of the classi ed prediction of monthly precipitation
FIGURE 7. Zoning annual rainfall data; Right: Observed Data and Left: Aphrodite data
Table 4. Prediction model of the parameters of MRI-CGCM3 model toward post-processing network cell rainfall No. 505
during the statistical period of 1980-2007
MonthModel IndexMSSS
Accuracy of
classi ed
prediction %
MBEMRE
Before Post
Process
After Post
Process
Before Post
Process
After Post
Process
JanSst, h2,IOBW Rain
0.7472.2226.45-6.531.150.28
FebMC Rain, IOBW SST, Z4050
0.8888.8918.415.330.59-0.17
MarSST, h2, THEX
0.6150.0014.942.490.390.06
AprWIO SST, Z3040, DL Rain
0.7838.8916.34-21.520.25-0.33
MayH2, SST NNOWEST SST, NNO3
0.5738.8958.6314.171.400.34
JunZ2030, h2, Z4050
0.1683.3373.45-3.5711.510.56
JulSST, Z2030, THTR
0.1366.6789.78-6.4411.94-0.86
AugDL Rain, IOBW Rain, MC,Rain
0.1983.3378.650.9968.39-0.86
SepP850, WNP Rain, TPR
-12.22
66.67108.130.4481.983.30
OctMC Rain, WIO SST, DL Rain
0.40
75.2250.626.841.940.26
NovZ3040, Z4050, NNO WEST
0.6872.2252.29-12.791.350.33
DecELO SST, WIO Rain, ELO Rain
0.30100.0081.694.7712.630.74
Average
67.5955.786.67
76.770.11
Behrooz Sari Sarraf etal.
190 ANALYSIS OF POST-PROCESSING METHOD FOR DYNAMIC MODELS OUTPUT BIOSCIENCE BIOTECHNOLOGY RESEARCH COMMUNICATIONS
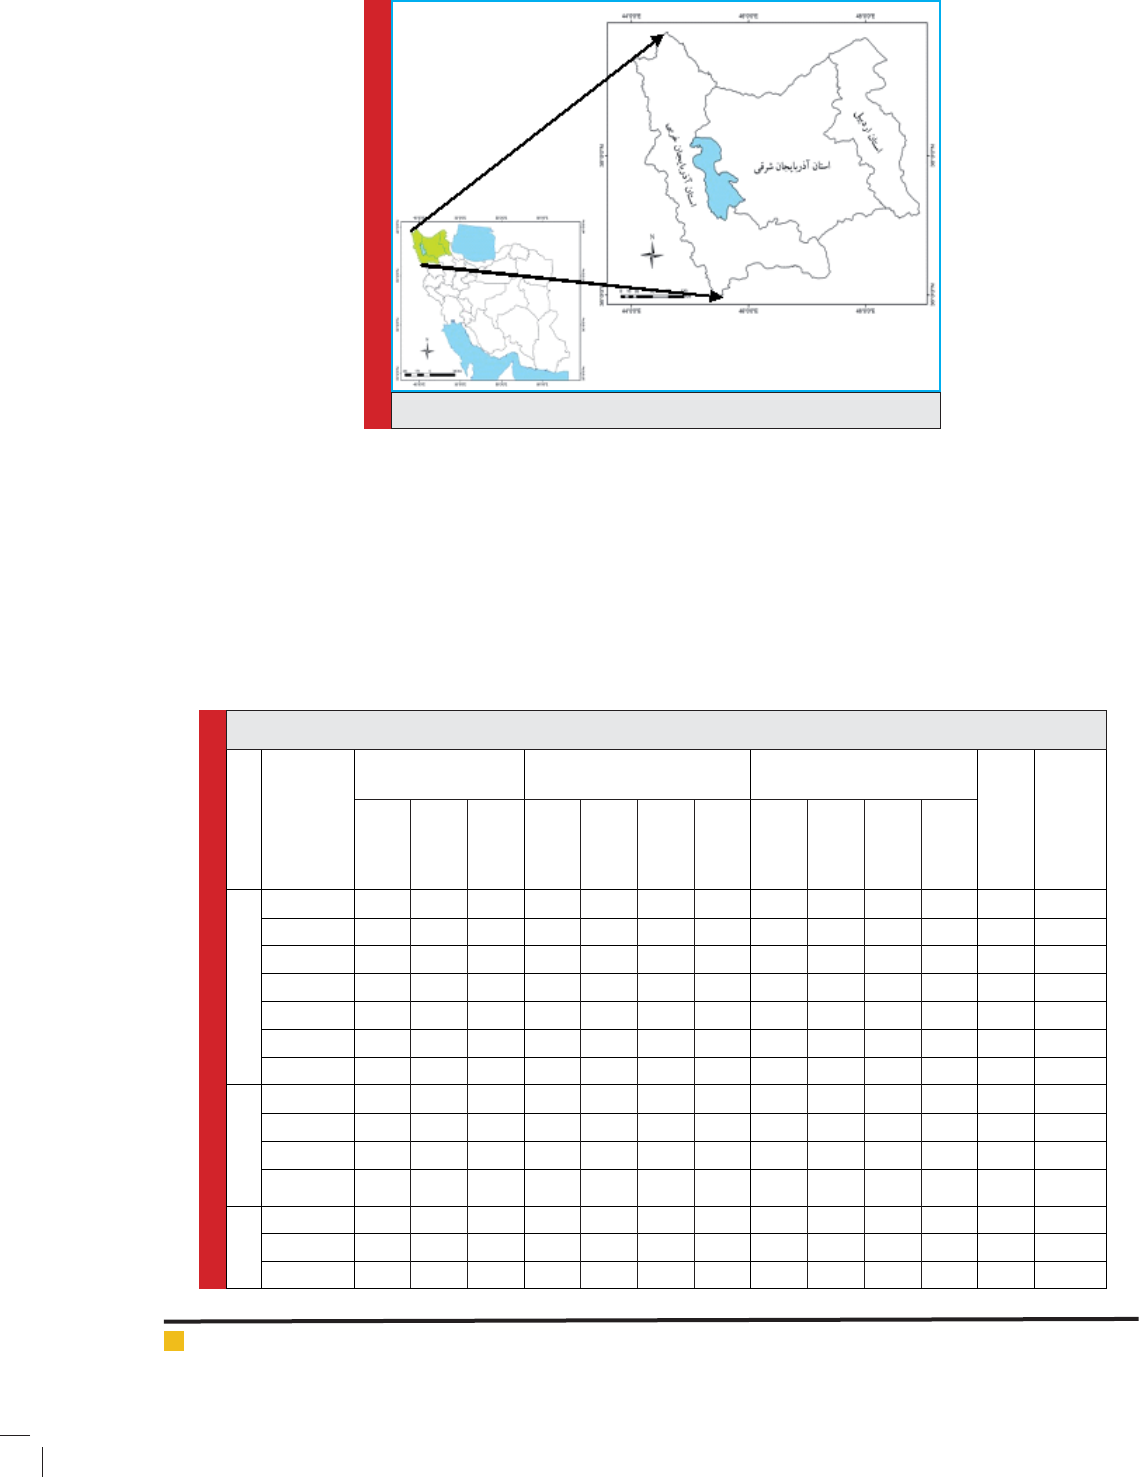
FIGURE 8. The post-processing results of MRI-CGCM3 model output during the training and prediction peri-
ods on the Aphrodite network of Grid 505(1980-2007)
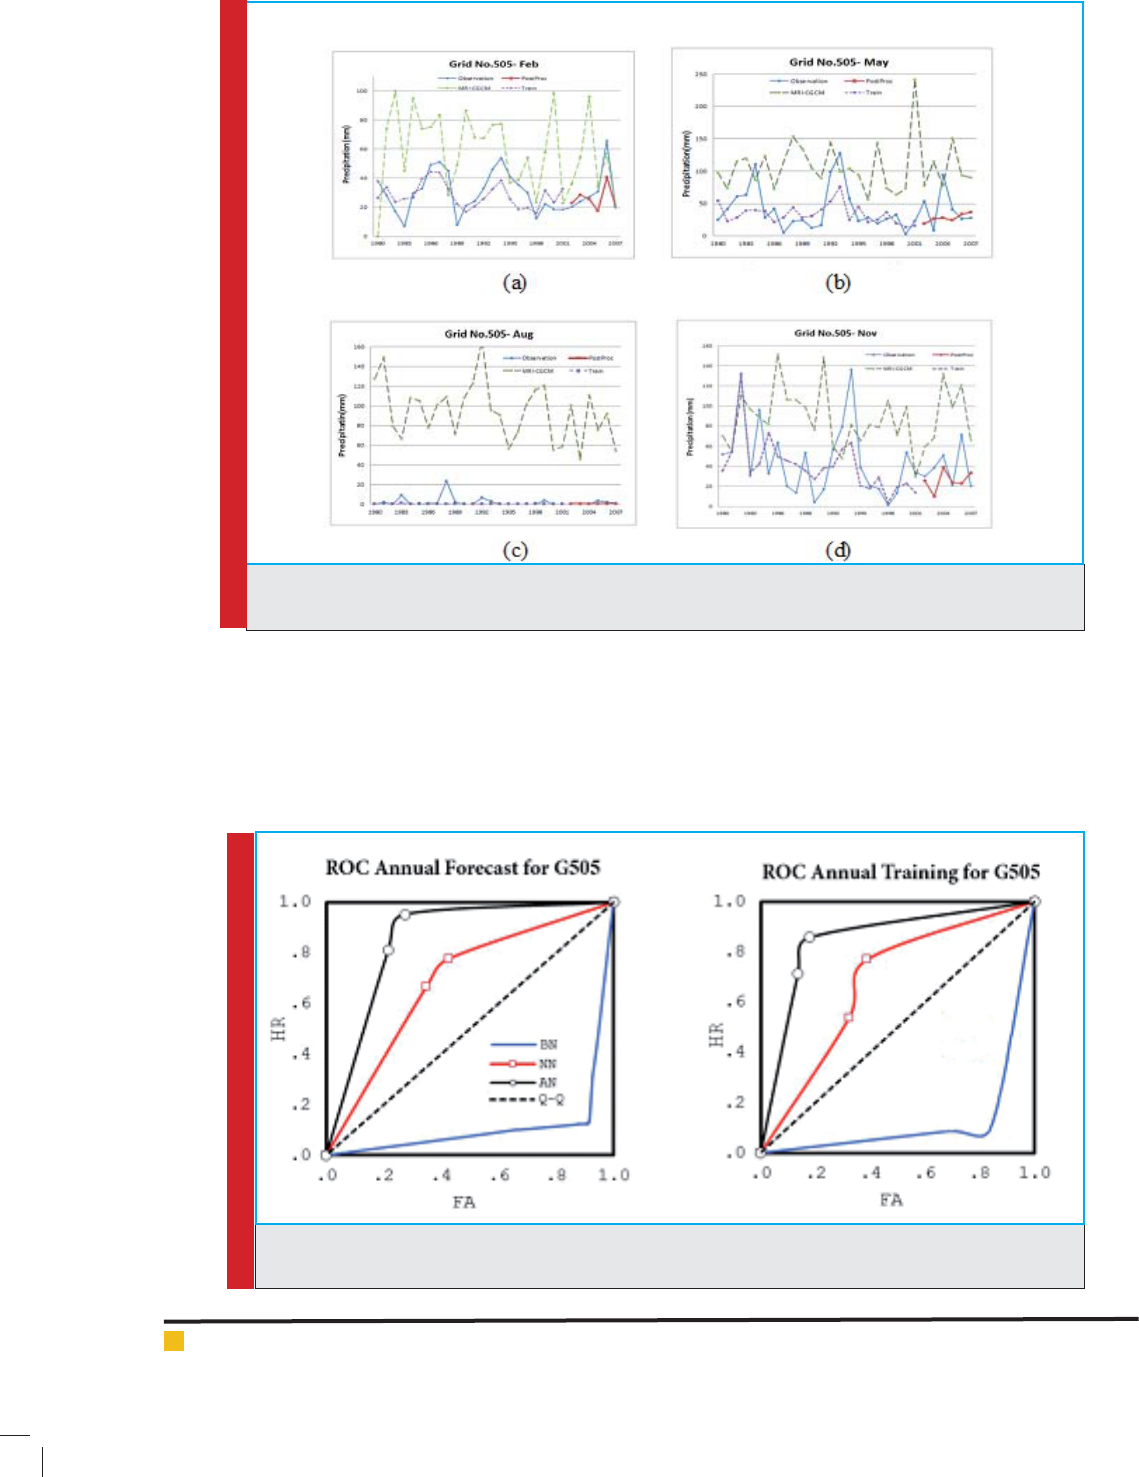
FIGURE 9. ROC curve of post-processed precipitation data using multivariable regression method for the
training period (right) and prediction period (left) in an annual scale
and bias before and after post-processing procedure.
According to the above table, the least square error
(MSSS) index, the best capability of post-processing
model was observed in February with a value of 0.88
and the least value was observed in July as 0.13. There-
fore, monthly prediction accuracy average over the year
is 67.59%. Applying statistical bias post-processing and
relative error respectively reduced from 55.78 to 6.76mm
and 76.87 to -0.11.
Figure 8 shows rainfall graphs predicted by the MRI-
CGCM3 model for February (a), May (b), August (c) and
November (d) which include data of the model before
Behrooz Sari Sarraf etal.
BIOSCIENCE BIOTECHNOLOGY RESEARCH COMMUNICATIONS ANALYSIS OF POST-PROCESSING METHOD FOR DYNAMIC MODELS OUTPUT 191
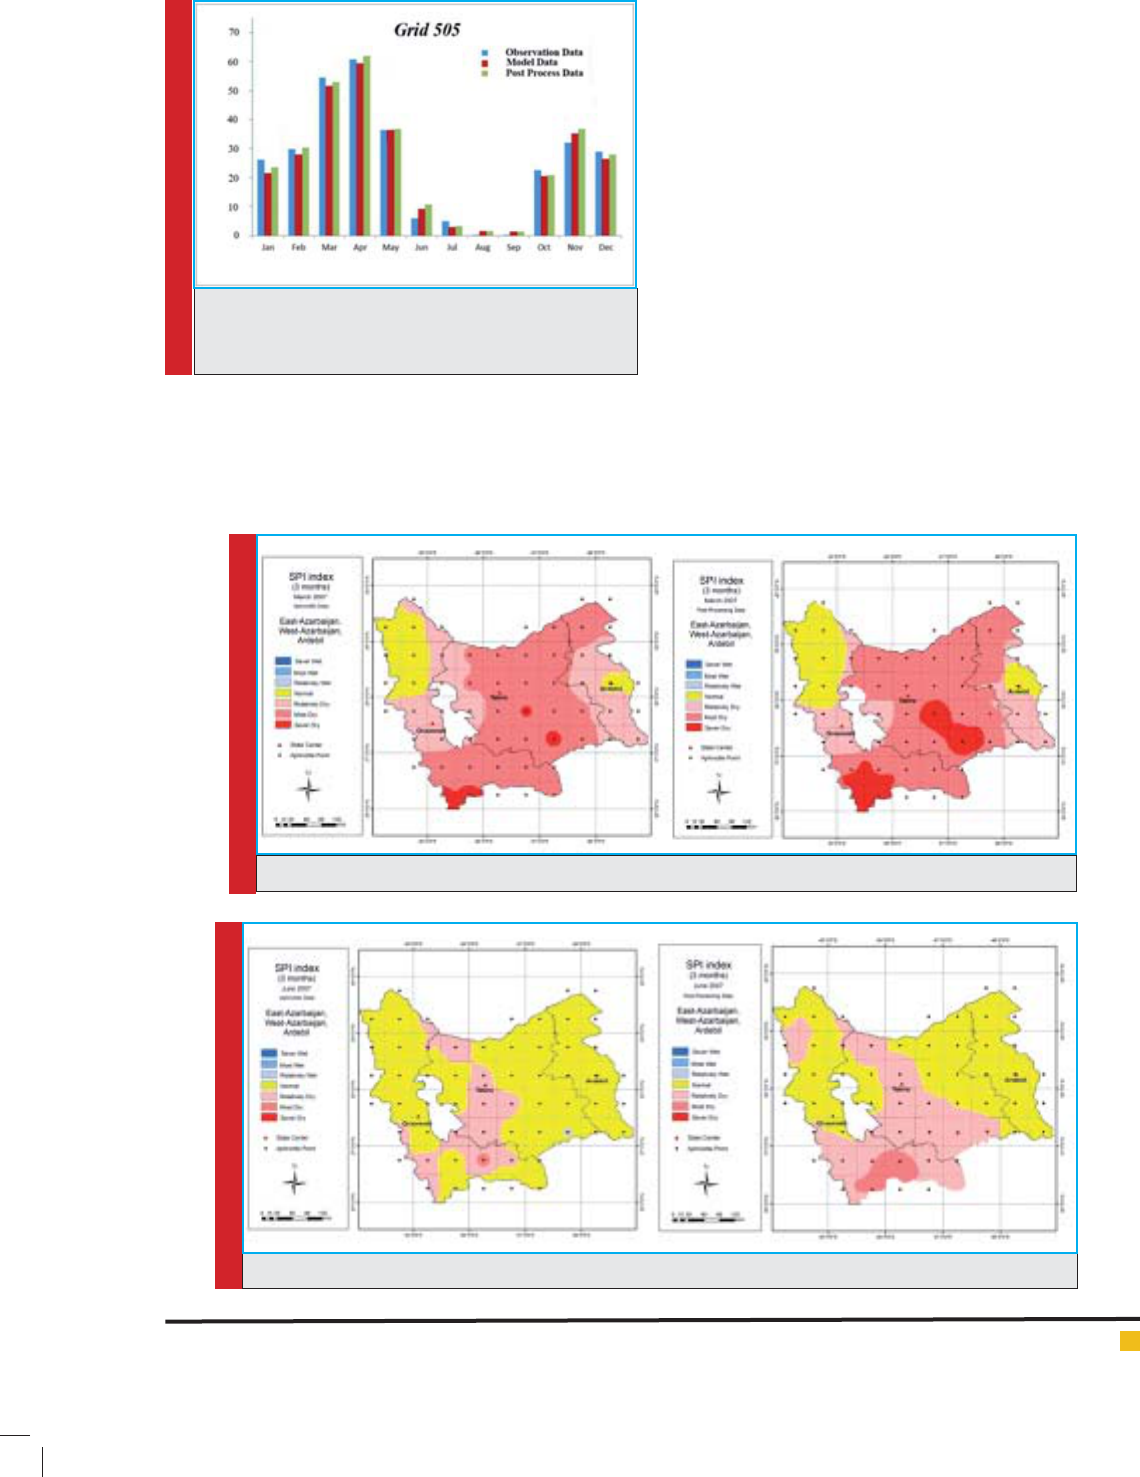
FIGURE 10. Comparison of Aphrodite network rainfall,
raw model output and post-processed output obtained in
multivariable regression method for the network of 505
FIGURE 11. Zoning SPI index for March (winter), right: Aphrodite data and left: post-processed model data
FIGURE 12. Zoning SPI index for June (spring), right: Aphrodite data and left: post-processed model data
post-processing (MRICGCM) and after post-processing
(Train), Aphrodite network rainfall (Observation) and
modeling test period precipitation (Post-processing)
brought for 505 cells as a sample.
Figure 9 shows post-processing precipitation data of
ROC curve obtained in multivariable regression method
for network of 505 during the two periods of training
and prediction periods in annual scale. In this graph,
vertical vector indicates true prediction index and hori-
zontal vector indicates false prediction index. Results
show that highest ef ciency of the model deals with the
time in which precipitation is predicted in normal or a
higher range. It has less accuracy in low precipitation
months.
Figure 10 shows precipitation data average of Aph-
rodite network, raw model data and post-processed data
in multivariable regression method for the network of
505 over the prediction period (years 2002-2007). The
results indicated that there is a signi cant difference
between raw predicted output and post-processed out
of the model; in a way that post-processed model pre-
diction has proper consistency with network Aphrodite
data and this appropriation and consistency have better
results in high precipitation months.
Behrooz Sari Sarraf etal.
192 ANALYSIS OF POST-PROCESSING METHOD FOR DYNAMIC MODELS OUTPUT BIOSCIENCE BIOTECHNOLOGY RESEARCH COMMUNICATIONS
FIGURE 14. Zoning SPI index for December (autumn), right: Aphrodite data and left: post-processed model
data
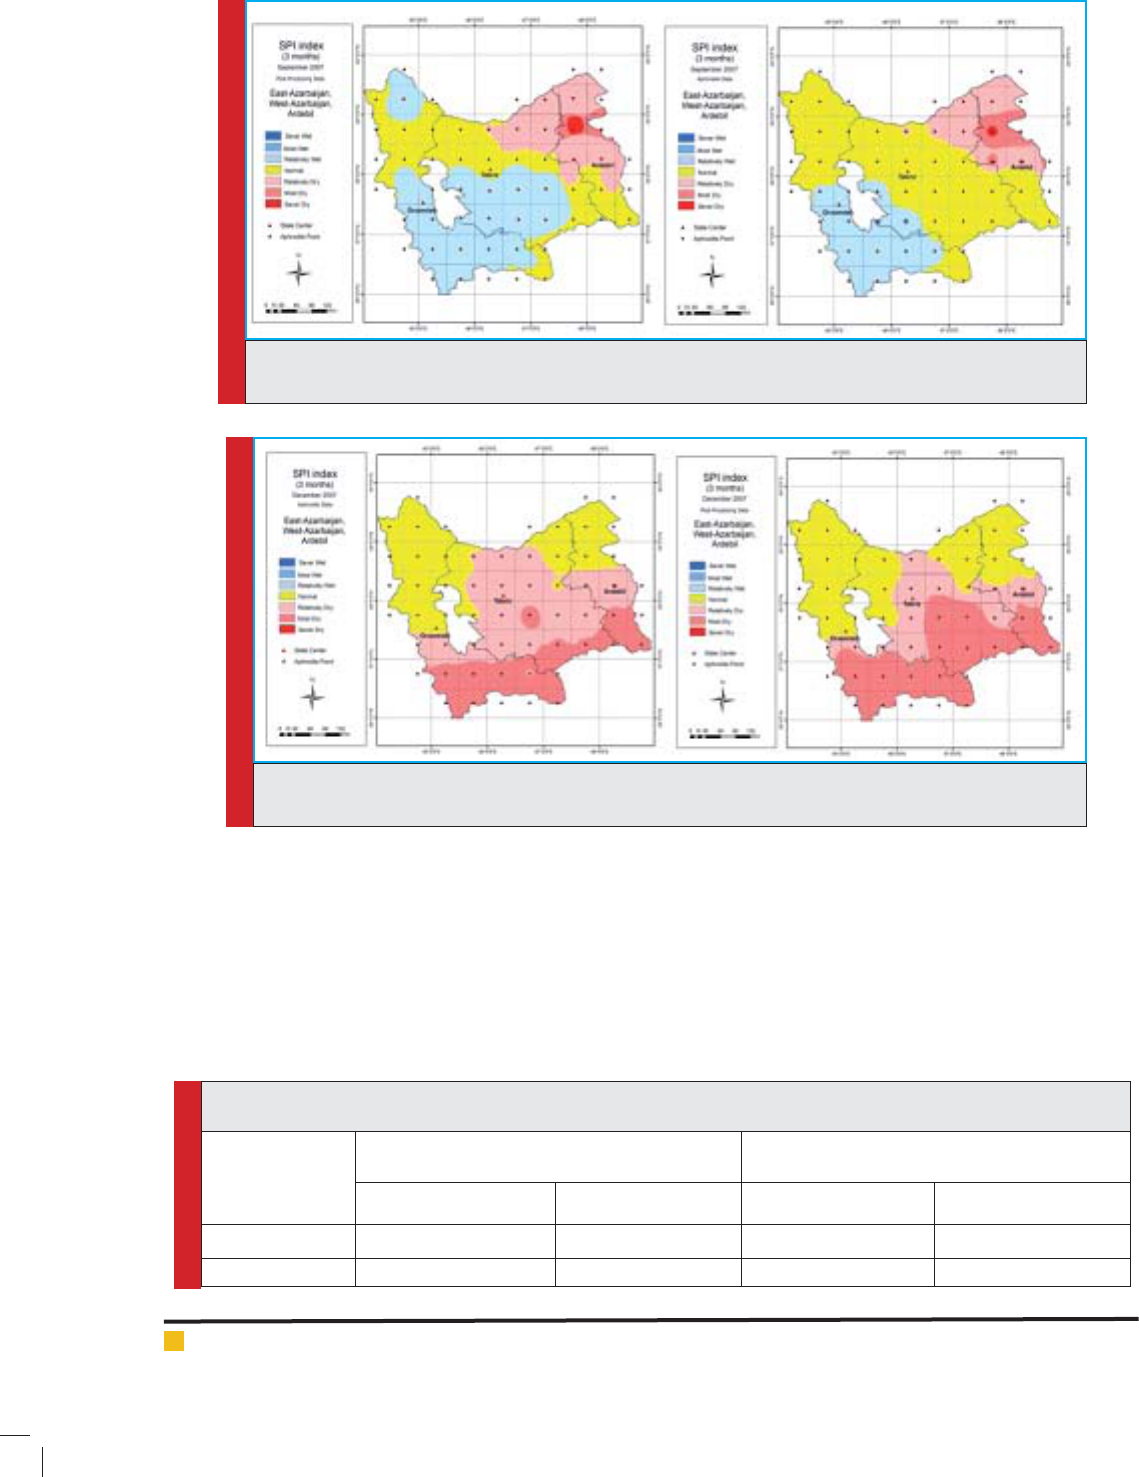
FIGURE 13. Zoning SPI index for September (summer), right: Aphrodite data and left: post-processed model
data
Table 5. The capability of MRI-CGCM3 model in predicting seasonal SPI indices in the network of 505 during the period
of 2001 to 2007
Network
Accuracy of classi ed prediction %
Correlation of SPI model prediction with the
Observed
Before Post-processing After Post-processing Before Post-processing After Post-processing
505 60.9 78.4 0.068 0.46
Networks Average 61.7 79.5 0.061 0.49
Figures 11 to 14 show zoning of SPI drought index
modi ed using Aphrodite network rainfall and the rainfall
predicted by MRI-CGCM3 model subject to post-processing
process. In the aforesaid gures, SPI index can be seen for
the three months periods leading to March (winter), June
(spring), September (summer) and December (autumn).
Table 5 indicates the rate of increase in prediction
accuracy of SPI index by the MRI-CGCM3 model after
performing statistical post-processing process in Aph-
rodite network cell of 505 for the studied region. In the
second and third columns of the table, the prediction
accuracy rate of seasonal drought index is given as
per modi ed classi cation of Maki et al.; and in two
last columns, the correlation value of drought indices
before and after performing post-processing process was
inserted on model output.
The above table shows the accuracy of the drought
index prediction in the period 2001 to 2007 for the cells

Behrooz Sari Sarraf etal.
BIOSCIENCE BIOTECHNOLOGY RESEARCH COMMUNICATIONS ANALYSIS OF POST-PROCESSING METHOD FOR DYNAMIC MODELS OUTPUT 193
of network 505 as well as the mean of 59 existing Aph-
rodite networks available in the studied region; in other
words, there are 12 predictions for SPI index of each
year. According to this table, the inter-correlation of SPI
values calculated from not post-processed precipitation
of MRI-CGCM3 model to network 505 was 0.068 that
after post-processing, it reached to 0.46; for networks
average, the amount improved from 0.061 to 0.49. Also,
prediction accuracy of this index according to the clas-
si cation presented in Table 5 for not post-processed
SPI index for the network of 505 samples was 60.9%
and for post-processed SPI was 78.4%; this amount for
the studied networks improved from 61.7% to 79.5%
indicating the promotion of prediction accuracy of this
index valued at 22.3% after performing statistical post-
processing process.
CONCLUSION
Concerning the importance having access to seasonal
predictions and also the prediction of annual conditions
for future months in North West of Iran and especially
for three provinces of West Azerbaijan, East Azerbaijan,
and Ardebil; they mostly cover catchment areas of the
Lake Uremia bearing special importance in this regard.
Also, management of energy and water resources in the
said region is highly affected by climate conditions; this
research tends to apply multivariable regression method
for post-processing the output of the seasonal prediction
of MRI-CGCM3 model on the aforesaid region toward
promoting accuracy of monthly predictions and also,
drought index. Toward realization of this, multivariable
regression method was networked on 20 model indices
and applying Aphrodite data which has less temporal
and spatial errors than observed data of stations. Num-
ber of Aphrodite network points in the aforesaid region
is 59 points with spatial distance of 0.5 geographical
degrees, having highest accuracy after the validating
station based data; therefore, their application for the
studied region with its special topographical conditions
may increase post-processing accuracy.
The applied statistical period of this research is a
28-year period (covering from 1980 to 2007) which
is even in both Aphrodite and model data series. The
above-mentioned period can be divided into two periods
of 22-years used for determining multivariable regres-
sion equations for each point of the network and for
different months of the year and also a 6-years period
for presenting prediction and validating predictions with
actual data. Then, results of the prediction of SPI drought
index were applied. The obtained results were vali-
dated using statistical indices and ndings showed that
application of multivariable regression method in post-
processing model output excluding spatial range, has
higher accuracy in cold and high precipitation seasons
and less accuracy in low precipitation seasons. Also, the
monthly bias value of the precipitation decreased from
the 67mm for before post-processing to 9mm for after
post-processing. This indicates positive effect of apply-
ing post-processing method on model output.
Finally, correlation value of post-processed and not
post-processed output indices were validated using
results in SPI index which increased from 0.061 to 0.45
for mean network points and the accuracy of classi ed
predictions improved from 61.7% to 79.5% indicating
22.5% promotion from post-processing method in model
output. Findings of the present research indicated that
application of post-processing method on model out-
puts may improve accuracy of results for smaller spa-
tial scales; also, application of Aphrodite network data
instead of station based sparse data may lead to more
improved results. Application of post-processed results
in SPI index may lead to codi cation of a comprehen-
sive model in using drought index in drought prediction
context and it provides seasonal predictions for drought
hazard. This may develop future macro-management in
the eld of climate and drought.
REFERENCES
Azadi M., Shirgholami M., Hojam S., Sahraeean F. (2011) Post
processing WRF model output for daily precipitation in Iran.
Iran-Water Resources Research 7(4):71-80 (In Persian)
Babaeian I., Karimian M., Modirian R.(2013), Statistical post
processing MRI-CGCM3 output for seasonal precipitation fore-
cast over Khorasan-Razavi province. Iranian Journal of Geo-
physics 7(3):119-133 (In Persian).
Ensa Moghadam T., 2007, An Investigation and assessment of
climatological indices and determination of suitable index for
climatological droughts in the Salt Lake Basin of Iran, 14(2):
271-288 (in Persian)
Fathi Margh A., MH.Mahdeian, (2010), Predicting winter pre-
cipitation using indicators beyond the neural barley yields:
a case study for Isfahan, Iran. International Journal of Ayer
2:451-469 (In Persian)
Fattahi A., y.Sedaghatkerdar,(2007), Curve analysis of time and
severity of drought frequency: Case study in south west sta-
tions of Iran, 5(10):77-90 (in Persian)
Finnis J., W. W.Hsieh, H.Lin, and W.Merry eld, (2011), Nonlin-
ear post-processing of numerical seasonal climate forecasts:
Journal of Atmosphere-Ocean, 26, 1-34.
Gheti R., 2007, Statistical post-processing of dynamical surface
air temperature seasonal predictions using the leading ocean-
forecd spatial patterns, MSc Thesis, McGill University, 87pp
Hasanzadeh Y., A. Abdi Kordani, A.Fakherifard, (2012), fore-
casting drought by using Genetic Algorithm and wavelet-
neural network hybrid model. Journal of Water & Wastewater
3:48-59 (In Persian)

Behrooz Sari Sarraf etal.
194 ANALYSIS OF POST-PROCESSING METHOD FOR DYNAMIC MODELS OUTPUT BIOSCIENCE BIOTECHNOLOGY RESEARCH COMMUNICATIONS
Jeffrey S., X. Wei, 2005, Improving week two forecast with
multi-model re-forecast ensemble. Monthly Weather Rviewi,
pp. 1-25.
Johnson C., Swinbank R., (2009) Medium-range multi-model
ensemble combination and calibration. UK met-of ce Techni-
cal Note 517:31
Kamiguchi K., O. Arakawa, A. Kitoh, A. Yatagai, A. Hamada,
N. Yasutomi, (2010), Development of APHRO_JP, the First
Japanese High-resolution Daily Precipitation Product for More
than 100 Years, Hydrol. Res. Lett., 4, 60–64.
Kim H., P.J. Webster, J.A. Curry, (2012a) Seasonal Prediction
Skill of ECMWF System 4 and NCEP CFSv2 Retrospective
Forecast for the Northern Hemisphere Winter, Climate Dynam-
ics Observational, Theoretical and Computational Research on
the Climate System.
Kim H., P.J. Webster, J.A. Curry, V.E. Toma, (2012b,) Asian
Summer Monsoon Prediction in ECMWF System 4 and NCEP
CFSv2 Retrospective Seasonal Forecasts, Climate Dynamics
Observational, Theoretical and Computational Research on the
Climate System.
Kishtawal C.M., S. Basu, F. Patadia, P.K. Thapliyal, (2003), Fore-
casting Summer Rainfall over India Using Genetic Algorithm,
Geophys. Res. Lett., 30(23), 2203, doi: 10.1029/2003GL018504.
Kitoh A., Arakawa O., (2011), Precipitation Climatology over
the Middle East Simulated by the High-Resolution MRI-
AGCM3, Global Environmental Research, 15/2011: 139-146
Krishnamurti, T. K., C. M., Kishtawal, Z., Zhang, T., Larow, D.,
Bachiochi, E., Williford, (2000), Multimodel ensemble forecasts
for weather and seasonal climate, Journal of Climate, NO. 13,
pp. 4196-4216.
Kusunoki S., C. Kobayashi, (2003), Skill Evaluation of Proba-
bilistic Forecasts by the Atmospheric Seasonal Predictability
Experiments, Journal of the Meteorological Society of Japan,
Vol. 81, No. 1, pp. 85-112, 2003 85.
Lee, J. Y., (2003), Data and Model Description, Assessment of
Potential Seasonal Predictability with a Multi-Model Dynami-
cal- Statistical Ensemble System: Ph.D. thesis, Faculty of the
Graduate School of the Seoul National University.
Lim Y.K., S. Cocke, D.W. Shin, J.T. Schoof, T.E. LaRow, J.J.
O’Brien, (2009), Downscaling Large-Scale NCEP CFS to Resolve
Fine-Scale Seasonal Precipitation and Extremes for the Crop
Growing Seasons over the Southeastern United States, Cli-
mate Dynamics Observational, Theoretical and Computational
Research on the Climate System.
McCollor D., Stull R., (2008) , Hydrological accuracy enhance-
ment via post processing of numerical weather forecasts in
complex terrain, Weather and Forecasting 23:131-144
Rasu A.G.G., T. Mahmood, Q. Zaman, S.B. Cheema, (2012), Val-
idation of APHRODITE Precipitation Data for Humid and Sub
Humid Regions of Pakistan, Pakistan Journal of Meteorology,
Vol.9, Issue 17.
Rastgu Z, Azadi M, Hojam S , (2010), Post processing WRF
model output for level 10- m wind velocity and level 2-m tem-
perature by using Palayeh nonlinear Kalman. Journal of Cli-
mate Research 1(3 and 4):93-106 (In Persian)
Shimizukawa J, Chen C Y, Iba K, (2009), Multi-regression
model for peak load forecast in demand side like university
campus, In: Proc. of the International Conference on Electrical
Engineering, 5-9 July, China
Wilks D.S., 2008, Improved Statistical Seasonal Forecasts
Using Extended Training Data, Int. J. Climatol., 28: 1589-1598.
Yasutomi N., A. Hamada, A. Yatagai, (2011), Development of a
Long-term Daily Gridded Temperature Dataset and its Appli-
cation to Rain/Snow Discrimination of Daily Precipitation,
Global Environmental Research.
Yatagai A., K. Kamiguchi, O. Arakawa, A. Hamada, N. Yasu-
tomi, A. Kitoh, (2012), Constructing a Long-Term Daily Grid-
ded Precipitation Dataset for Asia Based on a Dense Network
of Rain Gauges, American Meteorological Society.
Yukimoto S, Adachi Y, Hosaka M, Sakami T, Yoshimura H, Hira-
bara M, Tanaka TY, Shindo E, Tsujino H, Deushi M, Mizuta R,
Yabu S, Obata A, Nakano H, Koshiro T, Ose T, Kitoh A (2012) A
new global climate model of the meteorological research Insti-
tute: MRI-CGCM3-Model description and basic performance.
Journal of the Meteorological Society of Japan 90:23-64
WMO, (2006), Standardized veri cation system (SVS) for long-
range forecasts (LRF), new attachment to manual of GDPFS
(WMO-No. 485), Vol.1, Fina Report of the Joint Expert Teams
on Long-Range Forecasting, ECMWF, April 2006
Zheng, X., and Renwick J. A., (2003), a regression-based
scheme for seasonal forecasting of New Zealand temperature:
Journal of Climate, 16, 1843-1853.