
Comparison of accuracy of Epsilon and Quadratic
loss function for predicting saturated hydraulic
conductivity by SVR and SVR-GA models
Masoume Mehmandoust
1
, Jaber Soltani
2
, Mahmood Mashal
3
, Moosa Kalanaki
4
,
Rahim Sadeghifar
5
and Tohid Asadollahzade
6
1,6
Postgraduate student, Department of Irrigation and Drainage Engineering, College Of Abureyhan, University
of Tehran, Iran
2
Assistant Professor, Department of Irrigation & Drainage Engineering, College Of Abureyhan, University of
Tehran, Iran
3
Associate Professor, Department of Irrigation & Drainage Engineering, College Of Abureyhan, University of
Tehran, Iran
4
Postgraduate student, Department of Arti cial Intelligence, Rouzbahan Higher Education Institute Sari, Iran
5
Postgraduate student, Department of Irrigation and Drainage Engineering, Lecturer, Higher Education Center
of Imam Khomeini, Iran
ABSTRACT
Saturated hydraulic conductivity is one of the most effective hydraulic characteristics of the soil processes. One of the
methods to measure saturated hydraulic conductivity above water table is applying cased boreholes. Support vector
machine is a classi er which uses statistical train theory for classi cation and regression; and genetic algorithm is
a searching technique in optimization problems inspired from the nature and the evolution of the creatures. In this
research Epsilon and quadratic loss functions are compared against each other in support vector machine model
(SVR) and support vector machine-genetic algorithm model (SVR-GA). These models are developed by the core radial
function to predict the saturated hydraulic conductivity to be a suitable replacement for Reynolds analytical solutions
in cased boreholes. The data used in this study are consisting of soil moisture percentage, saturated soil moisture
percentage, the water table fall versus time, time, size of boreholes and the quantities of saturated hydraulic conduc-
tivity of the soil calculated by Reynolds solution. 70 percent of data is used for the train, 20 percent for the test and
10 percent for the validity. In order to analyze the results we have used three different statistical indicators including
correlation coef cient (R2), root mean square error (RSME), and normalized root mean square error (NRMSE). Accord-
94
ARTICLE INFORMATION:
*Corresponding Author: jsoltani@ut.ac.ir
Received 27
th
Nov, 2016
Accepted after revision 2
nd
March, 2017
BBRC Print ISSN: 0974-6455
Online ISSN: 2321-4007
Thomson Reuters ISI ESC and Crossref Indexed Journal
NAAS Journal Score 2017: 4.31 Cosmos IF : 4.006
© A Society of Science and Nature Publication, 2017. All rights
reserved.
Online Contents Available at: http//www.bbrc.in/
Biosci. Biotech. Res. Comm. Special Issue No 1:94-101 (2017)

Masoume Mehmandoust et al.
ing to the results of SVR-GA model in all three types of ow the coef cient of determination was above 0.99 and
root mean square error and mean absolute error were less than 0.02. The results of this research indicate that Epsilon
loss function had better accuracy than quadratic loss function but in terms of execution time quadratic loss function
is considerably more ef cient than Epsilon loss function.
KEY WORDS: GENETIC ALGORITHM, LOSS FUNCTION, SUPPORT VECTOR MACHINE, SATURATED HYDRAULIC CONDUCTIVITY
INTRODUCTION
Although the equations calculating hydraulic conduc-
tivity of soil which are including a variety of hydrau-
lic processes are quite accurate but they include a lot
of computational stages. On one hand adding different
aspects of processes within these equation has increased
their accuracy, but it has enhanced the computational
load as well. One of the methods to confront increas-
ing computational load is using a meta-model. In other
words developing an alternative model instead of the
main model which has learnt the relations based on
input and output can be more effective in computa-
tional ef ciency. Applying the appropriate solutions
to increase the accuracy of approximated models and
ef cient use of them can be known as alternative
meta-model management. Nowadays the topic of alter-
native model management has been known as a new
eld of research and has attracted a lot of attention
to it.
Saturated hydraulic conductivity is one of the most
effective hydraulic characteristics affecting the soil pro-
cesses (Reynolds and Topp, 2008). These parameters
play a fundamental role in controlling the hydrological
processes of underground ows (Reynolds and Elrick,
2005). In order to measure saturated hydraulic conduc-
tivity of soil different methods are available according
to the soil type and the difference between the levels
of underground water wit surface. One of the methods
of measuring hydraulic conductivity is borehole method
which in known as the falling head lined boreholes per-
meameter method (Navin et al. 2008). Philip has pre-
sented an approximately analytical solution for this type
of borehole. Philip borehole only studies vertical ows.
In the following, Reynolds studied different geome-
tries of ow and various radiuses of tanks and Philip’s
borehole as well and analyzed them. Due to the high
volume of computing in these analyses we can use an
alternative model which has been developed by arti cial
intelligence in order to predict saturated hydraulic con-
ductivity of soil. Arti cial intelligence (AI) models has
been used in a wide range of elds. AI models are quick,
robust, and convenient to use for the prediction and
solving complex problems compared with conventional
methods which impose more dif culties, time consump-
tion, and high expenses.
Shams Emamzadeh et al, (2017) in a study has com-
pared the performance of Multi-Layer Perceptron (MLP)
and Radial Basis Function (RBF) in neural networks for
estimation of the soil saturated hydraulic conductivity.
Amongst the AI models with high accuracy are support
vector machine model (SVR) and genetic algorithm- sup-
port vector machine combined model (SVR-GA). In this
study the prediction of saturated hydraulic conductivity
of soil via SVM and SVM-GA model has been calculated
using soil moisture percentage, saturated soil moisture
percentage, the water table fall versus time, time, and
size of the boreholes and the values of saturated hydrau-
lic conductivity of soil calculated by Reynolds solution
(Mehmandoust, 2014).
SVM is a collection of training techniques by the
machine which is used for classi cation and or regres-
sion and is introduced based on statistical train theory
and minimization of loss probability (Kalanaki and Sol-
tani, 2013a; Vapnic, 2010). Genetic algorithm (GA) is a
metaheuristic also one of the numerical optimization
algorithms which is inspired from the nature and is a
good option for the models use regression for prediction.
These algorithms are by relying on bio-inspired opera-
tors such as crossover, mutation and natural selection.
SVM has better ef ciency comparing neural networks
for ood probability prediction (Liong and Sivapra-
gasam, 2000). Yang Shao and Huang Yuan Fang (Yang
and Huang, 2007) used SVM model in order to predict
the parameters of hydraulic characteristics of soil and
concluded that there was no obvious difference between
the predicted results and the observed ones. Navin
Twarakawi et al (Navin et al. 2008) used SVM model to
estimate hydraulic parameters of soil, in this study all
the parameters which were estimated based on transfer
function and via SVM model showed better reliability
compared with ROSETTA PTF program.
Kalanaki et al. (2013) conducted a comparative study
about different Kernel functions and loss functions
in support vector machine using SVM_GA combined
model in order to predict the refraction rate of the pipes
in water distribution network. The ndings of this study
showed the better ef ciency of radial Kernel functions
and quadratic loss functions. Krzysztof Lamorski et al
(Lamorski et al. 2011) modelled soil water retention using
SVM with the optimized model of genetic algorithm. The
ndings of the study showed that suing SVM model with
BIOSCIENCE BIOTECHNOLOGY RESEARCH COMMUNICATIONS COMPARISON OF ACCURACY OF EPSILON AND QUADRATIC LOSS FUNCTION 95
Masoume Mehmandoust et al.
the optimized genetic algorithm for soil water retention
modelling is better than the prior tested methods. Chen
Hai Yan et al (Chen et al. 2011) used SVR-GA model to
predict aquifer hydraulic conductivity and water surface
table computation. The ndings of their study proved
that the model had performed accurate in predicting
hydraulic conductivity.
This research aims at assessing and comparing regres-
sion support vector machine and hybrid model of genetic
algorithm and regression support vector machine (SVR-
GA) by Epsilon and quadratic loss functions with the
help of the prior study’s ndings (Asadollah Zade, 2013)
which apply Reynolds and Philip methods to predict
hydraulic conductivity of soil; and also with develop-
ing an arti cial intelligence model nds an alternative
model for analytical Reynolds model which involves a
great deal of computational processes.
MATERIALS AND METHODS
One of the methods of measuring hydraulic conductivity
is using boreholes which is known as the falling-head
lined boreholes permeameter method (Philip, 1993).
The method uses cased boreholes and gives saturated
hydraulic conductivity based on the drop in levels of
water versus time. In Philip Solution, the walls of the
borehole are all covered and permeation occurs only
from the oor and vertical. In Reynolds method, the
most common and probable types of ow geometry and
various radii of tanks for permeameter of boreholes are
taken into consideration which consist of: only vertical
ow (Philip), only radial ow (permeable wall with the
length L and impermeable oor) and a combination of
vertical and radial ows where the permeable section
has the length L and the radius a. The data used in the
model were collected from 27 drilled boreholes in 1 in 1
meter grid with 3 repetitions and for three types of ow
including vertical, horizontal and vertical-horizontal
ows (radial). Plastic pipes were used to cover the walls
of the borehole and the size of the boreholes included
three diameter 4, 6 and 8 cm with different lengths (Asa-
dollah Zade, 2013).
HYDRAULIC CONDUCTIVITY
Saturated hydraulic conductivity values used in the
models are obtained from Reynolds’ approximate ana-
lytical solution. These solutions include many equations
and long computational steps which require input data
such as soil moisture percentage, saturated soil mois-
ture percentage, drop in water levels versus time, time,
borehole’s size including the borehole’s radius and the
covered length as well as uncovered length in different
considered geometries.
SUPPORT VECTOR MACHINE
Support vector machine is a collection of train meth-
ods by machine which is used for classi cation and
regression and is based on statistical train theory and
loss probability minimization (Shams Emamzadeh et
al. 2017; Vapnic, 1995; Kalanaki et al. 2013). The func-
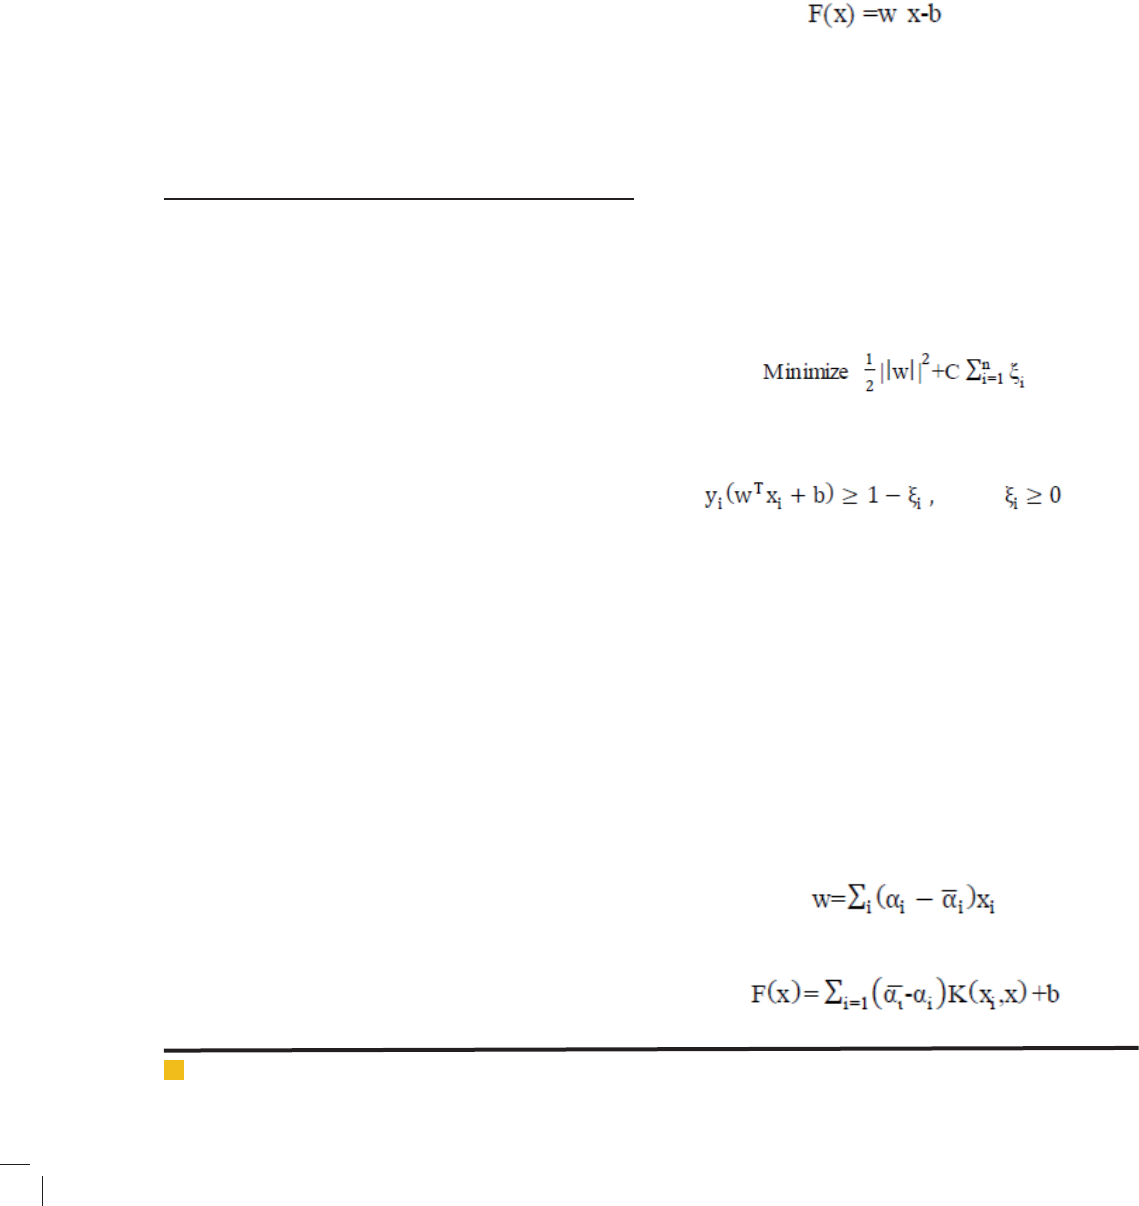
tion that is used to calculate regression support vector
machine is in the form of mapping from the input space
of Xi to output space of Yi and is represented by equa-
tion (Asadollah Zade, 2013):
(1)
Where W and b represent weight and bias respectively. In
regression support vector machine the aim is estimating
b and W in order to achieve the best results. In regression
support vector machine represents the difference between
the actual data and the results data and the variable rep-
resents an allowed extent of error that can occur by vari-
ous factors such as noise (Kalanaki et al. 2013; Smola and
Scholkopf, 1998). Margin is de ned as the ration of and
to maximize margin we should minimize. These stages are
considered in equations (2) and (3) which are the building
blocks of regression support vector machine (Simunek et
al. 2006; Lamorski et al. 2011):
(2)
Subject to:
(3)
C determines an exchange between the size of margin
and the extent of error in train and controls over- tting
in train. We use Kernel functions because working with
above functions can be costly and time-consuming. Ker-
nel function is a linear classi er based on dot product
of vectors which is equal to k Kernel function is equiva-
lent to the inner product in the feature space. There-
fore, instead of costly calculations in feature space we
apply Kernel function. Here W is obtained from equation
(Kalanaki and Soltani, 2013a). Finally, the regression
support vector machine with the effect of Kernel func-
tions is obtained from equation (Kalanaki and Soltani,
2013a):
(4)
(5)
96 COMPARISON OF ACCURACY OF EPSILON AND QUADRATIC LOSS FUNCTION BIOSCIENCE BIOTECHNOLOGY RESEARCH COMMUNICATIONS
Masoume Mehmandoust et al.
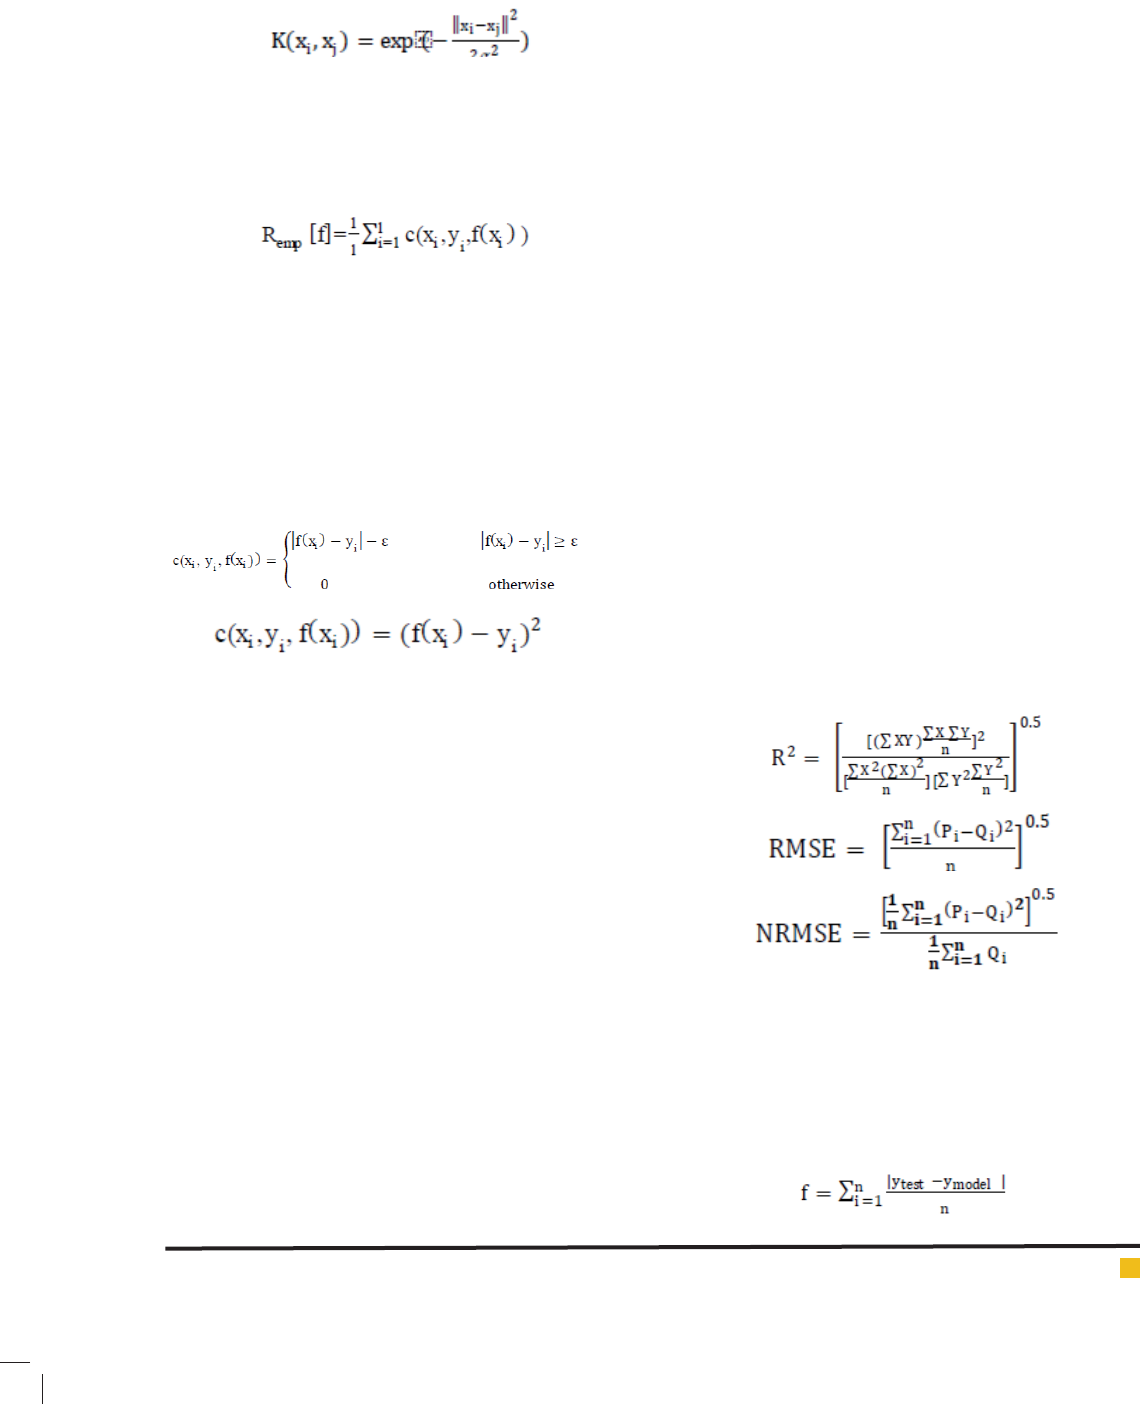
One of the most useful basis-functions is Gaussian basis
function or radial basis function (RBF) which is shown
in equation (Lamorski et al. 2011):
(6)
Where Xi and Xj are support vectors and is the band-
width of the radial basis Kernel function. To minimize
the error and other risks we aim at nding a function
which is shown in equation (Liong and Sivapragasam,
2000):
(7)
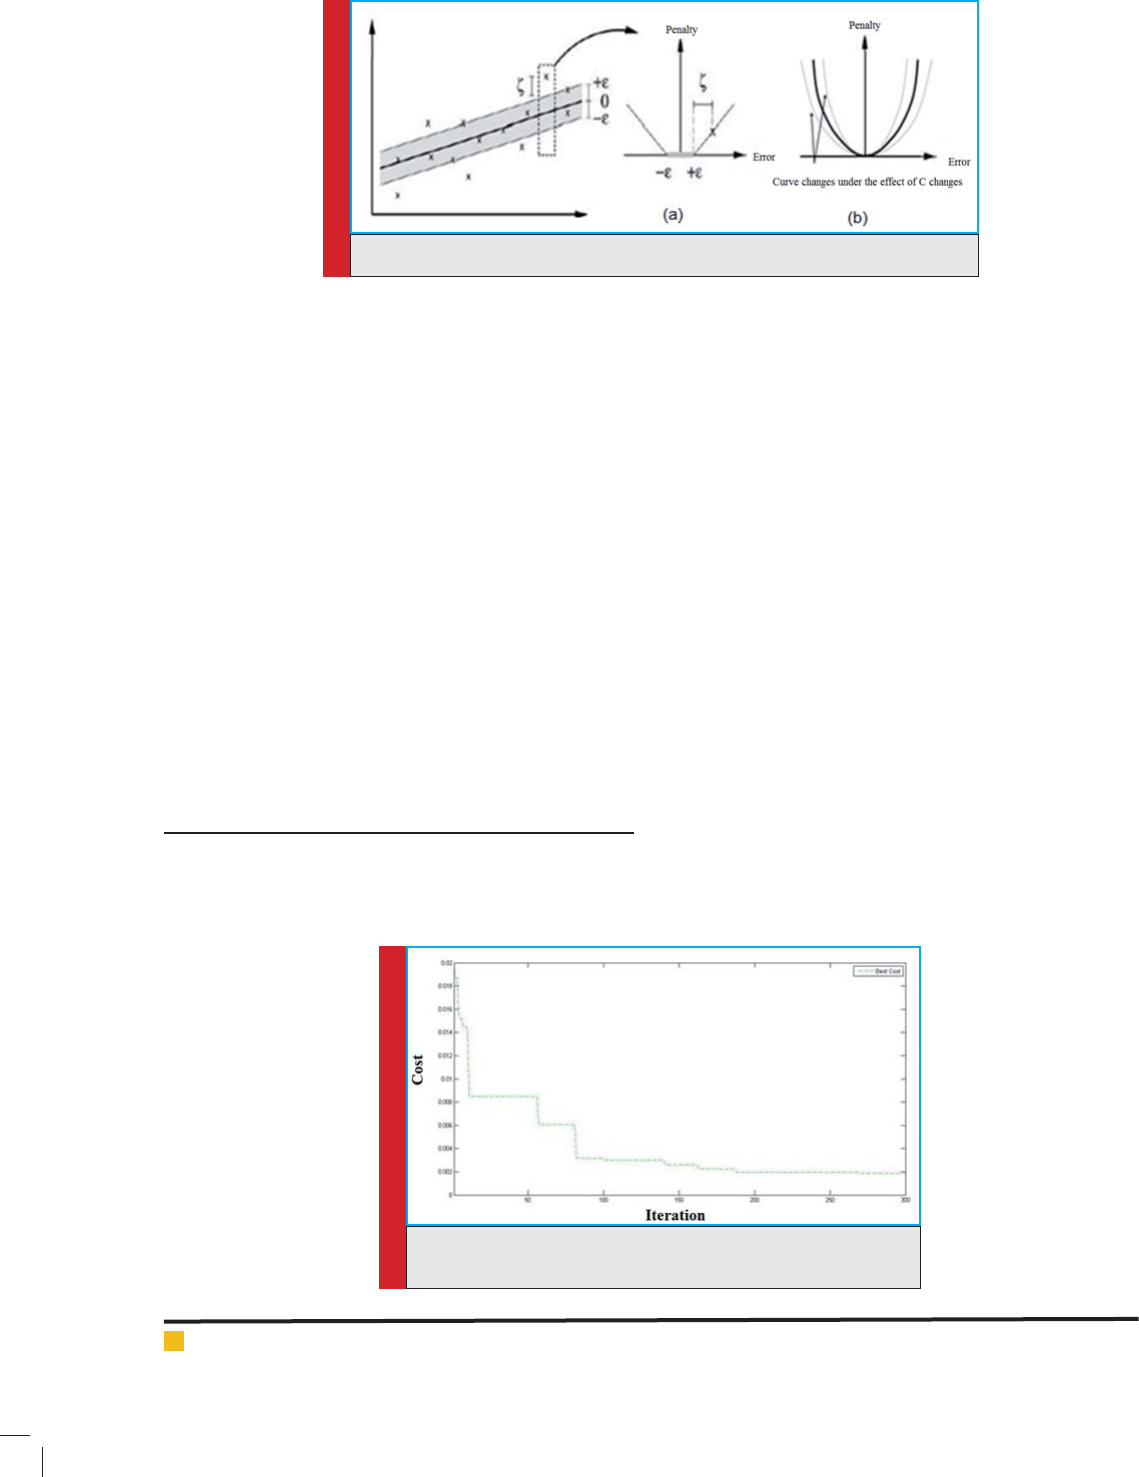
Function refers to cost function and indicates the pen-
alty for estimate function according to experimental
data. Remp represents the experimental error. Loss func-
tion determines the penalty of data while estimating. In
this study two types of loss functions are utilized which
are Epsilon loss function and quadratic loss function.
Figure (1) shows the diagrams of these functions.
The values of epsilon and quadratic loss functions are
obtained respectively by equations (8) and (9):
(8)
(9)
GENETIC ALGORITHM
Genetic algorithm was introduced by John Holland
according to evolution theory of Darwin in the early
1970s. The optimization search procedure in genetic
algorithm is based on a guided random procedure. The
procedure has been inspired from the nature and the
evolution of living creatures. In this method each mem-
ber of the population is shown through a string com-
posed of variables where each variable is called gene and
the string composed of genes is called chromosome. In
fact, initially for a number of responses which is called
population a set of objective parameters are generated
randomly. After running numerical simulator program
which represents the tness of the set of data, a tness
value will be attributed to the member of the population.
This will repeat for each and every developed member,
after calling genetic algorithm operators such as crosso-
ver, mutation and selection operators and while retain-
ing the top part of the population, the next generation
will be formed and this procedure will continue till one
of the stop conditions is satis ed. At the end, the mem-
ber of the population that has the best tness value will
be selected (Kalanaki and Soltani, 2013a; Kalanaki and
Soltani, 2013b).
MODEL DEVELOPMENT
The studies conducted in this research are carried out in
the research eld of Abureyhan campus of Tehran Uni-
versity which is located in Pakdasht. In order to develop
and run SVR model we need to adjust the parameters
c, and in the models engaging Epsilon loss func-
tion and the parameters c and must be modi ed in
the models involving quadratic loss function. In order
to nd the most suitable combination of this parameters
in SVR model, trial and error method must be used and
the combination with the least amount of error and the
highest correlation must be selected. It can be mentioned
that one of the downfalls of SVR model is nding such
a combination using trial and error method. In order to
nd the best combination GA optimization model was
applied. The model was developed and implemented for
three kinds of ows introducing input data matrixes
which were composed of the combinations of applied
variables in Richards and Van Genuchten-Maulem equa-
tions and the dimensions of the boreholes and output
matrix including the values of hydraulic conductivity
calculated by HYDRUS, Kernel and the desired loss func-
tion selection and introducing the optimal parameters
and the values of correlation coef cient, root mean
square error and normalized root mean square error
were calculated. Equations (10) to (12) show these rela-
tions respectively:
(10)
(11)
(12)
Where Pi represents the estimated or stimulated value,
Qi is the observed value and n is the number of samples.
In developing GA, the number of the initial popu-
lation was 20, the combination type was single point,
selection rate was 0.5, mutation rate was 0.25 and the
number of replications was considered 300. Equation
(13) represents the tness function in genetic algorithm.
(13)
BIOSCIENCE BIOTECHNOLOGY RESEARCH COMMUNICATIONS COMPARISON OF ACCURACY OF EPSILON AND QUADRATIC LOSS FUNCTION 97
Masoume Mehmandoust et al.
In the equation above, f represents the average of errors,
n is the number of test’s data, ytest is the experimental
values and y model is the estimated values. Genetic algo-
rithm using a variety of different parameters’ combina-
tions converges to a certain extent of error in desired
replications. In this study after normalization in order
to use Kernel function, 70 percent of data were used for
train, 20 percent for test and 10 percent for validation.
In order to write and run the codes we have used MAT-
LAB software.
The optimal parameters achieved by the hybrid model
were used in Support Vector Machine. Set of chromo-
somes make up the population. The encoding process of
each chromosome in the consolidated SVR-GA model
includes , C and. A set of chromosomes make up the
population (Kalanaki et al, 2013; Kalanaki and Sol-
tani, 2013a; Kalanaki and Soltani, 2013b; Smola and
Scholkopf, 1998; Shams Emamzadeh et al. 2017; Vapnic,
1995; Vapnic, 2010; Yang and Huang, 2007).
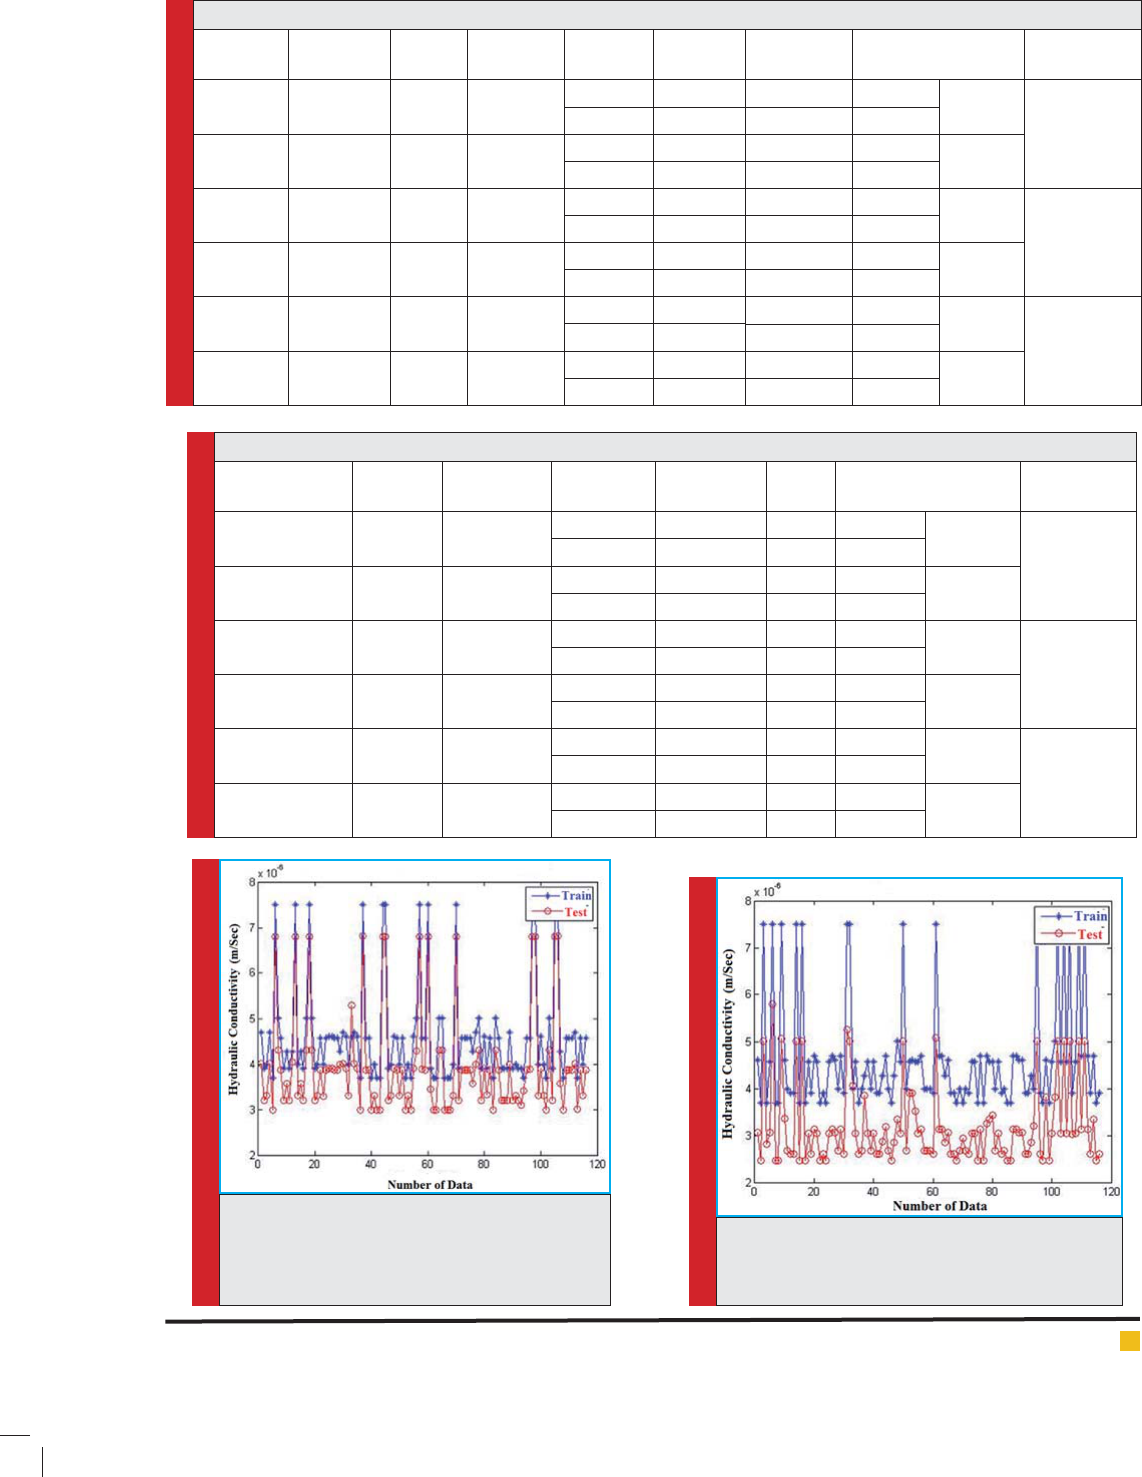
RESULTS AND D ISCUSSION
The diagram shown in gure 2 represents the conver-
gence of the objective function of genetic algorithm in a
horizontal ow at an Epsilon loss function.
The results of the SVR and SVR-GA models with
radial Kernel function at Epsilon loss functions are rep-
resented in table 1 in three different ows including
horizontal, vertical and vertical-horizontal.
The results of the SVR and SVR-GA models with
radial Kernel function for quadratic loss functions
are represented in table 2 in three different ows
including
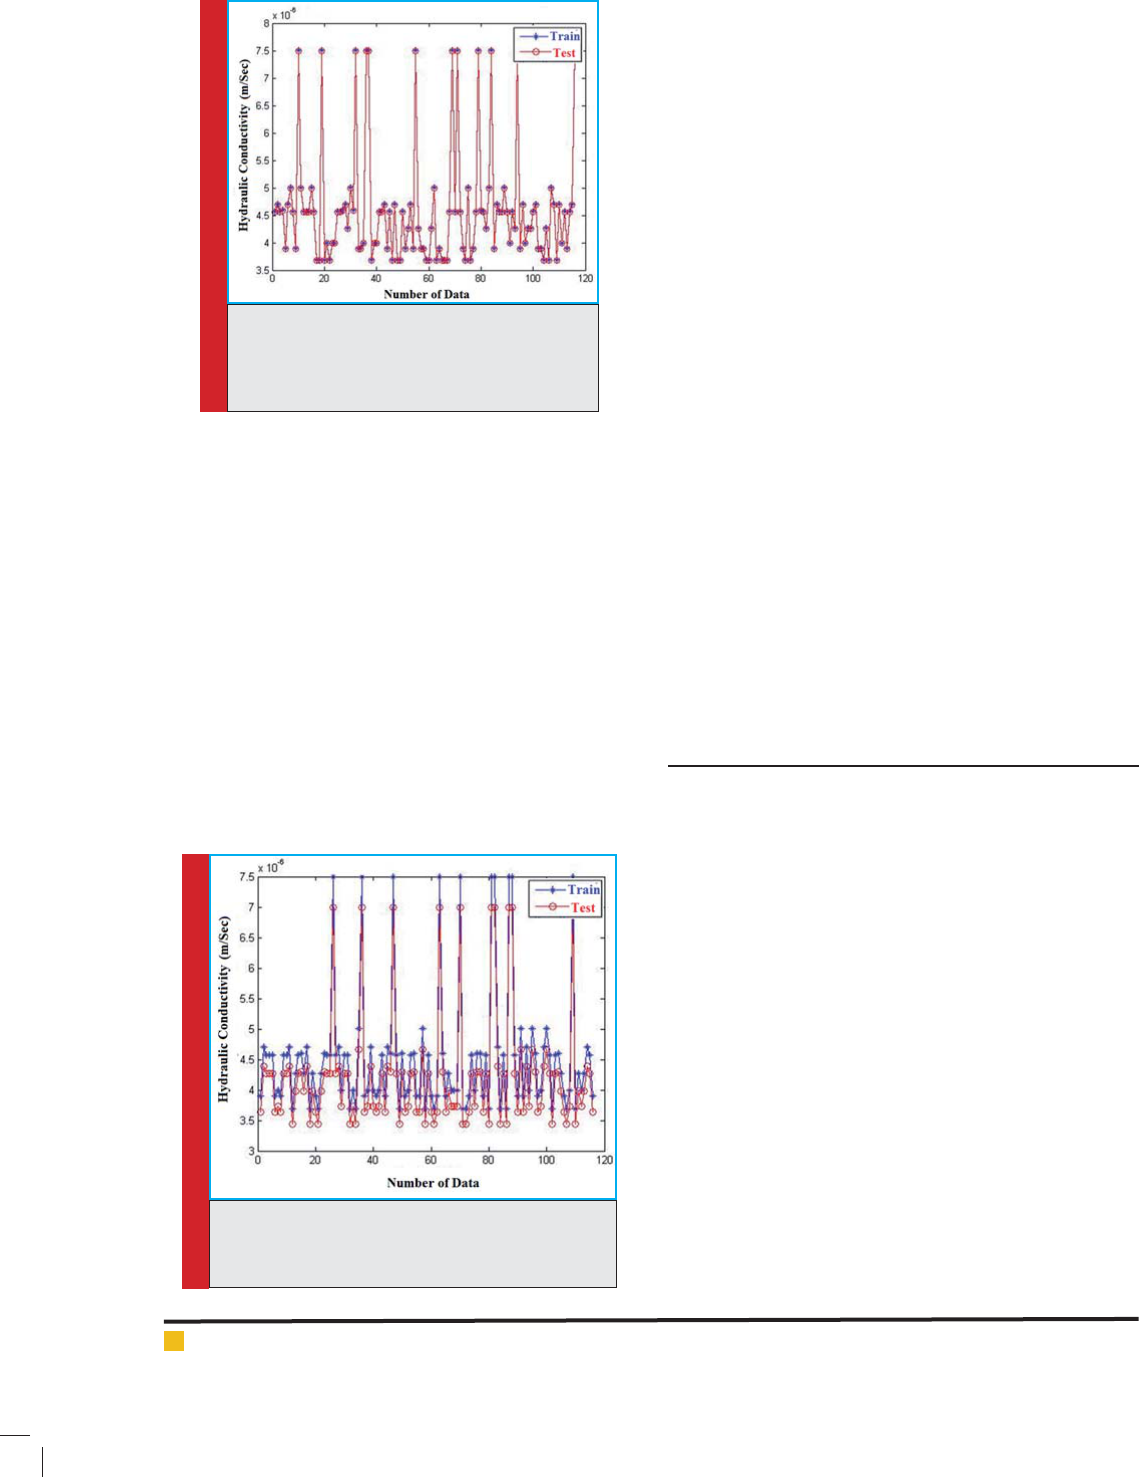
Figures 3 and 4 represent the diagrams regarding the
prediction of hydraulic conductivity by using of SVR
model with test and train data for Epsilon and quadratic
loss functions in horizontal ows respectively. The lon-
gitudinal axis shows the number data and the transverse
axis shows the values of hydraulic conductivity.
Figures 5 and 6 represent the diagrams regarding the
prediction of hydraulic conductivity by using of SVR-
GA model with train and test data for Epsilon and quad-
ratic loss functions in horizontal ows respectively. The
longitudinal axis shows the number data and the trans-
verse axis shows the values of hydraulic conductivity.
As it can be seen in table-1 SVR model has accurate
and desirable results for three different types of ows
(high correlation coef cient and low levels of error)
and SVR-GA model also has excellent results (correla-
tion coef cients close to 1 and error percentage close to
zero). In SVR model of all three different ows determi-
FIGURE 1. (a) Epsilon loss function (b) Quadratic loss function
FIGURE 2. The convergence of GA in horizontal ow at epsilon
loss function
98 COMPARISON OF ACCURACY OF EPSILON AND QUADRATIC LOSS FUNCTION BIOSCIENCE BIOTECHNOLOGY RESEARCH COMMUNICATIONS
Masoume Mehmandoust et al.
Table 1. The results of SVR and SVR-GA for epsilon loss function
Flow typeModel typeR2 (%)
RMSE
(m.s-1)
NRMSE
c
Run-time
(seconds)
Horizontal
ow
SVR
prediction9786219/009244/019474/0
0004/0700000019/097922
validity9591991/013031/019018/0
SVR-GA
prediction9999973/000089/000175/0
00021049/05665/7200000791/093021
validity9999955/000117/000169/0
Horizontal-
vertical ow
SVR
prediction9897919/006601/015938/0
0004/090000004/092131
validity9780319/009329/017917/0
SVR-GA
prediction9999997/000033/000292/0
00001433/01760/4800003758/090456
validity9999998/000025/000173/0
Vertical ow
SVR
prediction9492773/011536/016723/0
00003/01100007/0103985
validity9356536/012313/016578/0
SVR-GA
prediction9994702/000995/001309/0
00001598/05493/4000002245/094783
validity9991326/001095/001271/0
Table 2. The results of SVR and SVR-GA for quadratic loss function
Flow typeModel type
R2
(%)
RMSE
(m.s-1)
NRMSE
c
Run-time
(seconds)
Horizontal
ow
SVR
prediction9248/019230/045416/0
0007/03029217
validity9269/019246/046718/0
SVR-GA
prediction9973/003494/007426/0
00029126/03766/15523699
validity9989/002133/006967/0
Horizontal-
vertical ow
SVR
prediction9462/017164/039274/0
00075/08527660
validity9424/018326/034866/0
SVR-GA
prediction9991/002105/005838/0
00021562/01387/13221518
validity9985/002385/008277/0
Vertical ow
SVR
prediction8506/019525/027422/0
0005/016032223
validity8459/016398/026374/0
SVR-GA
prediction9782/006917/009189/0
00004794/09392/24628416
validity9977/002049/008563/0
FIGURE 3. The prediction of hydraulic conduc-
tivity with test and train data by using of SVR
model, with epsilon loss function in horizontal
ow
FIGURE 4. The prediction of hydraulic conductivity
with test and train data by using of SVR model,
with quadratic loss function in horizontal ow
BIOSCIENCE BIOTECHNOLOGY RESEARCH COMMUNICATIONS COMPARISON OF ACCURACY OF EPSILON AND QUADRATIC LOSS FUNCTION 99
Masoume Mehmandoust et al.
nation coef cient is above 0.93 and root mean square
error and mean absolute error are less than 0.2; in the
event that SVR-GA model of all the ows determination
coef cient is more than 0.99 and root mean square error
and mean absolute error is less than 0.02. Thus, hybrid
model with epsilon loss function is apparently more ef -
cient. This superiority is shown in Figure 5.
According to the results seen in table 2 for SVR model
does not contain good results for quadratic loss function
but SVR-GA model shows very desirable results. In SVR
model for all three ows, determination coef cient is
more than 0.84 and root mean square error and mean
absolute error are less than 0.47; in SVR-GA model for
all three ows determination coef cient is above 0.97
FIGURE 5. The prediction of hydraulic con-
ductivity with test and train data by using of
SVR-GA model, with epsilon loss function in
horizontal ow
FIGURE 6. The prediction of hydraulic conductivity
with test and train data by using of SVR-GA model,
with quadratic loss function in horizontal ow
and root means square error and mean absolute error
are below 0.1. Therefore, hybrid model is much more
ef cient as it can be observed. The results obtained from
epsilon loss function are more accurate as compared
to the results gained from quadratic loss function. The
results are demonstrated graphically in gure 6. In both
models the results obtained from epsilon loss function
were more precise. This procedure is obvious in diagram
3 to 6. But the considerable point is the execution time
for epsilon loss function in both models is quite insig-
ni cant. According to the ndings it can be declared
that model hybrid model with epsilon loss function
is an appropriate alternative for analytical Reynolds
solutions.
Eventually, Results show that epsilon function accu-
racy is better than the quadratic function, but in terms of
run time, quadratic function is superior to epsilon func-
tion signi cantly. Results show that accuracy of epsilon
function is better than the quadratic function. Hybrid
model with the epsilon loss function is superior. For
quadratic loss function, the results of SVR model are not
acceptable but SVR-GA model have a very good results.
According to the results, we can say that a hybrid model
with epsilon loss function very good alternative for the
Reynolds analytical solution. The results of epsilon loss
function in both models have higher accuracy in com-
parison with the quadratic loss function, but in terms of
run time, quadratic function is superior to epsilon func-
tion signi cantly.
ACKNOWLEDGEMENTS
This article is extracted from the thesis of Masoume
Mehmandoust, University of Tehran. The authors appre-
ciate from University of Tehran for their support.
REFERENCES
Asadollah Zade, T., (2013): Measurement of saturated hydrau-
lic conductivity and absorption number with methods of bore-
hole permeameter and assessment of this methods by Hydrus
2D model, master thesis, Irrigation and drainage engineering,
College of Abouraihan, Tehran university, 129 pages, in Per-
sian with English abstract.
Chen, H. and Y.Teng and J. WANG, (2011): Method of estima-
tion of hydraulic conductivity with genetic algorithm-support
vector regression machine. China Academic Journal Electronic
Publishing House. 5 pages.
Kalanaki, M. and J. Soltani, (2013a): Performance assessment
among hybrid algorithms in tuning SVR parameters to predict
pipe failure rates, Advances in Computer Science: an Interna-
tional Journal, Vol. 2, Issue 5, 7 pages.
Kalanaki, M. and J. Soltani, (2013b): Simulation and Perfor-
mance Assessment between hybrid algorithms SVR-CACO and
100 COMPARISON OF ACCURACY OF EPSILON AND QUADRATIC LOSS FUNCTION BIOSCIENCE BIOTECHNOLOGY RESEARCH COMMUNICATIONS

Masoume Mehmandoust et al.
SVR-CGA to more accurate predicting of the pipe failure rates.
Journal of Novel Applied Sciences, 2(S3): 1054-1063, 10 pages.
Kalanaki, M., j. Soltani and S. Tavassoli, (2013): Management
of urban water infrastructure systems by prediction of rate of
pipe failure by using of SVR-CGA hybrid model, Twelfth Con-
ference of hydraulic of Iran, 8 pages, in Persian with English
abstract.
Lamorski, K., C. Sławin
´
ski, F. Moreno, G. Barna, W. Skierucha
and J. L. Arrue, (2011): Modelling soil water retention using
Support Vector Machines with genetic algorithm optimization,
The Scienti c World Journal, Volume2014(2014), 10 pages.
Liong, S.Y., and C. Sivapragasam. (2000): Flood stage forecast-
ing with SVM. J. Am. Water Resour. Assoc. 13 pages.
Mehmandoust, M., (2014): Evaluation of saturated hydraulic
conductivity prediction using a hybrid model of genetic algo-
rithm and support vector machine. Msc. Thesis, Department of
Irrigation and Drainage Engineering, Collage of Abouraihan,
University ofTehran.
Navin K. C. Twarakavi, J Simunek and M. G. Schaap, (2008):
Development of Pedotransfer Functions for Estimation of Soil
Hydraulic Parameters using Support Vector Machines. Soil Sci-
ence Society of America, 10 pages.
Philip, J.R. (1993): Approximate analysis of falling-head lined
borehole permeameter. Water Resour. Res. 29:3763–3768.
Reynolds, W.D., and D.E. Elrick. (2005): Measurement and
characterizati on of soil hydraulic properti es. p. 197–252
Reynolds, W.D., and G.C. Topp. (2008): Soil water analyses:
Principles and parameters. p. 913–939.
Shams Emamzadeh E.S., Soltani, J., Mashal, M., Kalanaki, M.,
and Asadolahzadeh, T., (2017): Performance Evaluation of
MLP and RBF Neural Networks to Estimate the Soil Saturated
Hydraulic Conductivity. Modern Applied Science; Vol. 11,
No. 3.
Simunek J., Sejna M., and Van Genuchten M.Th. (2006): The
HYDRUS software package for simulating two-and three-
dimensional movement of water, heat, and multiple solute in
variably-saturated media, Technical Manual, Version 1.11, PC
progress prague, Czech Republic.
Smola, A., Scholkopf, B. (1998): A tutorial on Support Vector
Regression. J. Statistics and Computing. 199 -222, 14 pages.
Vapnic, V. N., (1995): The Nature of Statistical Learning The-
ory. Springer Verlag, New York, USA.
Vapnic, V. N., (2010): The Nature of Statistical Learning Theory.
Springer Verlag, New York, USA.
Yang, S. and Y. Huang, (2007): Prediction of soil hydraulic
characteristic parameters based on support vector machine,
Chinese Society of Agricultural Engineering.
BIOSCIENCE BIOTECHNOLOGY RESEARCH COMMUNICATIONS COMPARISON OF ACCURACY OF EPSILON AND QUADRATIC LOSS FUNCTION 101