
Statistical evaluation of chemical and biological
contamination in Yamchi Dam basin water
Romina Rasuli Asl and Hossein Saadati*
Department of Natural Resourses, Ardabil Branch, Islamic Azad University, Ardabil, Iran
ABSTRACT
Rivers are the most vulnerable water resources due to carry urban and industrial wastewater and agricultural wastes.
In this study, the trend of changes of water quality of main branches of Yamchi Dam and water of dam reservoir dur-
ing the time series were evaluated according to the Spatiality changes and the most sensitive branch was identi ed
due to produce contamination as well as the time and location of changes (amounts) of water quality parameters to
Yamchi Dam were evaluated. According to the statistical results in 2001 to 2015 related to the stations studied, it can
be concluded that Nir River among all the variables studied is as the most pollutant river from the three main riv-
ers of the upstream region of Yamchi Dam. According to the results, the river’s water quality parameters from 2001
onwards has been increasing process, variables of fecal coliform, bicarbonate, DO, BOD and sodium respectively, as
main factors have the greatest impact on water quality survey of the main branches of Yamchi Dam. Three main
branches of Yamchi Dam are different in terms of rate and amount of variables mentioned and have had signi cant
effect on water quality of Yamchi Dam. Variables studied except DO in all stations are considered pollutant in terms
of the drinking water standard
KEY WORDS: YAMCHI DAM, WATER QUALITY, STATISTICAL INDICATORS
87
ARTICLE INFORMATION:
*Corresponding Author: Ah.saadati@iauardabil.ac.ir
Received 27
th
Nov, 2016
Accepted after revision 20
th
March, 2017
BBRC Print ISSN: 0974-6455
Online ISSN: 2321-4007
Thomson Reuters ISI ESC and Crossref Indexed Journal
NAAS Journal Score 2017: 4.31 Cosmos IF : 4.006
© A Society of Science and Nature Publication, 2017. All rights
reserved.
Online Contents Available at: http//www.bbrc.in/
INTRODUCTION
Today, surface water quality is one of the major concerns
and considers a health index for community (Charu and
Verma, 2008). Data that describes temporal and spa-
tial variations of water quality in river can be used to
identify the relative importance of natural and human
effects (Ramazani and Hashemi, 2011). Over the past
decade, monitoring the water quality of the river has
increased by measuring water quality parameters (Bu
et al, 2010). Therefore, evaluating water quality is very
important because it directly affects public health and
life of aquatic ecosystem (Dixon and Chysol, 1996). P.
et al (2009) used multivariate regression analysis includ-
ing principal component analysis (PCA) and cluster (CA)
to study the spatial and seasonal variations of surface
Biosci. Biotech. Res. Comm. Special Issue No 1:87-93 (2017)
88 STATISTICAL EVALUATION OF CHEMICAL AND BIOLOGICAL CONTAMINATION BIOSCIENCE BIOTECHNOLOGY RESEARCH COMMUNICATIONS
Romina Rasuli Asl and Hossein Saadati
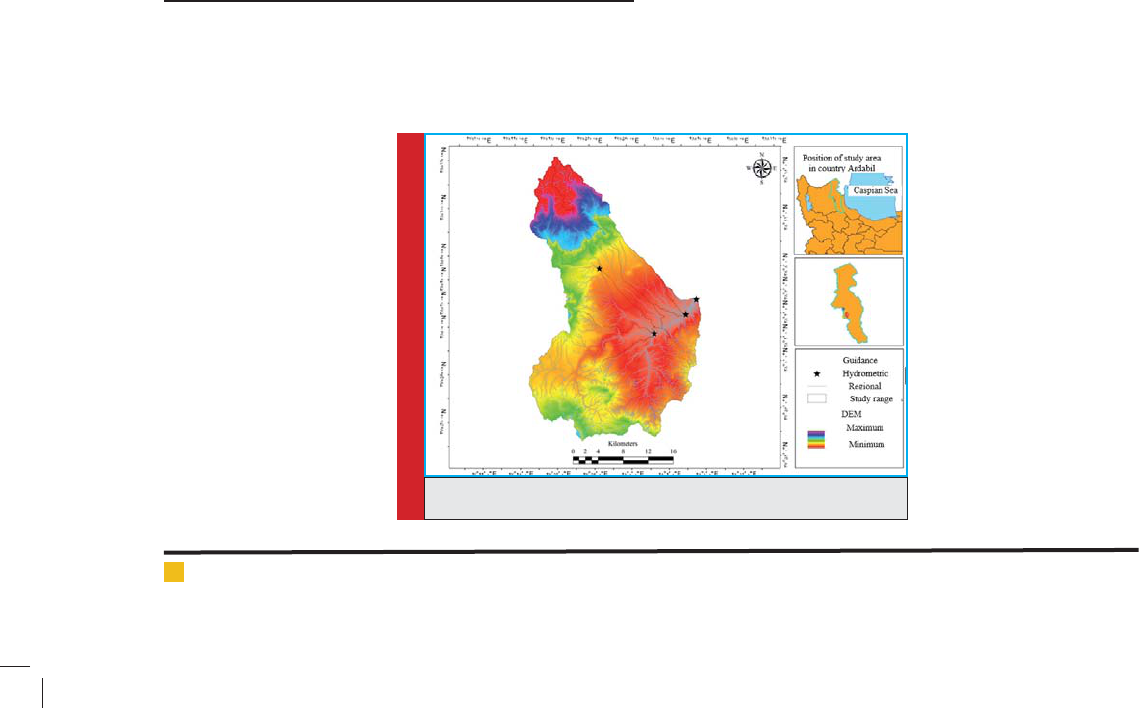
FIGURE 1. Position of the study area
water quality of Haraz Watershed in Iran (during the
summer and fall 2007 and winter and spring 2008). To
assess the temporal and spatial variations of water of
Jajrud River in Iran, they investigated water samplesin
a three-year period for each month in the 18 stations
with PCA and CA statistical analysis. CA and PCA led to
similar results, box plots show that PCA can show the
temporal and spatial variations approximately (Razm-
khah et al 2010 ).
Vega and colleagues in evaluating the seasonal
changes and pollutants effects of river water quality of
Pisuerga Spain using statistical analysis investigated var-
iables of physicochemical of water during 2.5 years from
3 stations. The PCA showed that the mineral amount,
human pollution and the temperature has dropped.
(Bardvaj et al 2010) In investigating water quality of Kali
Gandaki River in India using PCA, they analyzed factors
such as shelves, poor drainage, ion exchange, intensity
of use of nutrients and household pollutions. The results
of this study showed that in some areas, due to increase
of alkalinity, water becomes hard and is not suitable for
drinking and irrigation purposes. To assess water qual-
ity of upstream basin of Yamchi Dam, rst the quality
parameters related to the main branch of Nir, Lai and
Jurab were collected from the Department of environ-
ment and regional water organization of Ardabil prov-
ince from 2001-2002 to 2014-2015 which contains con-
centrations of salts (TDS), acidity (pH), dissolved oxygen
(DO), biological oxygen demand (BOD), chemical oxygen
demand (COD) and total hardness (TH).
MATERIAL AND METHODS
THE STUDY AREA
Yamchi Dam basin with area of 709.18 square kilom-
eters is placed in the geographic area 28” 46’ 47 º to
57” 05’ 48 º east longitude and 24” 01’ 38 º to 15” 09’
38 º north that limits from north with Meshkinshahr,
from North-East with Ardebil, from west and south to
Eastern Azarbaijan and from southeast to the basin of
Ghuri Chay. Yamchi Dam main branches included Nir-
chay, Laichay and Lamchay that after connecting to
each other make a great river that is called up Balqe-
lychay that is one of the important branches of Aras
River in the North West of Iran that ows in South North
and collects the waters of the main branches of Yam-
chi Dam from East and South of the area. YamchiDam
main branches because of owing from important resi-
dential areas such as Nir and villages in the region and
also placing some industrial and resort centers near the
river and because of the drinking and agriculture water
supply of area is one of the major dams of Azerbaijan
region.On the other hand, the area because of the rul-
ing of the above conditions and serious threats caused
by wastewater of industry and domestic sewage is con-
stantly threatened by pollution. Therefore, such a situa-
tion increases the vulnerability of the study area to the
issue of pollution. Figure 1 shows Yamchi Dam position
in the North West of Iran, West of Ardebil and also the
position of hydrometric stations studied.
RESEARCH METHODOLOGY
Compliance with statistical principles to prevent from
wasting time and increasing the accuracy, rst the
variables studied were minimized. Since the number
of parameters mentioned above is large and it is not
possible to check all of them in the form of a master's
thesis therefore, it was acted to minimize the variables
using principal component analysis (PCA). After deter-
mining the main variables of all three stations (Nir,
Lai and Jurab) by adopting a common statistical base,
shared variables were selected from three stations. After
BIOSCIENCE BIOTECHNOLOGY RESEARCH COMMUNICATIONS STATISTICAL EVALUATION OF CHEMICAL AND BIOLOGICAL CONTAMINATION 89
Romina Rasuli Asl and Hossein Saadati
selecting the common parameters at the later stage, it
was acted to group comparisons based on common vari-
ables. So that it was acted to investigate the presence or
absence of signi cant difference between the three main
branches of Yamchi Dam ie Nir, Lai and Jurab using mul-
tivariate analysis of variance, at this stage the presence
or absence of difference between the three stations is
determined. After this stage, it was acted to group aver-
ages of the variables among three stations and it became
clear which of the variables of these three groups are
different. In the next step, it was acted to compare the
amount of shared variables with standard value using
One Sample T-test; the purpose of this step is to identify
the most polluted river of the main branches of Yam-
chi Dam. In this study, a sample T-test hypotheses are:
1. The null hypothesis: The value of investigated vari-
ables is in permitted range. 2. Hypothesis: The value of
investigated variables is not in permitted range. Finally,
to determine the trend of changes of data and identify
the type and time of it, it was acted to analyze the trend
of time series using Mann-Kendall non-parametric test,
and the presence or absence of changes was speci ed.
Kolmogorov-Smirnov test was used to assess the
normality of variables. Determining the appropriateness
of data was performed using the KMO index and
Bartlett test, in components analysis, maximum equity
(Eigenvalue) belongs to the rst component (Pc1) and
gradually by increasing class of components, this
amount decreases. It should be noted in this method, each
component is independent of other components (Yao et
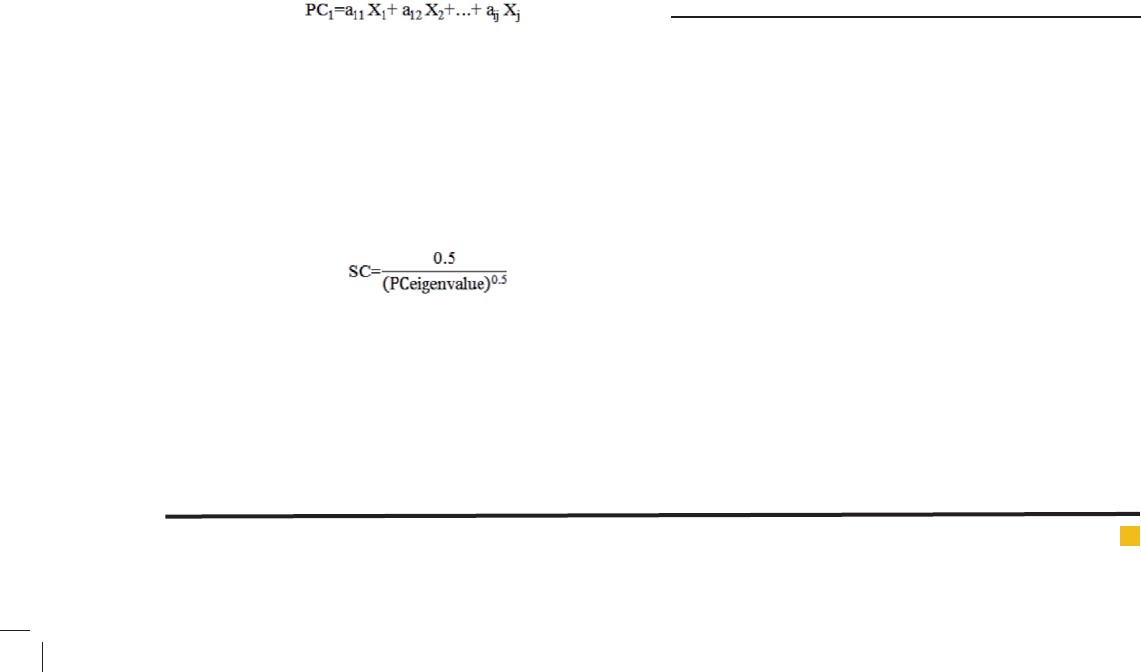
al., 2013). Each component is a linear combination of
variables that its equation can be shown as equation 3-1
(Jolliffe, 1986).
In this equation, PC is the main component, is the coef-
cient or special vector (Eigen Vector) and is variable
considered (Jolliffe, 1986). In order to select the number
of effective components, components were selected that
their Eigenvalue was more than one. To interpret the
effective features in a component that controls the most
changes, selection criteria was used (Doran and Parkin,
1994).
In this equation, SC is selection criteria, PC is the main
component and Eigenvalue is the special value (Doran
and Parkin, 1994). After identifying the most in uen-
tial variables in each station by considering the common
base among the main station variables, variables that
were present in all three stations were selected as the
major variables in qualitative studies of upstream water
of Yamchi Dam. All statistical analyzes were conducted
in SPSS v.20 software.
In this study, the method of multivariate analysis of
variance was used to investigate the signi cant differ-
ence between the variables of factor analysis (including
ve variables of bicarbonate, sodium, DO, BOD and fecal
coliform) in three main branches of Yamchi Dam (Nir,
Lai and Jurab).
Among the groups after the signi cant difference
among the main branches of Yamchi Dam was approved
then, using Duncan method from grouping methods of
averages, it was acted to identify the different variables
in the three branches.
In order to understand the trend of changes of data
and identify the type and time of it, it was acted to
analyze the time series using the Mann-Kendall non-
parametric test and the presence or absence of changes
was speci ed. In this study, the graphical method of
Mann - Kendall test was used. About the graphical
method, mentioning points about the statistic U and U
‘is necessary. If the sequence U and U ‘ based on i is
drawn as a graph, in the signi cance mode of the trend,
two graphs at the starting point of phenomena outside
the scope intersect each other and will move in opposite
direction of each other, this point of collision is called
mutation. While if there isn’t trend, two sequences U and
U ‘move almost in parallel or will act in several times of
collision, so that does not lead to change direction. U
graph to the year (axis X) is drawn and for that signi -
cance of trend and point of its mutation to be achieved,
the sequence U ‘is de ned.
RESULTS AND DISCUSSION
Principal components analysis (PCA) was used in
order to determine the minimum effective variables in
investigating qualitative changes of upstream water of
Yamchi Dam (main branches of Nir, Lay and Jurabchay).
First KMO factor was used in determining the suitability
of the data for principal components analysis to achieve
this goal. The value of this factor is always variable
between zero and one. If the value of this ratio is less
than 0.5, the data will not be suitable for factor analysis
and if its value is between 0.5 to 0.69, it can be analyzed
main components more carefully. If KMO coef cient is
larger than 0.7, principal components analysis in the
decrease of data will be effective (Jolliffe, 1986). As well
as to ensure correlation between input variables or inde-
pendent, Bartlett’s test was used. Based on the results,
KMO coef cients in three main branches of Nir, Lai and
Jurabchay was obtained 0.769, 0.782 and 0.724 respec-
tively that the amount con rms the correlation between
input variables for principal components analysis. Bar-
Romina Rasuli Asl and Hossein Saadati
90 STATISTICAL EVALUATION OF CHEMICAL AND BIOLOGICAL CONTAMINATION BIOSCIENCE BIOTECHNOLOGY RESEARCH COMMUNICATIONS
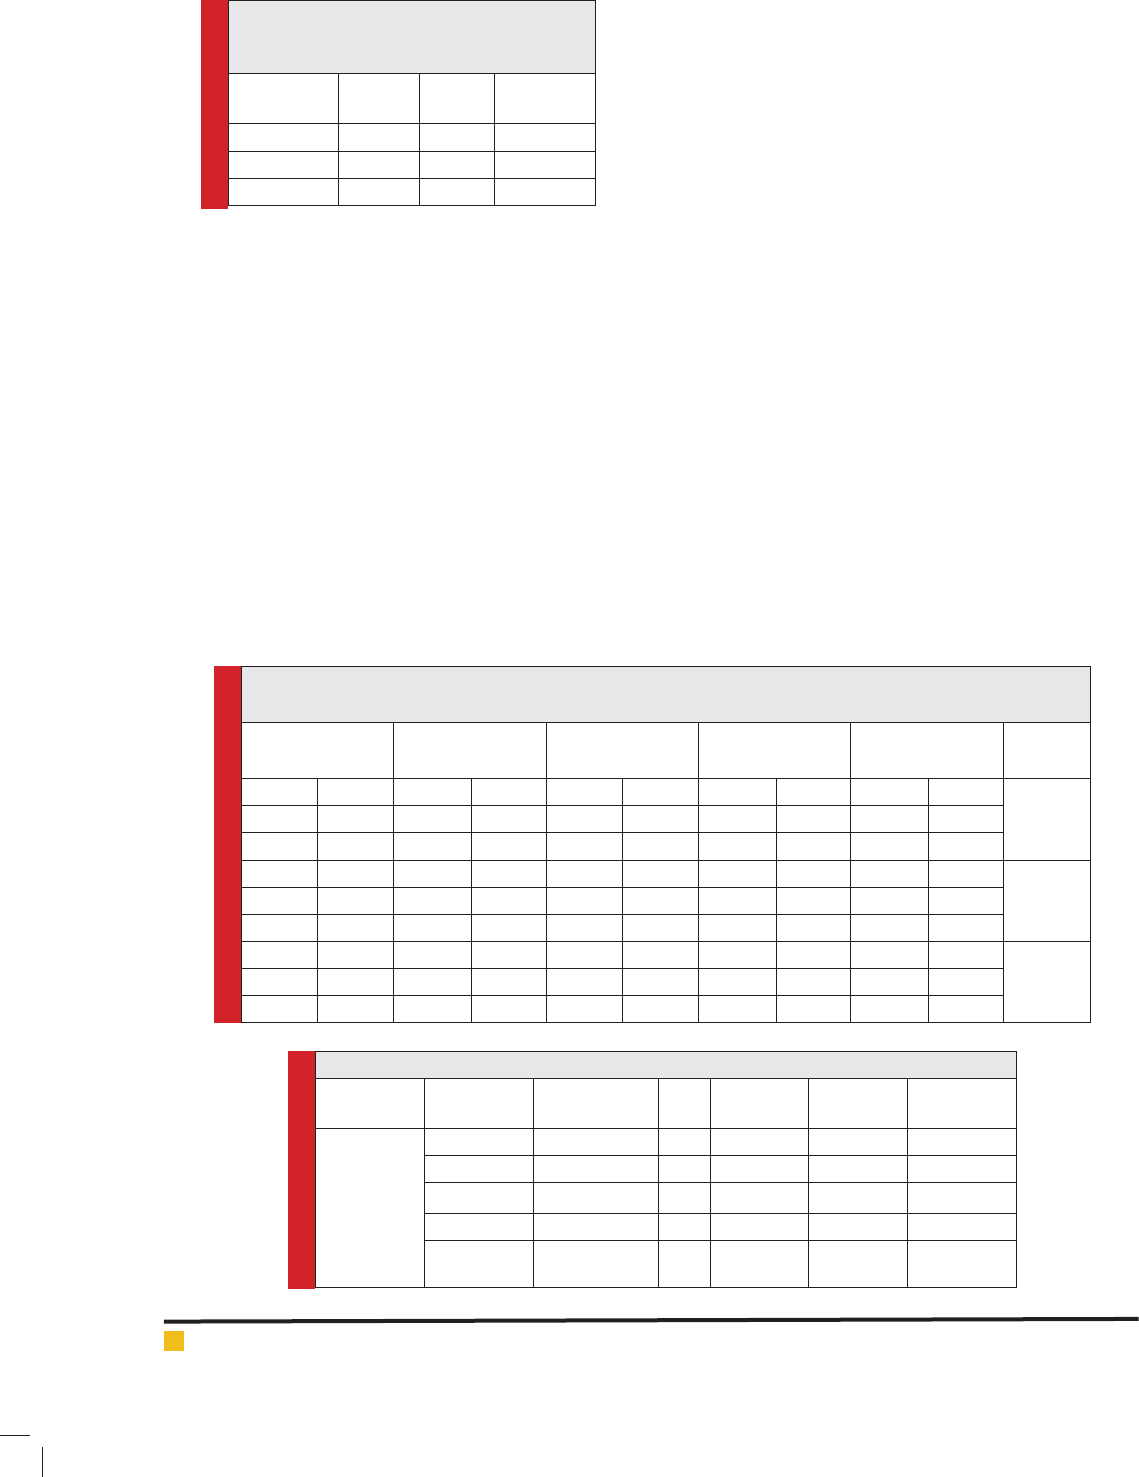
Table 1. Investigate KMO and Bartlett tests to
detect changes in upstream water quality of
Yamchi Dam
Station
Test
KMO
Bartlett
test
Signi cant
level
Nir0.76986.7740.000
Lai0.78289.3450.000
Jurab bridge0.72482.7610.000
Table 2. Number of main components,: EV (Eigenvalue),: SC (selection index) and: Cu (cumulative variance)
in assessing the changes of water quality of the main branches of Yamchi Dam
Station
First main
component
Second main
component
Third main
component
Fourth main
component
Fifth main
component
Nir
EV8.746EV6.898EV2.538EV2.017EV-
SC0.169SC0.19SC0.313SC0.352SC-
Cu41.648Cu74.495Cu6.581Cu96.184Cu-
Lai
EV6.967EV5.365EV4.33EV2.109EV1.228
SC0.189SC0.215SC0.24SC0.344SC0.451
Cu34.837Cu61.664Cu83.313Cu93.358Cu100
Jurab
EV11.078EV3.702EV2.314EV1.966EV-
SC0.15SC0.259SC0.328SC0.356SC-
Cu55.391Cu77.901Cu85.473Cu95.304Cu-
Table 3. The results of multivariate analysis of variance
Source
Dependent
Variable
Type III Sum
of Square
df Mean
Square
F Sig.
Three froups
of Nir, Lai,
Jurab
Bicarbonate 59233.637 2 29616.818 180.443 .000
Sodium 1921.608 2 960.804 69.644 .000
DO 1.264 2 4.632 1.509 .000
BOD 5.621 2 2.810 8.002 .000
Fecal
coliform
5411.641 2 2705.820 4.072 .000
tlett’s test was signi cant for all three rivers in 0.01 so
the data are suitable for PCA.
The main components analysis was used to assess
the water quality changes of main branches of Yamchi
Dam. Therefore, variables that at least one of the coef-
cients of them is used to form the component have
relatively high amount. According to Table 2, Nir, Lai
and Jurab stations had 4, 5 and 4 main components and
in total according to the considered criteria, it was speci-
ed among 10 variables, Nir, Lai and Jurab stations have
respectively 9, 3 and 5 main variable. Because of the
variety in number and type of main variables in each
station, considering common base between main vari-
ables related to each of the three stations, three variable
of DO, BOD and fecal coliform were selected as the main
variables (effective factors). So the variables of fecal
coliform and DO and BOD as the main factors have the
greatest impact and other variables have the least impact
in investigating water quality of the main branches of
Yamchi Dam.
According to the results of analysis of variance,
there is a signi cant difference between the three main
branches. Values Sig. that for stations studied is less than
0.05, and then by 95% con dence level, there is a sig-
ni cant difference between the main branches of Yam-
chi Dam based on ve variables (bicarbonate, sodium,
DO, BOD and fecal coliform). In other words, three main
branches of Yamchi Dam in terms of amount of vari-
ables mentioned are different with each other and have
signi cant effect on water quality of Yamchi Dam.
It was speci ed in the results of multivariate analysis
of variance that there is a signi cant difference between
three main branches, but it is not clear which of the
variables (bicarbonate, sodium, DO, BOD and fecal coli-
form) are different. Comparisons of the average of vari-
ables in groups surveyed by Duncan method showed
bicarbonate amount in rivers of all three with Sig. equal
one in each three main branches are different, sodium
amount among two branches of Nir and Jurab with Sig.
equal to 0.763, there is no signi cant difference but the
amount of sodium in the Lai branch with sodium in two
branches of Nir and Jurab is quite different. The number
of fecal coliform in the water of branches of Lai and
Jurab is very similar but the number of fecal coliform
Romina Rasuli Asl and Hossein Saadati
BIOSCIENCE BIOTECHNOLOGY RESEARCH COMMUNICATIONS STATISTICAL EVALUATION OF CHEMICAL AND BIOLOGICAL CONTAMINATION 91
in Nir branch is different with two other branches (Table
4).The amount of BOD in water, branches of Lai and
Jurab not have much difference with each other but the
amount of this variable in Nir branch is very different
from the other two branches. DO variable situation is
similar to variable BOD.
According to the results of a sample t test, the
signi cance level (Sig) is larger than 0.05, then, the null
hypothesis is con rmed with con dence of 95 percent.
As the value of Sig of one sample t-test in all parameters
except DO is less than 0.05 so the variables considered
in all stations except DO in terms of the standard of the
drinking water are considered pollutant. DO variable in
two stations of Lai and Jurab is equal to the threshold
of pollution and is not considered statistically pollutant.
According to the results of Mann - Kendall non-par-
ametric test, all stations follow the process of changing
the station of Nir that is why only the results of Station
Nir is provided. In the graph of the annual average DO
of station, a signi cant mutation with positive trend in
Table 4. A sample t test results with constant value of main three branches variables
One-Sample Test
Station
Common
variables
T
Degree of
freedom
Sig.
Difference
of average
Con dence level 95%
Less More
Nir
Sodium -98.84 8 0.000 -175.11 -179.2 -171.03
bicarbonate -14.31 8 0.000 -84.46 -98.07 -70.85
fecal coliform 4.8 8 0.000 47.61 24.75 70.47
DO -3.05 8 0.02 -0.46 -0.81 -0.11
BOD -51.93 8 0.000 -12.67 -13.24 -12.11
Lai
Sodium -2618.4 8 0.000 -193.26 -193.4 -193.09
bicarbonate -132.2 8 0.000 -155.68 -158.4 -152.9
fecal coliform 3.907 8 0.05 24.39 9.9 38.7
DO 0.206 8 0.862 0.056 -0.568 0.68
BOD -69.4 8 0.000 -13.015 -13.447 -12.582
Jurab
Sodium -145.6 8 0.000 -175.64 -178.4 -172.8
bicarbonate -9.809 8 0.000 -42.18 -52.097 -32.26
fecal coliform 6.353 8 0.000 58.31 37.146 79.48
DO -0.467 8 0.653 -0.098 -0.579 0.384
BOD -79.762 8 0.000 -11.92 -12.267 -11.57
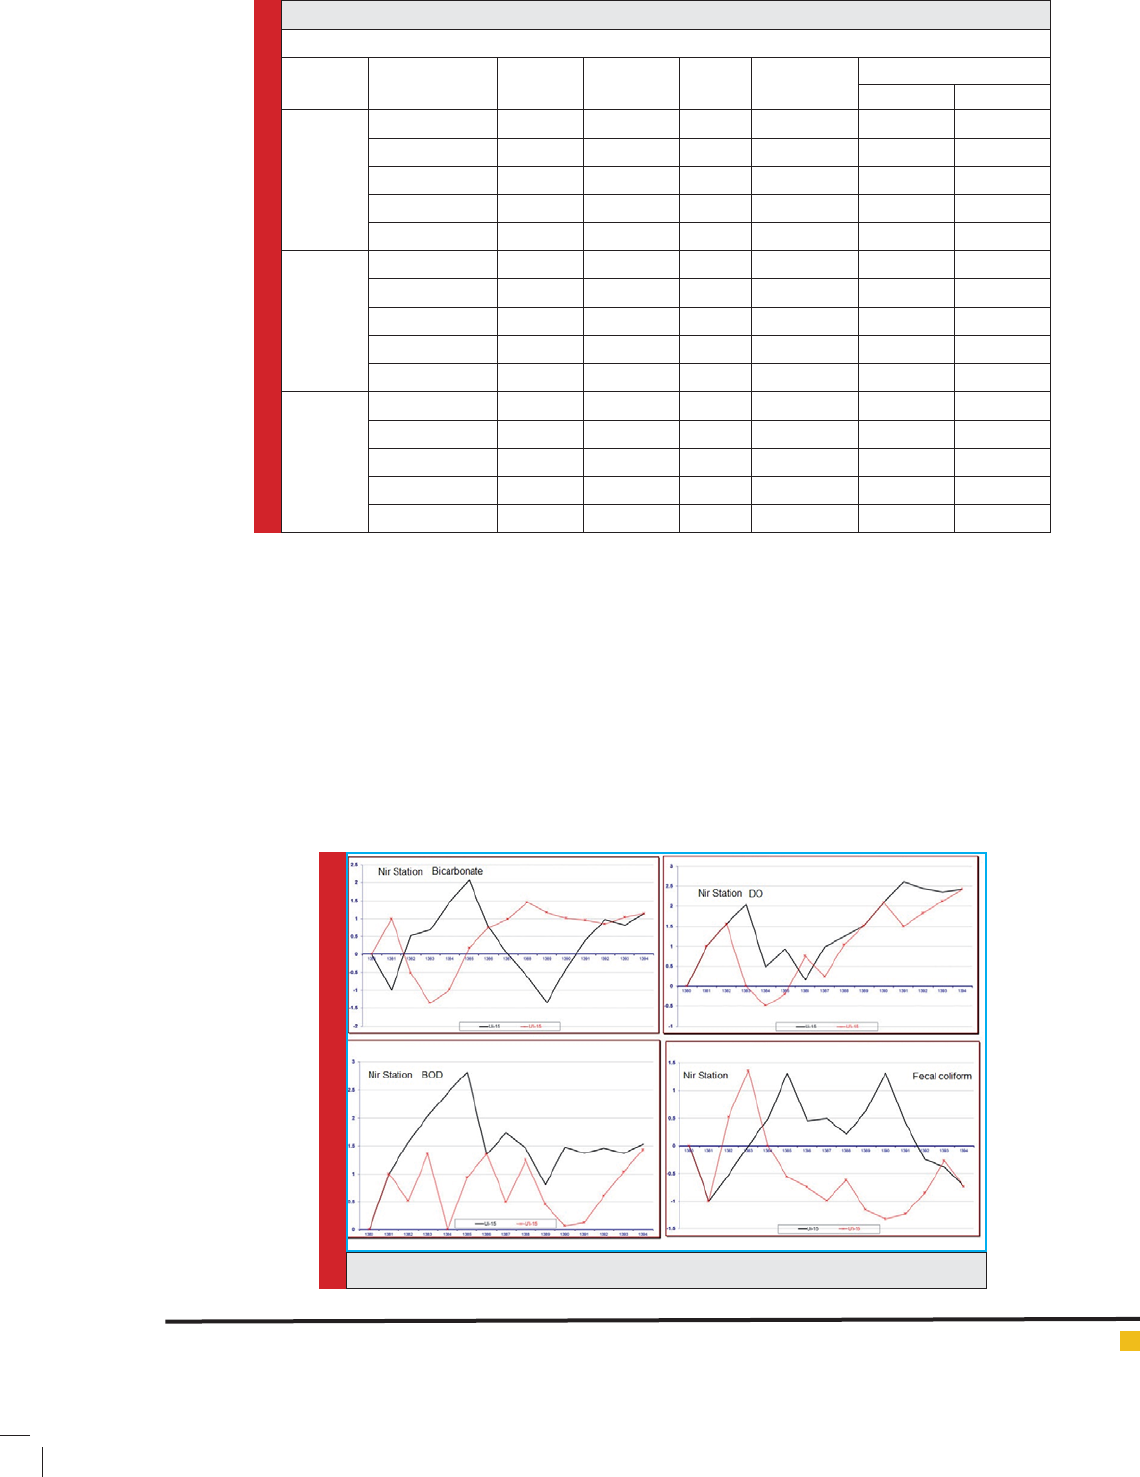
FIGURE 2. Mann - Kendall non-parametric test, Nir Station
Romina Rasuli Asl and Hossein Saadati
92 STATISTICAL EVALUATION OF CHEMICAL AND BIOLOGICAL CONTAMINATION BIOSCIENCE BIOTECHNOLOGY RESEARCH COMMUNICATIONS
2007 can be seen that is presented as graph. In the graph
of annual average bicarbonate of station Nir, two sig-
ni cant mutations with positive and negative trend in
2003 and 2007 can be seen as in 2007 has undergone a
sudden change and governance of its trend is negative. It
is concluded from investigating the behavior of changes
U and U ‘related to annual average BOD of station Nir
that, without signi cant change and mutation has expe-
rienced the normal process of maximum Sodium. In the
graph of average annual fecal coliform of station Nir,
a signi cant mutation with the positive trend in years
2005 is seen. As in 2007, it has experienced a mutation
and its trend is declining.
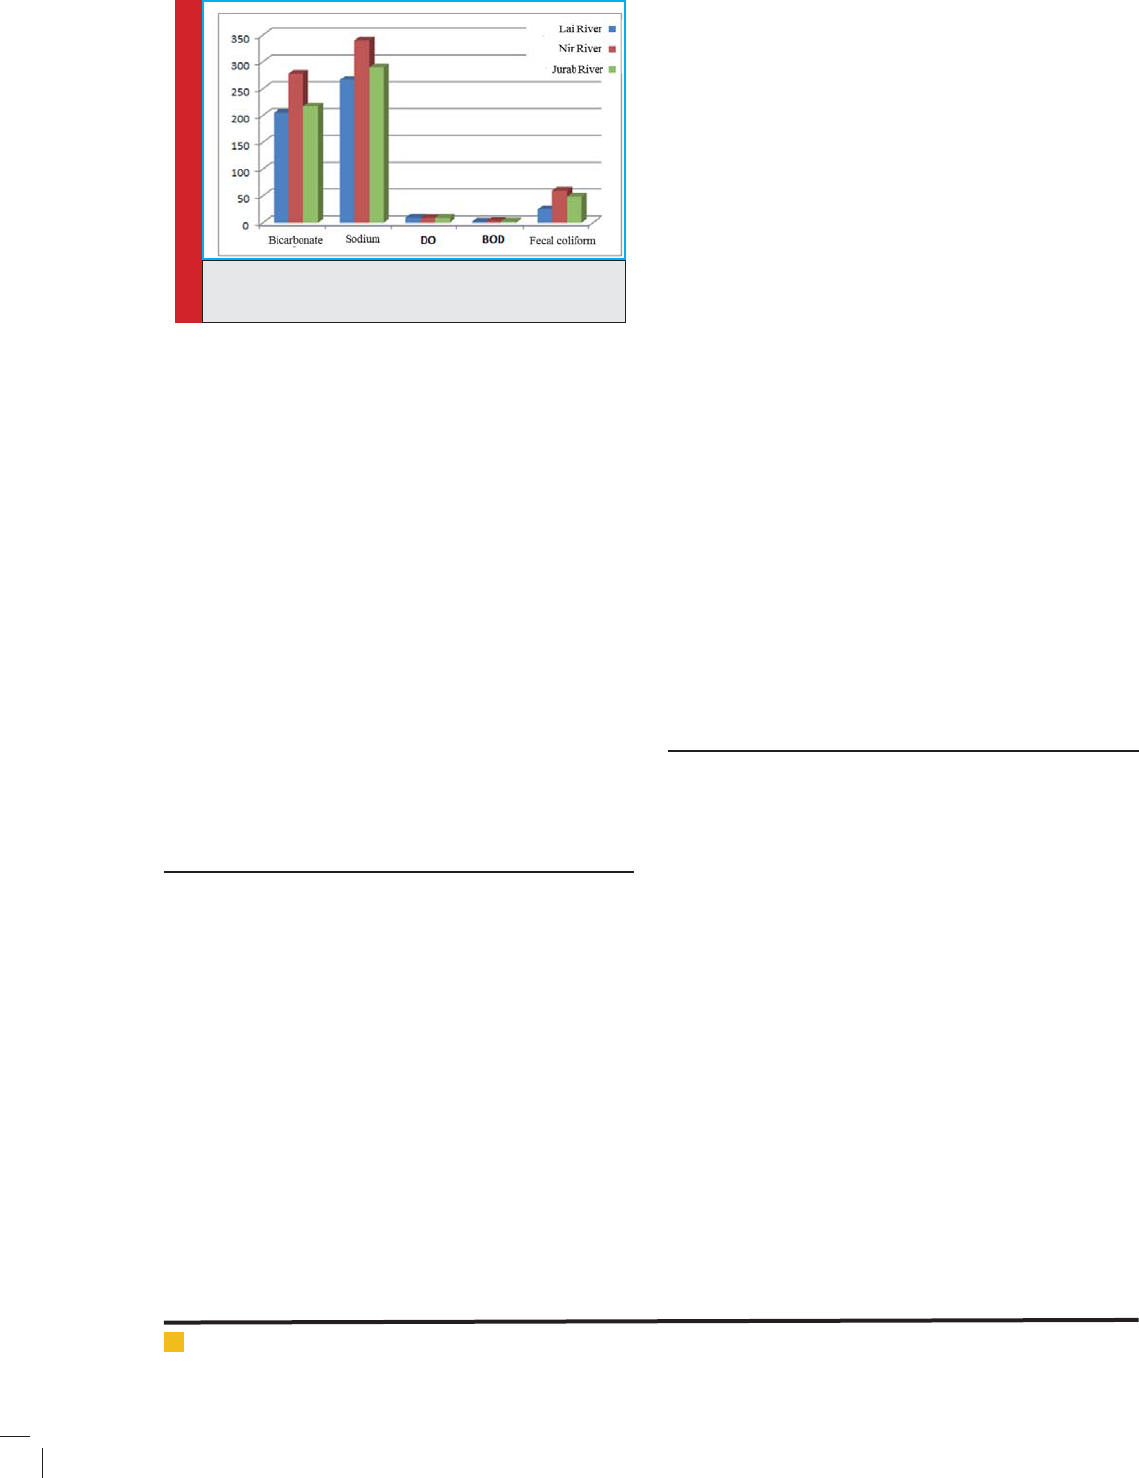
According to the results of the previous sections and
referring to the multi-year average related to the sta-
tions studied (Fig. 3), it can be concluded that Nir river
in all the variables studied is as the most pollutant river
among the three main rivers of the upstream region of
Yamchi Dam.
CONCLUSION
According to the results of this study, it can be said
evaluating water quality conducted in this study has
integrated and comprehensive expertise knowledge. As
it can be acted to better understanding, manage and
reduce its pollution by the selection of the main fac-
tors in water quality. Based on the results obtained,
features such as fecal coliform, bicarbonate, DO, BOD
and sodium were selected as effective factors, which
are a combination of chemical and biological param-
eters of water. Research about selecting effective factors,
determining the minimum or the most optimal effective
characteristics on water quality in different regions can
be guidance for proper assessment of water quality by
spending a minimum cost and time. Reviews related to
multivariate analysis of variance indicate high accuracy
and ability to detect the presence or absence of differ-
ence between study stations.
FIGURE 3. Graph of average of variables investigated
in the main branches of Yamchi Dam
The use of this method in the analysis of different
groups with different variables is very effective and
provides signi cant results. About the identi cation of
variables that shows signi cant difference among the
stations studied, the Duncan method due to advantages
compared to other methods such as LSD, Dunnett and
can be compared groups (Nir, Lai and Jurab stations)
mutually and to be ensured the signi cant difference
between the variables of the stations. So it is concluded
Duncan method has a highly accurate in identifying dif-
ferent variables between stations. A sample T test as a
standard method to examine the value of variables with
standard value of them has a high ef ciency and the
results obtained of it indicate pollution of parameters
investigated in available stations. As Nir station has the
highest pollution among the stations studied. The rea-
son for this is the owing Nir River through urban area
of Nir and adjacent villages as well as industries in the
region, which always production waste in these indus-
tries and urban sewage directly enter the river and is
a serious threat to aquatic and Yamchi Dam that is as
producer reservoir of drinking water for Ardabil. Of the
results obtained of time series of Mann-Kendall can be
clearly observed that parameters investigated during 13
years, have maintained its upward trend and are rising.
This implies the increase of human-produced pollutants
that without attention to the rights of posterity and due
to mismanagement is destroying environment.
RECOMMENDATIONS
Due to the sensitive situation of the region and the
expansion of residential and industrial areas adjacent
to rivers in the region, it is recommended to be used
drainage system suitable for agricultural lands
overlooking the river. In order to prevent the entry of
industrial wastewater and domestic sewage to the rivers
of area, sewage system is reconstructed in area and in
sections that is deprived of sewage, proper system of
sewage to be implemented. Lands use changes, espe-
cially deforestation and gardens and convert them to
residential areas in riverbanks to be prevented and in
accordance with the river privacy to be prevented the
entry of more pollution to groundwater and surface
water sources.
It is suggested to be achieved necessary information
from potential of land for various uses before use the
land in the area, with land capability assessment for dif-
ferent uses. According to the capabilities of GIS in land
planning, it is suggested to be implemented the logistic
plan in the region by taking advantage of the capabili-
ties of this system. It is suggested to be investigated the
effect of other parameters such as the amount of soil

Romina Rasuli Asl and Hossein Saadati
BIOSCIENCE BIOTECHNOLOGY RESEARCH COMMUNICATIONS STATISTICAL EVALUATION OF CHEMICAL AND BIOLOGICAL CONTAMINATION 93
erosion, rainfall and ooding also with more details on
the amount of dissolution time.
REFERENCES
Bardwaj, V., D.S. Singh and A.K. Singh. (2010). Water quality
of the Chhoti Gandak River using principal component analy-
sis, Ganga Plain, India. Journal of Earth System Science, 119:
117-127.
Bu, H., Tan, X., Li, S. and Zhang, Q. (2010). Temporal and
spatial variations of water quality in the Jinshui River of the
South Qinling Mts, China. Ecotoxicology and Environmental
Safety. 73: 907-913 pp.
Charu, P. and Verma, N. (2008). Mulitivariate analysis of drink-
ing water quality in Bhopal, India. Envirionmental Monitoring
and Assessment. 140: 119-122 pp.
Dixon, W. and Chiswell, B. (2012). Review of aquatic monitor-
ing program design. Water Research. 30:1935-1984 pp.
Doran, J. W., and Parkin, T. B. (1986). De ning and assessing
soil quality. Journal of Soil Sciences Pages 3-21
Jolliffe, I. T. (1986) Principal Component Analysis Springer-
Verlag, NewYork.
Pezhman, A.H., Nabi Bidhendi, G.R., Karbasi, A.R., Mehradadi,
N., Esmaeili Bidhendi, M.(2009). Evaluation of spatial and sea-
sonal variations in surface water quality using multivariate
statistical techniques. International Journal of Environmental
Science and Technology (IJEST). 6:467-476 pp.
Ramezani, S. and Hashemi, H. (2011). Analysis of water qual-
ity of Zarrine Rud River with statistical technique of main
component analysis of Fourth Conference on Water Resources
Management in Iran. Amirkabir University of Technology,
Tehran.
Razmkhah, H., Abrishamchi, A. and Torkian, A. (2010). Evalu-
ation of spatial and temporal variation in water quality by
pattern recognition techniques: A case study on Jajrood River
(Tehran, Iran). Journal of Environmental Management. 91:
852-860 pp.
W. Doran and P Parkin (1996) (eds.) De ning soil quality for a
sustainable environment. il Science Society of America Special
Publication no. 35, Madison, WI.
Yao, H., Thornton, B., Paterson, E., (2012). Incorporation of
13C-labelled rice rhizodeposition carbon into soil microbial
communities under different water status. Soil Biology & Bio-
chemistry 53, 72e77.