
Assessment of the tolerance of various cultivars of
barley towards salinity stress in germination and early
growth stages
Saba Talebe Hagh
1,2
, Hossein Shahbazi
1, 2
* and Marefat Ghasemi
3
1
Department of Agronomy, Ardabil Science and Research Branch, Islamic Azad University, Ardabil, Iran
2
Department of Agronomy, Ardabil Branch, Islamic Azad University, Ardabil, Iran
3
Agriculture and Natural Resources Research Center, Ardabil, Iran
ABSTRACT
In order to assess the tolerance of some of barley cultivars towards salinity stress in germination and early growth
stages in greenhouse condition an experiment was carried out in Ardabil islamic Azad University research farm in
2015-2016 agriculture year. This research was carried out in 2 factorial designs in completely randomized design with
three replications. The rst factor included twelve cultivars of barley including Afzal, Nosrat, Valfajr, Kavir, Yousef,
Torsh, Sahra, Nimruz, Zehek, Dasht, Bahman and Reyhan 2. The second factor included four levels of salinity of with-
out stress and salinity stresses of 6, 12 and 18 Decisiemens per meter (dS/m). The rst experiment was carried out in
Petri dishes and characteristics related to germination (including velocity of germination and seedling characteristics)
were recorded. In the second experiment, the velocity and percentage of seedling emergence of barley were measured.
Characteristics analysis of variance results suggested that salinity stress impact was signi cant on all characteristics
except for percentage of seedling emergence in pots. The difference between barley cultivars was signi cant, except
in weight per hundred seeds, length of coleoptile and percentage of emergence.
KEY WORDS: SALINITY STRESS, BARLEY, ELECTRICAL CONDUCTIVITY, GERMINATION PERCENTAGE
24
ARTICLE INFORMATION:
*Corresponding Author:
Received 27
th
Nov, 2016
Accepted after revision 24
th
March, 2017
BBRC Print ISSN: 0974-6455
Online ISSN: 2321-4007
Thomson Reuters ISI ESC and Crossref Indexed Journal
NAAS Journal Score 2017: 4.31 Cosmos IF : 4.006
© A Society of Science and Nature Publication, 2017. All rights
reserved.
Online Contents Available at: http//www.bbrc.in/
Biosci. Biotech. Res. Comm. Special Issue No 1:24-32 (2017)
Hagh, Shahbazi and Ghasemi
INTRODUCTION
Salinity is one of the main problems in the farms in
the world so that millions of tons of salt enters agri-
cultural soils through irrigation, annually. Increase in
the concentration of salts in soil solution or irrigation
water has been considered one of the oldest agricultural
and environmental problems, globally. Presence of high
rate of salts in the soil or irrigation water confronts the
plant with salinity stress. The saline soils area in Iran
is 25 million hectares which is increasing due to the
weak management in irrigation (Pakniat et al., 2003).
Barley is one of the most important crops and among
the small grains, it shows resistance towards heat, base
and salt. Barley is signi cant due to its capacity to grow
in less fertile areas which are limited by drought, low
temperature and salinity (Mottaki et al., 2004). Germi-
nation speed and early growth of barley decrease under
salinity stress. The growth differences of barley cultivars
under salinity stress shows the genetic difference in the
potentials of the cultivars in confronting salinity stress.
Since it seems that barley cultivars with higher emer-
gence speeds and better early growth have higher resist-
ance towards salinity, this research tries to study the
conditions of germination, emergence and early growth
of twelve barley cultivars under salinity stress.
Results from Kholq sima et al. (2013) suggested that
there is a positive correlation between salinity toler-
ance in the planet during germination and vegetative
growth. Considering the aforementioned requirements,
this experiment was carried out in order to study the
impact of sodium chloride salinity on germination and
determining threshold of salt tolerance in a number of
commercial barley cultivars for identi cation and intro-
duction of the most tolerant cultivar in greenhouse
condition. Salinity is among the most serious dangers
threatening environment and agriculture in many parts
of the world, and it impacts the performance of crops
yield in arid and semi-arid regions. Considering the sig-
ni cance of barley in feeding animals and also malt-
ing industry in Iran, presence of saline soils and water
in Iran proper for planting barley and also presence of
various genotypes tolerating salinity, which are intro-
duced recently, make conducting research in this regard
inevitable.
MATERIALS AND METHODS
This experiment began in autumn 2015 and continued
in spring and summer 2016 in Ardabil islamic Azad Uni-
versity research farm located in Hasan Baruq town (5
km west of Ardabil). Height above sea level was 1,350
meters and the longitude and latitude were 48° 30’ E and
38° 15’ N, respectively. The climate in which the experi-
ment was carried out was cold semi-arid and the soil in
the region was clay loam soils which is poor is organic
materials.
EXPERIMENT DESIGN
This research was conducted in 2 factorial designs in
completely randomized design with three replications.
The rst factor included twelve cultivars of barley
including Afzal, Nosrat, Valfajr, Kavir, Yousef, Torsh,
Sahra, Nimruz, Zehek, Dasht, Bahman and Reyhan 2.
The second factor included four levels of salinity of
without stress and salinity stresses of 6, 12 and 18
Decisiemens per meter (dS/m). The rst experiment was
carried out in Petri dishes and characteristics related
to germination (including velocity of germination and
seedling characteristics) were recorded. In the second
experiment, the velocity and percentage of seedling
emergence of barley were measured. In this experiment,
in order to control the electrical conductivity of water, a
saucer was put under each pot so that the water salinity
could be measured and the uniformity of salinity dur-
ing the experiment could be controlled. The seeds were
planted in 5-liter plastic pots which were lled with
1:1:1 of sand, agricultural soil and Well-rotted washed
farmyard manure. The uniform seeds of all twelve bar-
ley cultivars were disinfected by Vitavax fungicide and
planted.
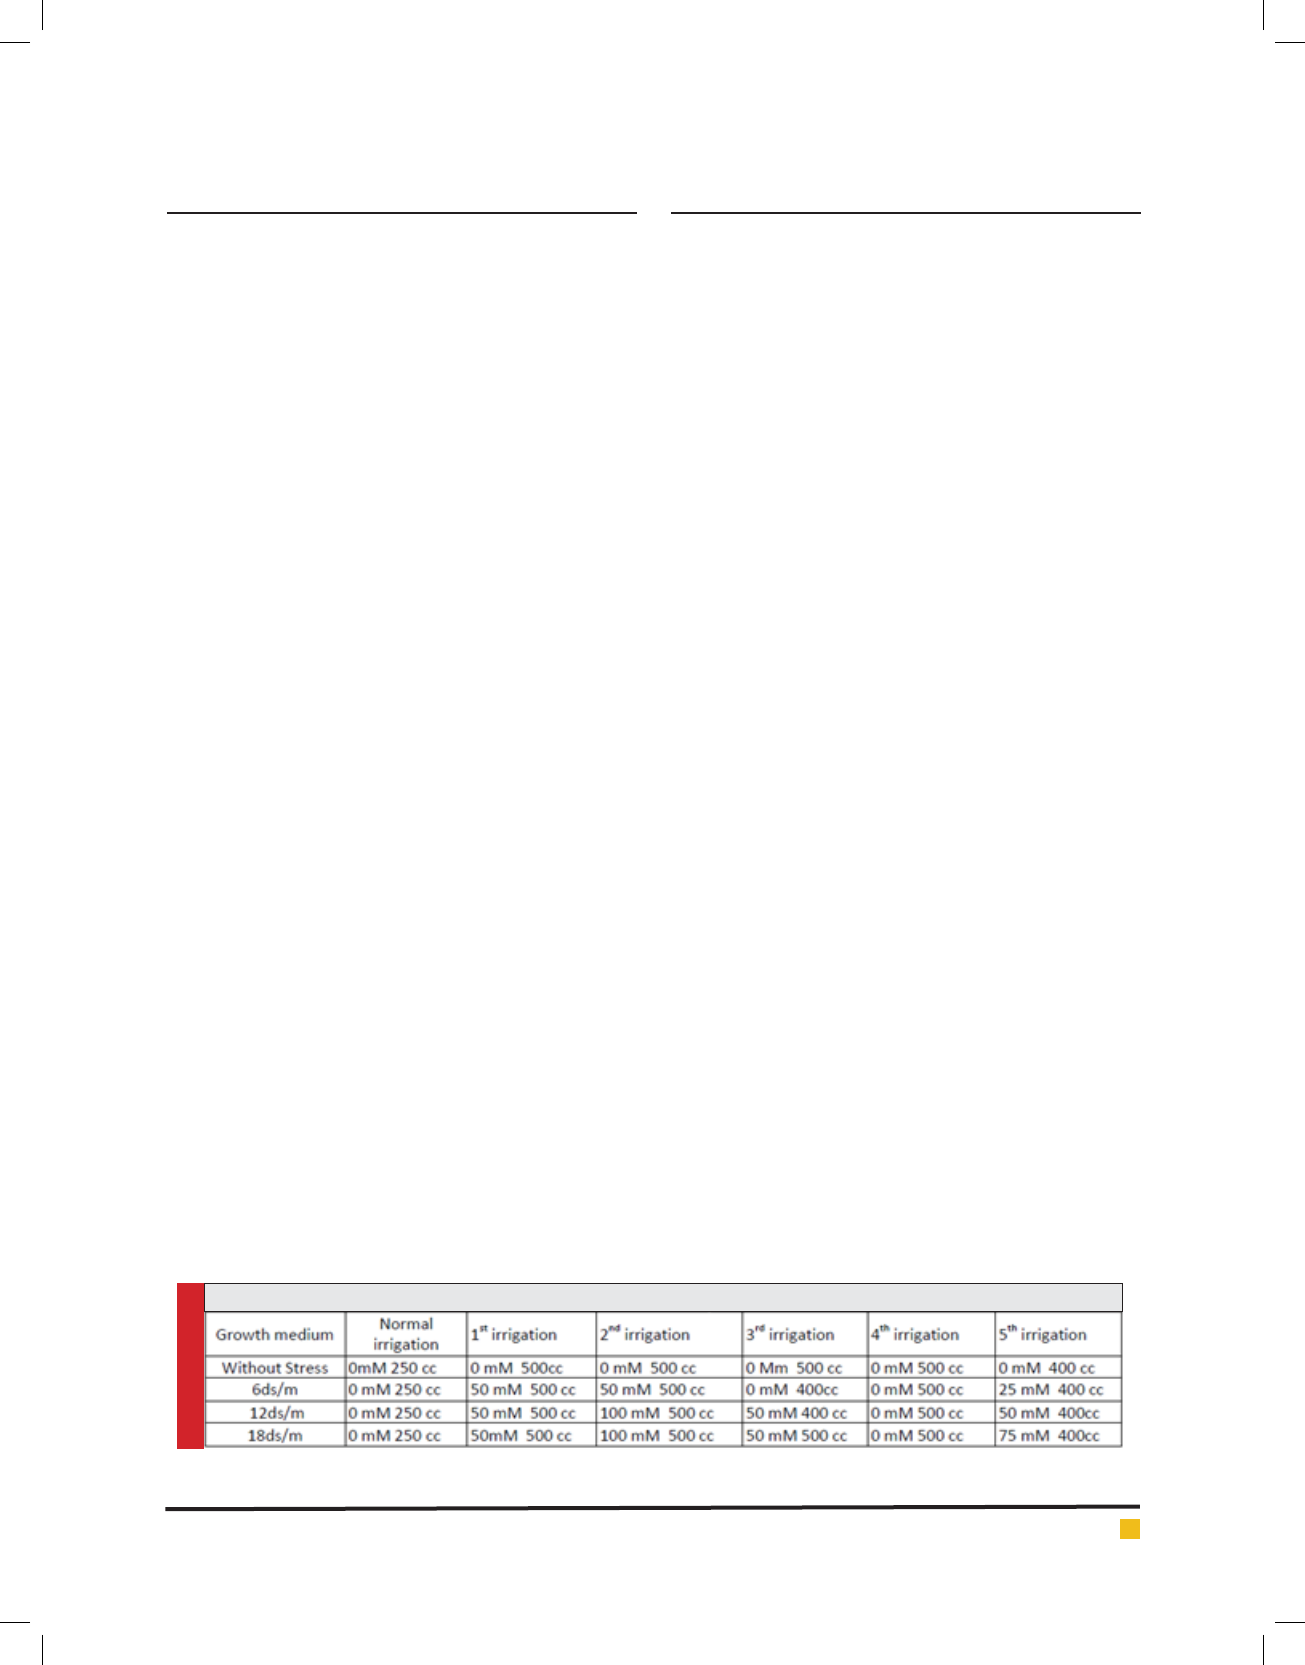
SALINITY STRESS APPLICATION PROCESS
Initially, the seeds were irrigated by water every other
day until the growth of bushes and reaching stemming
and subsequently, salinity stress was applied after the
stage of growth through irrigation by NaCl solution
(Table 1).
BIOSCIENCE BIOTECHNOLOGY RESEARCH COMMUNICATIONS ASSESSMENT OF THE TOLERANCE OF VARIOUS CULTIVARS OF BARLEY 25
Table 1. How to salinity stress
Hagh, Shahbazi and Ghasemi
MEASURED CHARACTERISTICS
Final Germination Percentage
According to Almadras (1998), nal germination per-
centage (FGP) is calculated through dividing germinated
seeds on the total number of seeds and through the fol-
lowing formula:
FGP = Ng/Nt × 100
Ng = the total number of germinated seeds
Nt = the total number of assessed seeds
Coef cient of Velocity of Germination
Coef cient of velocity of germination (CVG) is calculated
through counting the number of germinated seeds per
day. CVG is calculated through the following formula:
CVG = 100 × ∑Ni/∑NiTi
Ni = the number of germinated seeds per day
Ti = number of days since the beginning of the experiment
Germination Rate Index
Germination rate index (GRI) is calculated by the per-
centage of the number of germinated seeds per day dur-
ing the experiment. Germination rate index is calculated
through the following formula:
GRI = G1/1+G2/2+…+Gx/x
G1 = percentage of germination on the rst day
G2 = percentage of germination on the second day, etc.
Number of Radicles, Length of Radicle and Length of
Coleoptile
In order to measure seedling characteristics, 10 seedlings
were chosen from each dish and the number of radicles,
the length of radicle and the length of coleoptile were
measured and their average was recorded as the input
for each pot.
Emergence Percentage
Emergence percentage of seedlings in pot is calculated
through the following formula:
EP = EN/TN
In which EP is the emergence percentage which is cal-
culated through dividing the number of emerged seeds
(EN) on the total number of planted seeds (TN). Notetak-
ing and observation were carried out fteen days after
planting the seeds.
Velocity of Emergence
Velocity of emergence of seedlings in the pot was cal-
culated by the formula presented by Pirasteh-Anisheh
et al., 2011):
ER = ∑n/Dn
In which: velocity of emergence (ER) is calculated by the
total of germinated seeds per day (n) on the number of
each day (Dn).
RESULTS AND DISCUSSION
ANALYSIS OF VARIANCE OF CHARACTERISTICS
Analysis of Variance of Germination Characteristics
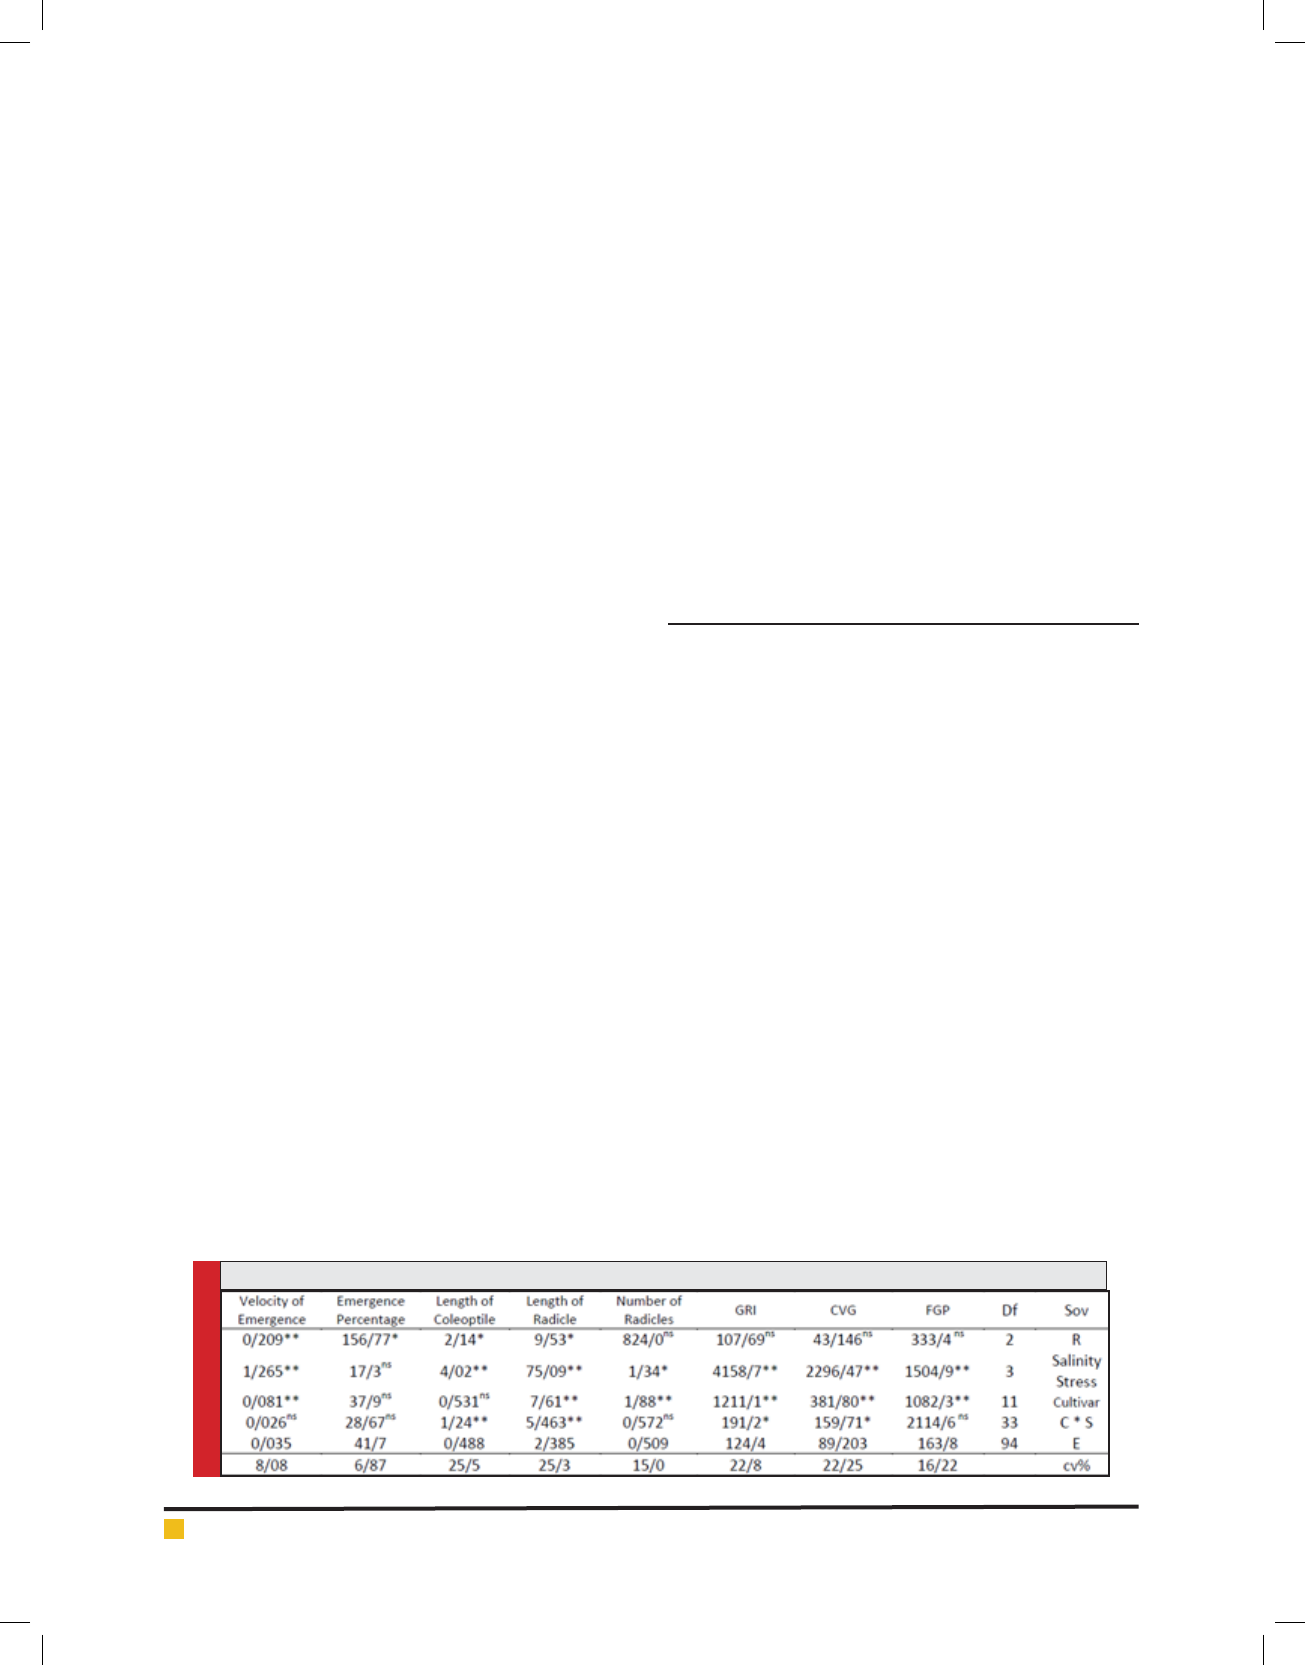
Results for analysis of variance of the characteristics
related to germination are provided in Table 2. As it
could be observed from the table, the replication effect
is signi cant in length of radicle and length of coleop-
tile, emergence percentage and velocity of emergence.
Although the experiment was of petri dish and pot, var-
ious stories of the seed germinator machine and also
places of the pots in the greenhouse as a block, had a
signi cant impact on some of the characteristics. The
salinity stress impact was signi cant on all character-
istics except for the seedlings’ emergence percentage.
The salinity stress impact on this characteristic might be
due to the fact that the measurement of this character-
istic is carried out before the real salinity of the pot soil
reached the target amounts, since electrical conductivity
of the pot soil did not reach the target amount by the
rst irrigation by saline water. The difference between
barley cultivars were signi cant except for the length
of coleoptile and emergence percentage which indicates
the presence of genetic diversity among the assessed
cultivars based on their tolerance of salinity stress.
26 ASSESSMENT OF THE TOLERANCE OF VARIOUS CULTIVARS OF BARLEY BIOSCIENCE BIOTECHNOLOGY RESEARCH COMMUNICATIONS
Table 2. Analysis of Variance of the Characteristics Related to the Germination
Hagh, Shahbazi and Ghasemi
Results from this research are in accordance with the
results from Hang and Redman (1995) and also ndings
of Kaya et al. (2006).
Results from Mohammadi et al. (2011) suggested
that the effect of salinity, genotypes and their interac-
tion was signi cant at one percent. The interaction of
cultivar × salinity was signi cant in characteristics of
velocity of germination, germination rate index, length
of radicles and length of coleoptile which indicates the
different reaction of cultivars to the various levels of
salinity stress. Also, Dadashi et al. (2007) expressed that
the majority of measured characteristics in 10 genotypes
of barley in both normal condition and salinity stress
condition had a signi cant difference at 1 and 5 percent
and this shows that there is a genetic diversity among
the 10 genotypes of barley based on their resistance or
sensitivity towards stress. Bechini et al. (2010) found a
considerable genetic diversity among the barley culti-
vars during studying the salinity stress.
THE IMPACT OF SALINITY STRESS ON
GERMINATION CHARACTERISTICS
Final Germination Percentage
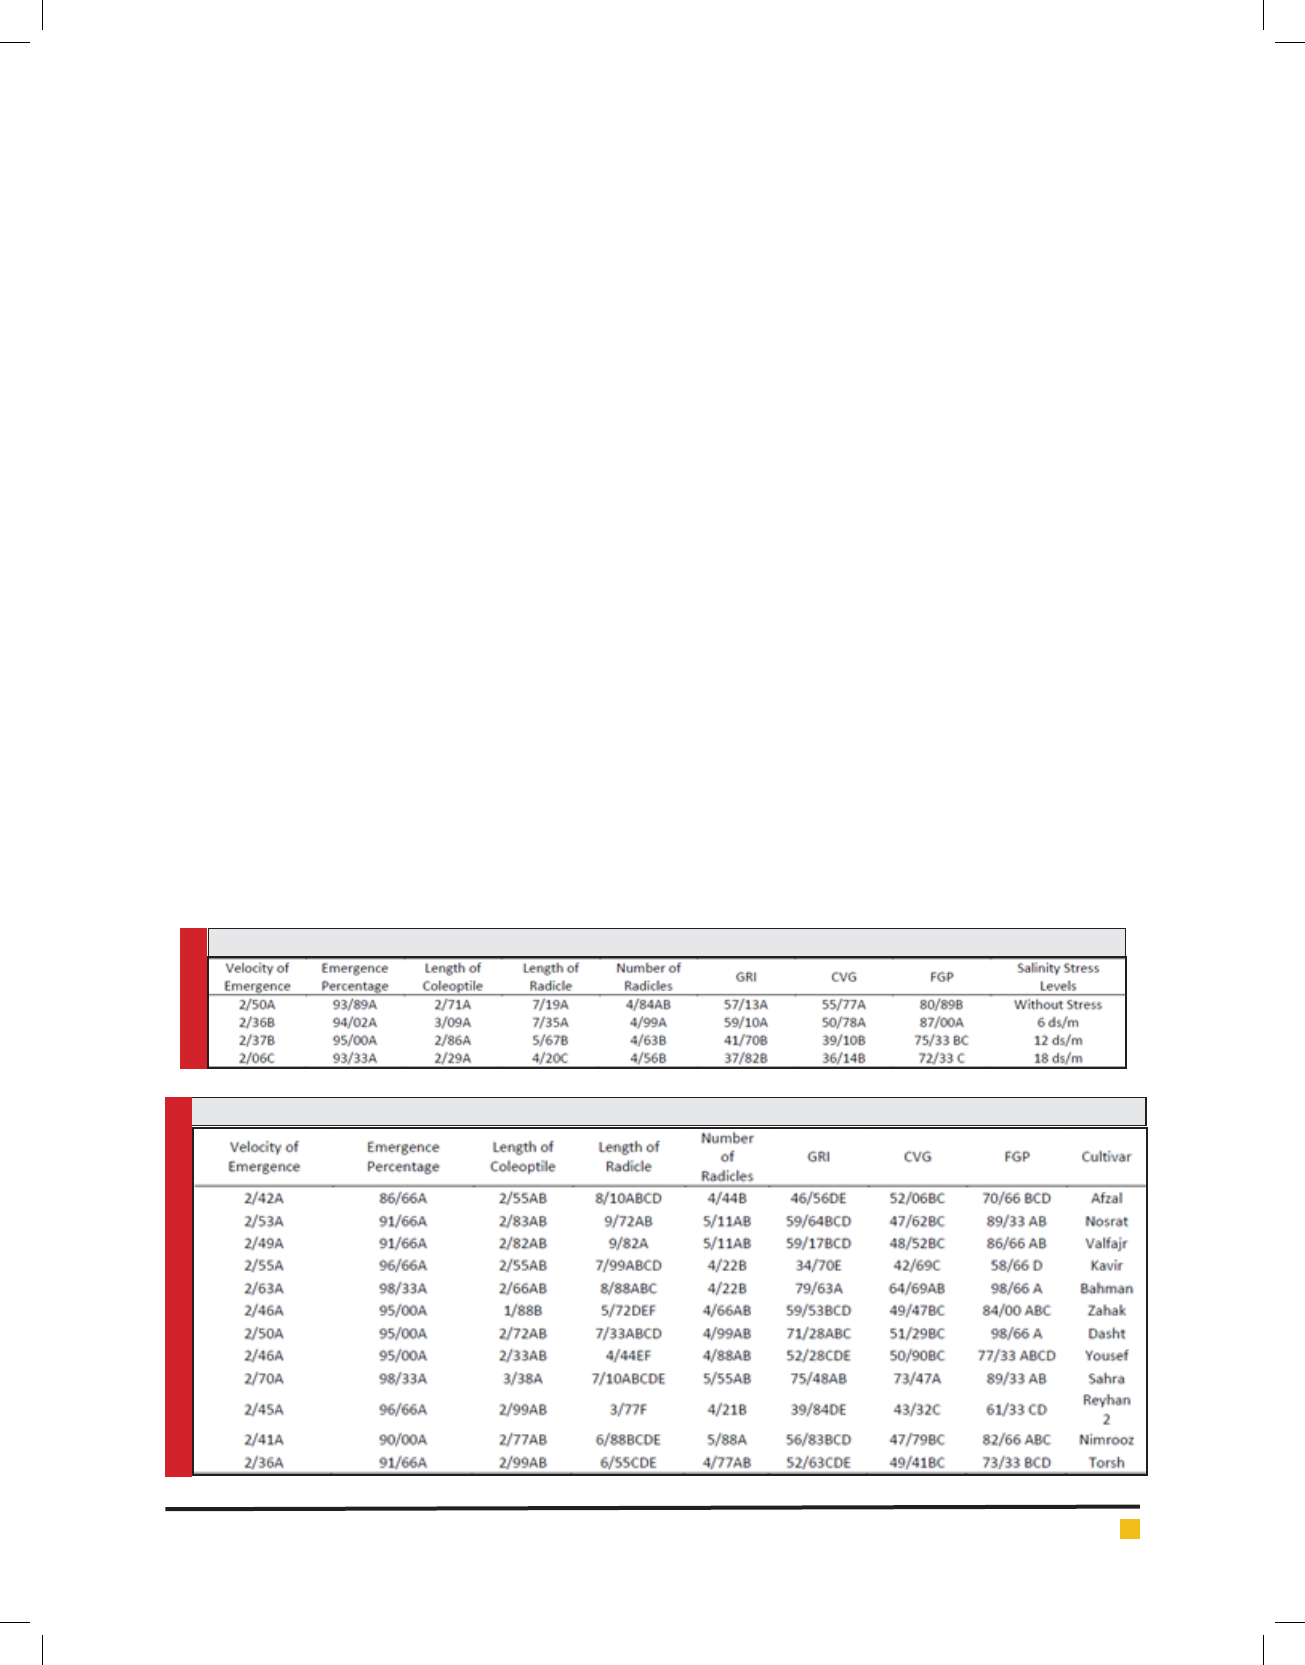
As it could be observed from Table 3, by the beginning
of salinity stress nal germination percentage has ini-
tially increase slightly and subsequently, it decreased by
the increase in the salinity stress to 12 dS/m. it seems
that weak salinity leads to better stimulation of germi-
nation. In Maqtuli Chaichi (1999) research, germination
percentage mean comparison in various salinity stress
levels, the germination percentage decreased, but this
decrease was signi cant in 200 Mmol level, only. Salin-
ity decreases germination in the plant through three
main factors including osmotic potential, production of
toxic ions and changes in nutrient elements. Decrease in
nal germination percentage under impact of salinity is
reported in alfalfa by Aminpur and Ja’faraqai (1998). In
studying the resistance of canola towards salinity, Bayb-
verdi and Tabatabi (2009) expressed that by the increase
in salinity, the nal germination percentage decreases.
The decrease in the number of germinated seeds could
be related to the water absorption due to the formation
of osmatic potential by the increase in salinity and also
sodium toxicity impact on plants metabolic processes
which lead to disorder in the seed embryo development
and as a result the radicle exist the shell. In Movafeq
et al. (2012) research, salinity stress decreased the nal
germination percentage.
Coef cient of Velocity of Germination
As it could be observed in Table 3, coef cient of veloc-
ity of germination has not decreased until 6 dS/m level,
but by the increase in the stress intensity, it decreased
in the next levels. It seems that coef cient of velocity of
germination does not show any sensitivity to low levels
of stress. Salinity stress decreases the water absorption
through osmotic stress and by concentration sodium
and chloride ions lead to an imbalance in absorption
BIOSCIENCE BIOTECHNOLOGY RESEARCH COMMUNICATIONS ASSESSMENT OF THE TOLERANCE OF VARIOUS CULTIVARS OF BARLEY 27
Table 3. Impact of Salinity Stress Levels on Characteristics Related to Germination
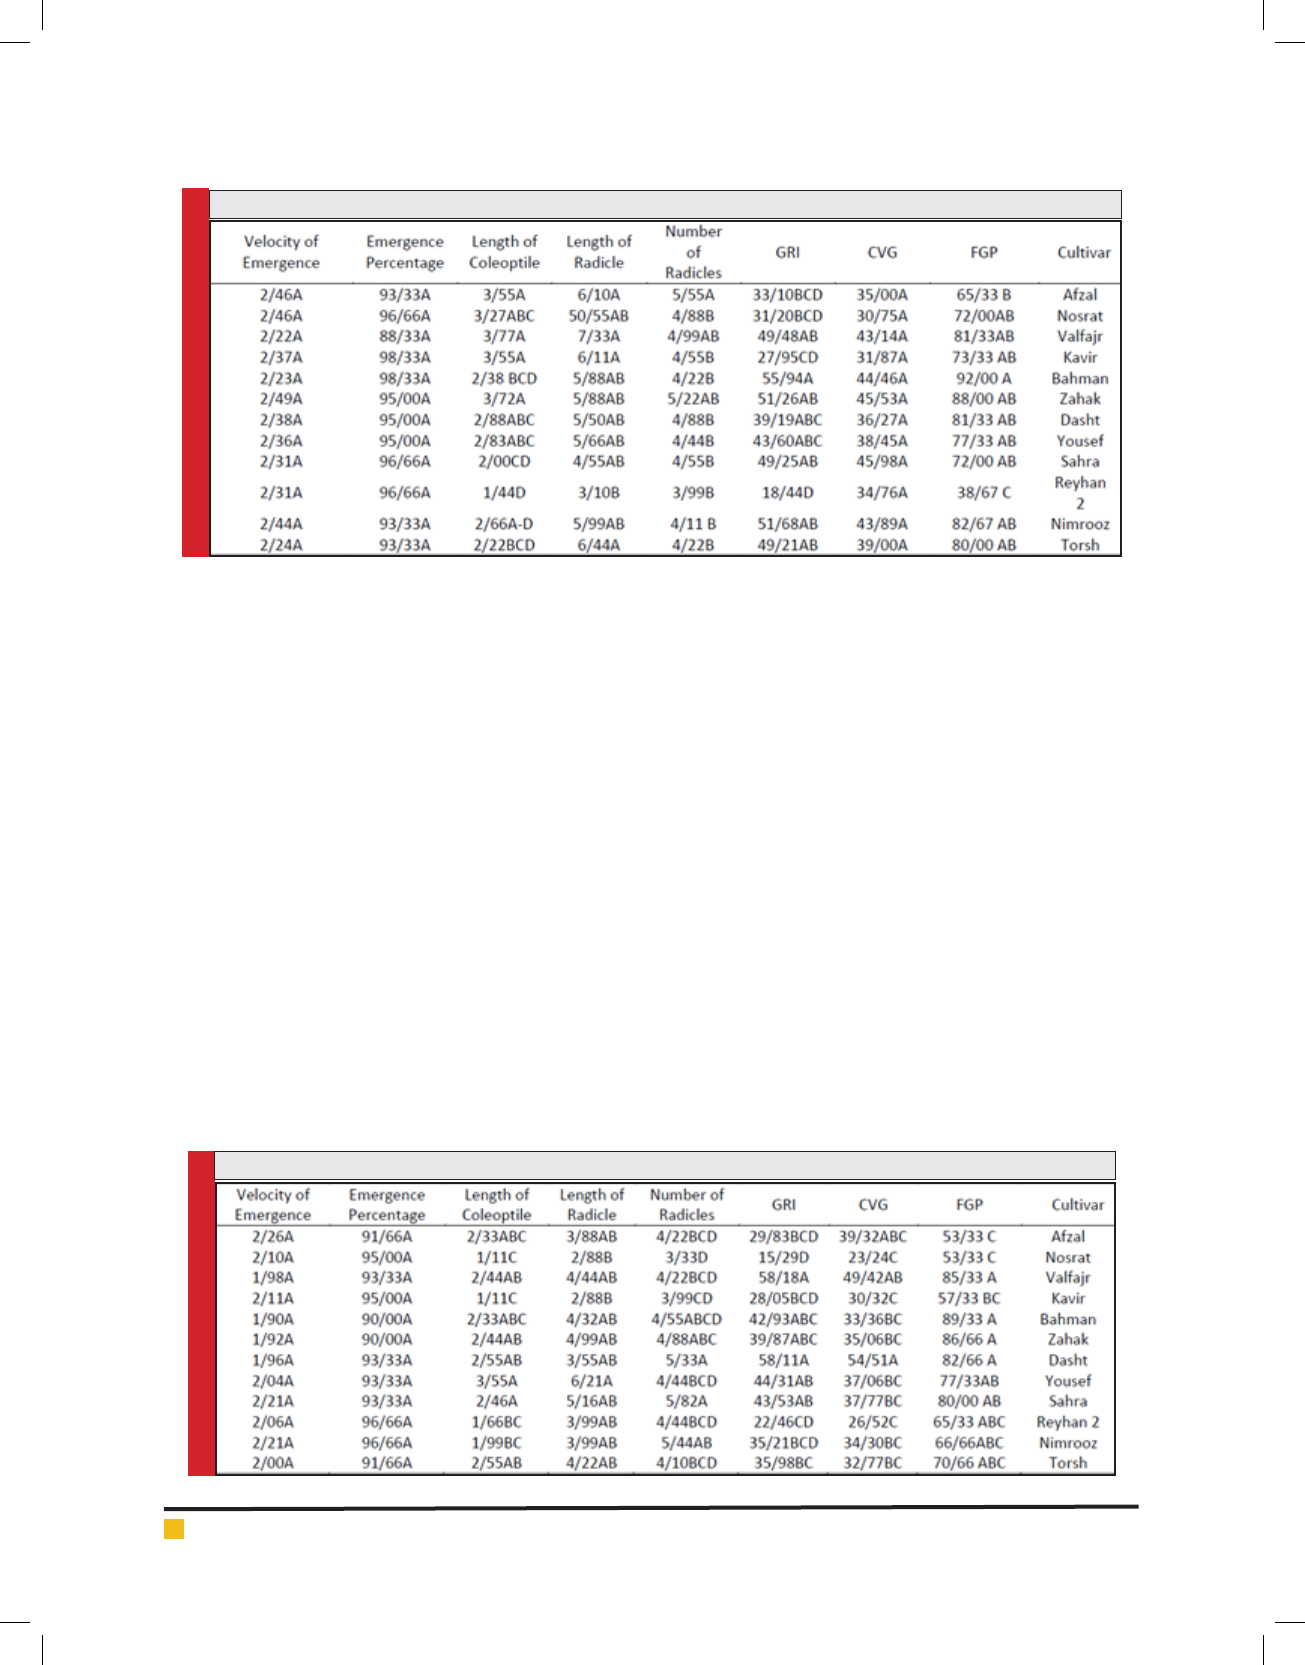
Table 4. Cultivars Means Comparison in Without Stress Level

Hagh, Shahbazi and Ghasemi
of nutrient elements and formation of toxicity (Kaima-
kanova, 2009). Shamsi Mahmud Abadi (2007) expressed
that by the increase in salinity, the seeds are not capable
of absorbing water for germination and cell development
and on the other hand, the enzymes which are important
in plant activation and growth are damaged or activated
by dely. Due to the same reason, by the increase in salin-
ity, the velocity of germination is decreased initially and
then the germination percentage changes. Through the
conducted studies in this experiment, it is concluded
that the lack of germination in many of the studied
seeds is related to the disorder in water absorption in
water absorption due to osmotic potential impact of the
salt solution. Also, the toxicity due to the concentration
of some ions leads to prevention of germination through
forming disorder in metabolism of the embryo.
Germination Rate Index
As it could be observed from Table 3, germination rate
index has not decreased until 6 dS/m level, but by the
increase in the stress intensity, it decreased in the next
levels. It seems that germination rate index decreases
in stresses higher than 6 dS/m. Turhan and Ayaz (2004)
came to this conclusion that increase in salinity levels
decreases the seedling germination by impacting cell
division and metabolism of the plant. They also found
out that the inhibitory effect of sodium chloride on ger-
mination of sun ower seed depends on the absorption
of chloride and sodium ions by the hypocotyl.
Number of Radicles
As it could be observed in Table 3, the number of radi-
cles do not have any signi cant difference both in with-
out stress and 6 dS/m stress. However, by the increase in
the stress intensity, the mean decreases. Salinity stress
and lack of water and nutrient resources are among the
main factors in decreasing yield in crops. Healthy and
developed roots increase the water and nutrients absorp-
tion and it leads to increase in yield (Rezaatai et al.,
2013). The volume of root and the number of root hairs
are among the characteristics which are of a great sig-
ni cant in optimal situation (water and nutrients). In
optimal situation, the plant tries to absorb water and
nutrients by increasing the volume and number of roots
in surface layer of the soil, while in stress situation, the
length of the roots and the ratio of the length of the
roots to the shoots becomes more important (Canbar et
al., 2009) In Bechini et al. (2010), salinity stress led to a
signi cant decrease in the number of radicles in barley
cultivars.
Length of Radicle
As it could be observed from Table 3, in both without
stress and 6 dS/m stress, there is no difference between
the characteristics and it has decreased in the next stress
levels. Hence, the best growth of length of radicle was
in without stress and 6 dS/m stress levels. Uniform-
ity and velocity of germination showed a positive and
direct relation with the length of radicle and plumula.
In Movafeq et al. (2013) salinity stress led to a decrease
in the length of radicle. In the study of Mohammad
Youse et al. (2011), the length of plumula to radicle had
a higher decrease in salinity stress.
Length of Coleoptile
As it could be observed from Table 3, the length of coleop-
tile has not undergone salinity stress. Hence, it could be
concluded that the length of coleoptile has the least sen-
sitivity towards salinity stress. According to Francis et
al. (1986) and Kaimakanova et al. (2009), under salinity
stress the ratio of coleoptile elongation decreases by the
low water potential of the soil and due to the weakness
of coleoptile, the seedling is not established well. Salin-
ity decreases the seedling growth through decreasing
the nutrient reserve, and suspends the cell division and
damages it by preventing axis development on the coty-
ledon. Also, under salinity stress, under salinity stress
the ratio of coleoptile elongation decreases by the low
water potential of the soil (Francis et al., 1986) and as
due to the weakness of coleoptile, the seedling is not
established well.
Emergence Percentage
As it could be observed in Table 3, there was no signi -
cant difference found between the mean of emergence of
percentage in the bushes in the pots. Tis is due to the fact
that by the rst irrigation, the salinity treatment had not
reached the targeted limit. The emergence capacity of the
seeds, especially in undesirable conditions such as farms,
is a signi cant index of seed vigor. Results from this
experiment proves the abovementioned issue. According
to Monez and Toaster (2008), salinity decreases the early
emergence of the plant through three factors including
osmotic potential of the solution, production of toxic
ions and changes in nutrient elements balance. In low
salinity concentrations, decrease in osmatic potentials is
a limiting factor for germination and emergence. How-
ever, in high salinity concentrations
Velocity of Emergence
Considering Table 3, the velocity of emergence had the
highest mean in without stress level and, the velocity of
emergence decreased by the increase in stress and the
lowest mean was at 18 dS/m level, which has decreased
in this level. Plants from vigorous seeds have a higher
velocity of emergence, comparing with plants from weak
and worn-out seeds (Wave, 1977).
28 ASSESSMENT OF THE TOLERANCE OF VARIOUS CULTIVARS OF BARLEY BIOSCIENCE BIOTECHNOLOGY RESEARCH COMMUNICATIONS
Hagh, Shahbazi and Ghasemi
COMPARISON OF MEANS OF CULTIVARS
BASED ON GERMINATION CHARACTERISTICS
Final Germination Percentage
As it could be observed from Table 4, in without stress
level, cultivars of Dasht, Bahman, Nosrat, Sahra, Val-
fajr, Zahak, Nimruz and Yousef with common letter of
A were in the rst group and had the highest rate of the
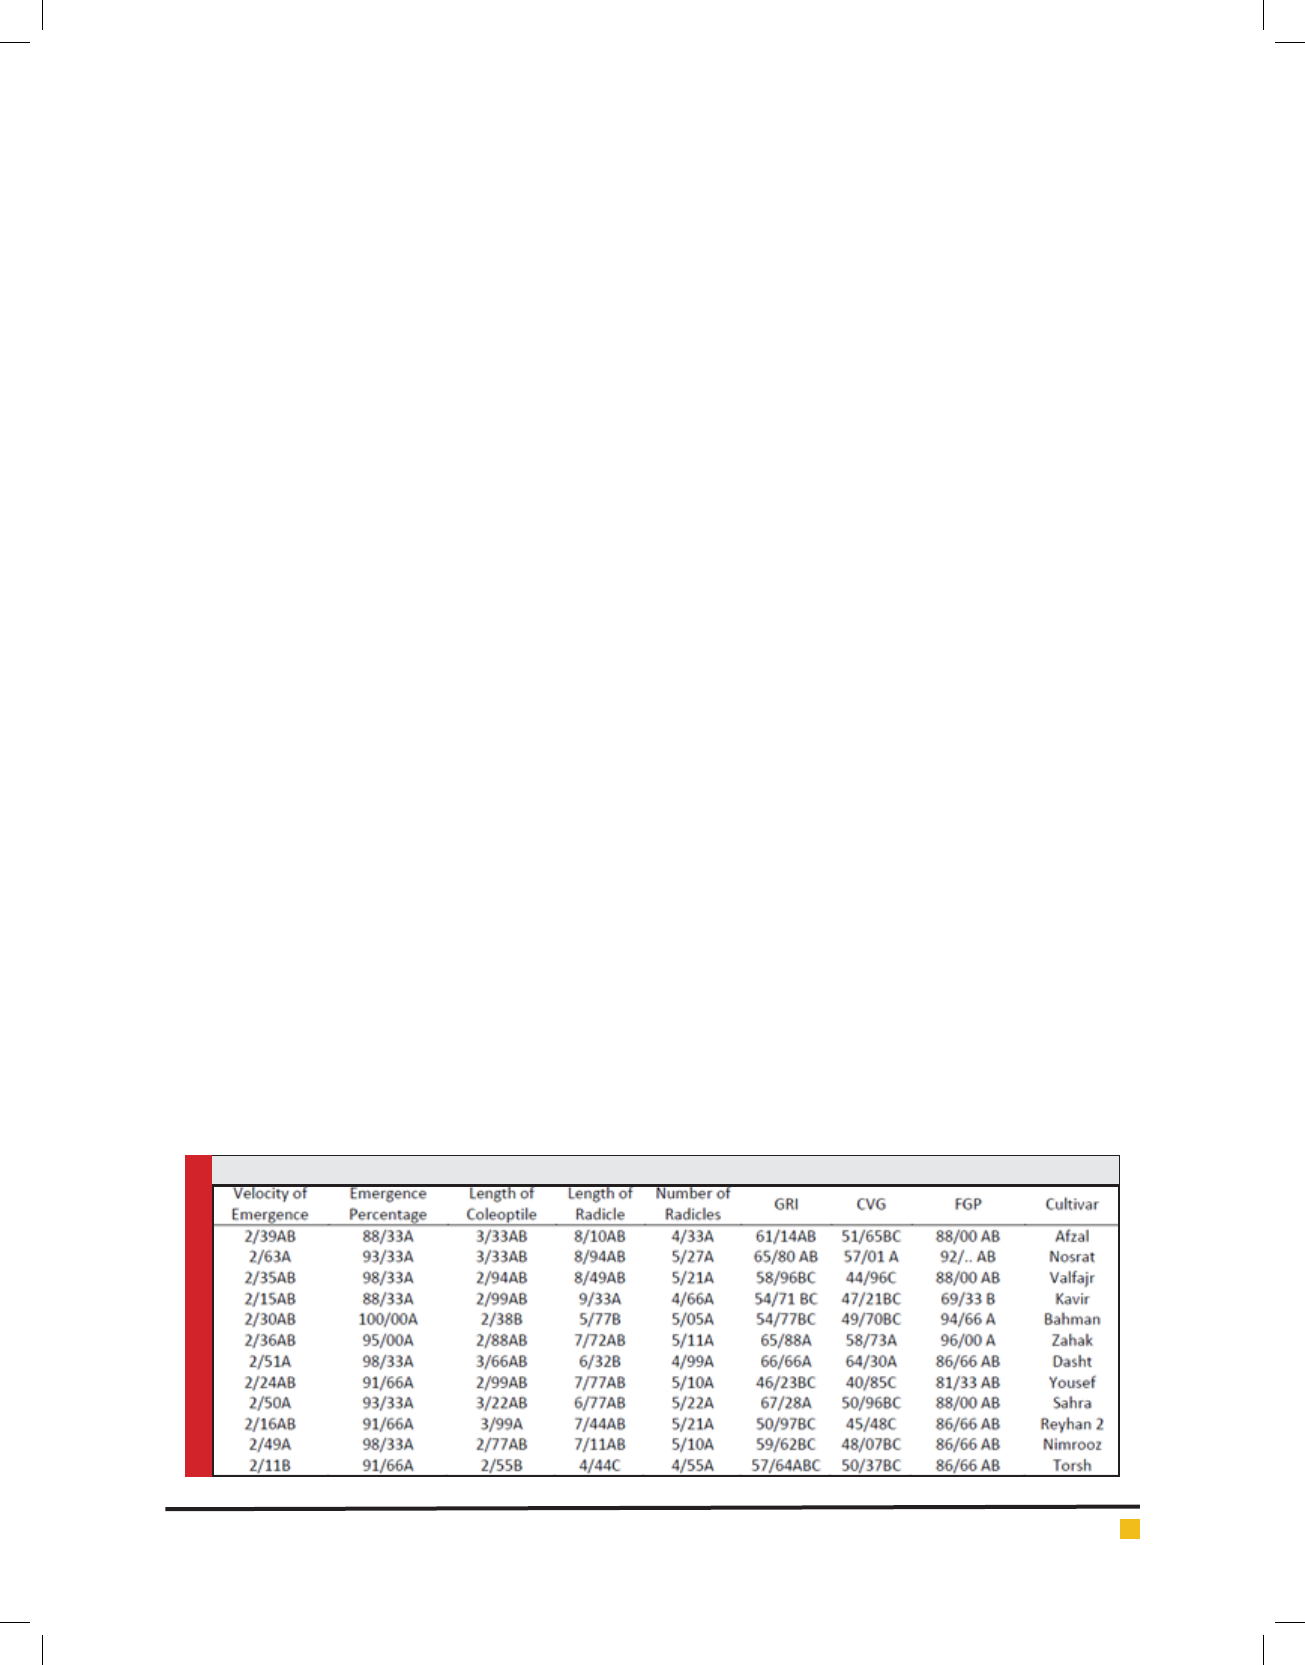
characteristics. In salinity stress level of 6 dS/m (Table
5), cultivar of Kavir had the lowest rate of the char-
acteristics and other cultivars with common letter of A
did not show any signi cant difference. In salinity stress
level of 12 dS/m (Table 6), cultivars of Reyhan 2 and
Afzal had the lowest rate of the characteristics and other
cultivars with common letter of A did not show any sig-
ni cant difference. In salinity stress level of 18 dS/m
(Table 7), cultivars of Afzal, Nosrat and Kavir had the
lowest rate of the characteristics and other cultivars with
common letter of A did not show any signi cant differ-
ence. Results from Mohammadi et al. (2011) showed that
the genotypes showed a signi cant difference at one
percent in confrontation with salinity stress. Generally
said, by the increase in salinity stress level, germination
percentage decreased.
Coef cient of Velocity of Germination
As it could be observed from Table 4, in without stress
level, cultivars of Bahman and Sahra, with common let-
ter of A were in the rst group and had the highest rate
of the characteristics. In salinity stress level of 6 dS/m
(Table 5), cultivars of Dasht, Zahak and Nosrat with
common letter of A were in the rst group and had the
highest rate of the characteristics. In salinity stress level
of 12 dS/m (Table 6), all 12 cultivars with common letter
of A did not show any signi cant difference. In salin-
ity stress level of 18 dS/m (Table 7), cultivars of Dasht,
Valfajr and Afzal with common letter of A did not show
any signi cant difference.
Germination Rate Index
As it could be observed from Table 4, in without stress
level, cultivars of Bahman, Sahra and Dasht, with com-
mon letter of A were in the rst group and had the high-
est rate of the characteristics. In salinity stress level of
6 dS/m (Table 5), cultivars of Sahra, Dasht, Zahak, Nos-
rat and Afzal with common letter of A were in the rst
group and had the highest rate of the characteristics.
In salinity stress level of 12 dS/m (Table 6), cultivars
of Bahman, Nimruz, Valfajr, Sahra, Torsh, Yousef and
Dasht with common letter of A had the highest rate of
the characteristics. In salinity stress level of 18 dS/m
(Table 7), cultivars of Valfajr, Dasht, Yousef, Sahra, Bah-
man and Zahak and Afzal with common letter of A had
the highest rate of the characteristics. Decrease in germi-
nation could be due to the osmatic effects or the toxicity
of salt or a combination of these two factors. In other
words, decrease or delay in emergence of seedling might
be due to the lack of the seed vigor in overcoming exter-
nal osmatic potential and also absorption of the required
water for the embryo (Khosh kholq et al., 2008).
Number of Radicles
As it could be observed from Table 4, in without stress
level, cultivars of Nimruz, Sahra, Nosrat, Valfajr, Dasht,
Yousef and Zahak, with common letter of A were in the
rst group and had the highest rate of the characteris-
tics. In salinity stress level of 6 dS/m (Table 5), all cul-
tivars with common letter of A showed no signi cant
difference. In salinity stress level of 12 dS/m (Table 6),
cultivars of Afzal, Zahak and Valfajr with common let-
ter of A were in the rst group and had the highest rate
of the characteristics. In salinity stress level of 18 dS/m
(Table 7), cultivars of Sahra, Nimruz, Dasht, Zahak and
BIOSCIENCE BIOTECHNOLOGY RESEARCH COMMUNICATIONS ASSESSMENT OF THE TOLERANCE OF VARIOUS CULTIVARS OF BARLEY 29
Table 5. Cultivars Means Comparison in Stress Level of 6 dS/m
Hagh, Shahbazi and Ghasemi
Bahman with common letter of A were in the rst group
and had the highest rate of the characteristics.
Length of Radicle
As it could be observed from Table 4, in without stress
level, cultivars of Valfajr, Nosrat, Bahman, Afzal, Kavir,
Dasht and Sahra, with common letter of A were in the
rst group. In salinity stress level of 6 dS/m (Table 5),
except for cultivars of Dasht, Bahman and Torsh, all
other cultivars with common letter of A were in the rst
group and had the highest rate of the characteristics.
In salinity stress level of 12 dS/m (Table 6), except for
cultivar Reyhan 2, all other cultivars with common let-
ter of A were in the rst group and had the highest rate
of the characteristics. In salinity stress level of 18 dS/m
(Table 7), except for cultivars of Nosrat and Kavir, all other
cultivars with common letter of A showed no signi cant
difference. In the study of Mohammad Youse et al. (2011),
cultivar mean comparison showed that cultivar of Reyhan
had the highest rate in length of radicle and cultivars of
Valfajr and Afzal did not have any signi cant difference.
Length of Coleoptile
As it could be observed from Table 4, in without stress
level, all cultivars, except for cultivar of Zahak, had
common letter of A and were in the rst group. Also,
in salinity stress level of 6 dS/m (Table 5), all cultivars,
except for cultivars of Bahman and Torsh, had common
letter of A and were in the rst group. However, cul-
tivars of Reyhan 2, Dasht and Afzal were in the rst
ranks. In salinity stress level of 12 dS/m (Table 6), cul-
tivars ofZahak, Afzal, Kavir, Nosrat, Dasht, Yousef and
Nimruz had the highest and cultivars of Sahra, Reyhan
and Torsh had the lowest rate of length of coleoptile.
In salinity stress level of 18 dS/m (Table 7), cultivars of
Yousef, Sahra and Dasht, had the highest rate of length
of coleoptile, although they were in the rst group with
the next 5 genotypes (with common letter of A).
Emergence Percentage
Considering the lack of signi cance in difference
between the cultivars in this characteristic, there was no
30 ASSESSMENT OF THE TOLERANCE OF VARIOUS CULTIVARS OF BARLEY BIOSCIENCE BIOTECHNOLOGY RESEARCH COMMUNICATIONS
Table 6. Cultivars Means Comparison in Stress Level of 12 dS/m
Table 7. Cultivars Means Comparison in Stress Level of 18 dS/m

Hagh, Shahbazi and Ghasemi
signi cant difference was found between all the stress
levels. While showing the negative effect of salinity
on the seedling emergence percentage, Taddayon and
Emam (2007) reported the highest and lowest seedling
emergence percentage in cultivars of Reyhan and Afzal.
They attributed this negative effect to the decrease in
the soil osmatic potential and presence of high rates of
sodium and chloride. Studies have showed that salinity
has a considerable inhibitory effect on emergence of the
seeds and this inhibitory effect is a signi cant limiting
factor for planting crops in saline lands.
Velocity of Emergence
As it could be observed from Table 4, in without stress
level, all cultivars, had common letter of A and there
was no signi cant difference found between the culti-
vars. In salinity stress level of 6 dS/m (Table 5), cultivars
of Nosrat, Dasht and Sahra had the highest velocity of
emergence, although they did not have any signi cant
difference with the next 8 cultivars (with common let-
ter of A. In this level, cultivars of Reyhan 2, Kavir and
Torsh had the lowest velocity of emergence. In the study
of Emam et al., (2013), the highest rate of velocity of
emergence in both desirable and saline conditions was
related to the cultivar of Nosrat, and it was signi cantly
higher than the other cultivars. In this research, the
highest rate of decrease in emergence and velocity of
emergence in the seedling under salinity stress was in
the cultivar of Shirin, while the lowest rate of decrease
in emergence and velocity of emergence in the seed-
ling under salinity stress were in cultivars of Nosrat and
Abolfazl, respectively. In salinity stress levels of 12 and
18 dS/M (Table 6 and 7), all 12 cultivars had the com-
mon letter of A and there was no signi cant difference
was found among them.
CONCLUSION
Analysis of variance results in characteristics showed
that salinity stress effect was signi cant on all charac-
teristics except for the seedling emergence in the pots.
The difference between barley cultivars was signi cant,
except in weight per hundred seeds, length of coleoptile
and percentage of emergence, which shows the genetic
diversity among the studied cultivars in their resistance
towards salinity stress. The interaction of cultivar ×
salinity was signi cant in characteristics of seed yield,
number of fertile tillers and number of grains per spike,
coef cient of velocity of emergence, germination rate
index, length of radicle and length of coleoptile, which
shows the different reaction of cultivars towards various
levels of salinity stress. The signi cance of the differ-
ence between cultivars in measured characteristics show
that studied cultivars have difference potentials and it is
possible to access genotypes with higher characteristics.
Crops are different in their resistance towards various
concentrations of salt in their root region. Hence, choos-
ing plants for the maximum production under salinity
stress will be among the most signi cant and useful
options (Khan et al., 1992).
REFERENCES
Bchini H, Bennaceur M, Sayar R, Khemira H and Benkaab-Bet-
taeib L. (2010). Genotypic differences in root and shoot growth
of barley (Hordeum vulgare L.) grown under different salinity
levels, Hereditas 147: 114–122.
Behnia. MR. 1997. Cold cereal, Tehran University Press.
Haung.J.and R.E.Redman.1995.Respouses of growth morphol-
ogy and anatomy. to salinity and calcium supply in cultivated
and wild barly.can.J.Bot.73:1859-1866.
Hosseini. E, Ra ei. N, Pirasteh-Anooshe. H. 2013. Early growth
response and concentrations of sodium and potassium ions in
ten varieties of barley (Hordeum vulgare L.) under salt stress.
Journal of Crop Physiology, 5 (19): 5-15.
Khan, M., Y. A. Rauf, I. Makhdoom, A. Ahmad, and S. M. Shah.
1992. Effects of saline sodic soils on mineral composition of
eight wheats under eld conditions. Sarhad Journal of Agri-
culture, 814: 477-486.
Khosh Kholgh. S, Nayer. A, Alitabar. R, EghbaliNezhad. M,
Babazadeh P, Tale-Ahmad. S. 2013.Effect of salinity on barley
germination and tolerance to salinity. Iran Agronomy Research
Journal, Volume 11, Issue 1: 107-120
Mass,E.V,and j,A.poss.1989b.sensitivity of cowpea to salt stress
at three growth stages Irrig.sci.10:313-320
Mohammadi, S. 2003. Physiological aspects of crop production
Salinity. PhD Thesis of Agronomy. Azad University, Science
and Research.
Mohammadi. M. N, Mehdinezhad S and Youse . M. 2011.
Evaluation of three varieties of barley drought tolerance in
germination stage. The rst national conference on agri-
cultural issues in modern Islamic Azad University Saveh
Branch.
Mohammad-Youse . M, Mehdinezhad. N and Mohammadi.
N. 2011. Evaluation of Salt Tolerance three varieties of barley
(Hordeum vulgaris L.) at germination stage. Proceedings of the
First National Conference on new issues in the Islamic Azad
University of Saveh Branch.
Motoaki Seki.,Mari Naeusaka., Junko Ishida., Tokihiko Nanjo.,
Miki Fujita., Youko Oono., Asako kamiya., Maiko Nakajima
Akiko Enju., Tetsuya Sakurai., Masakazu Satou. Kenji Akiy-
ama., Teruaki Taji., kazuko Yamaguchi- Shinozaki 2002.Moni-
toring the expression pro les of 7000 Arabidopsis genes under
drought, cold and high- salinity stresses using a full- Length
cDNA microarray.The plant Journal.31(3): 279-292.
BIOSCIENCE BIOTECHNOLOGY RESEARCH COMMUNICATIONS ASSESSMENT OF THE TOLERANCE OF VARIOUS CULTIVARS OF BARLEY 31

Hagh, Shahbazi and Ghasemi
Movafegh S, Razeghi Jadid R and Kiabi SH.2012. Effect of
salinity stress on chlorophyll content, proline, water soluble
carbohydrate, germination, growth and dry weight of three
seedling barley ( Hordeum vulgare L.) cultivars. Journal of
Stress Physiology & Biochemistry, 8 (4 ), pp. 157-168.
MovafeghS, Razeghi Jadid R and Kiabi Sh. (2012).Effect of salin-
ity stress on chlorophyll content, proline, water soluble carbo-
hydrate, germination, growth and dry weight of three seedling
barley (Hordeum vulgare L.) cultivars, Journal of Stress Physiol-
ogy & Biochemistry, Vol. 8 No. 4 2012, pp. 157-168
Pakniat, H., A. Kazemipour and G. A. Mohammadi. 2003. Vari-
ation in salt tolerance of cultivated ( Hordeum vulgare L.) and
wild ( H. spontanum C. KOCH) barley genotypes from Iran. Iran
Agric. Res. 22: 45-62.
Pakniat.H,A.Kazemipour and G.A. Mohamadi. 2003. Varia-
tion in salt.tolerance of cultivated (Hordeum vulgarel.) and
wild. (H.spontanum Koch) barley genotypes from exchange
and growth in wheat and barley grown in salt. Aust.J.plant
physoil.13:475-489.Iran.Iran Agr Res.22:45-62.
Pirasteh-Anosheh, H., Sadeghi H. and Emam, Y. 2011. The
effects of KNO3 and urea on germination, early growth, total
protein and proline content of four maize hybrids (Zea mays
L.) under drought and salt stress conditions. Journal of Crop
Science and Biotechnology 14: 289 - 295.
32 ASSESSMENT OF THE TOLERANCE OF VARIOUS CULTIVARS OF BARLEY BIOSCIENCE BIOTECHNOLOGY RESEARCH COMMUNICATIONS