Genetical
Communication
Biosci. Biotech. Res. Comm. 10(4): 732-738 (2017)
Red cell enzyme gene polymorphism in Gond tribe of
Madhya Pradesh
Deepak Bharti*
1
, Ruchira Chaudhary
2
and SMS Chahal
3
1
Department of Zoology, Govt. M.V.M., Af liated to Barkatullah University Bhopal, M.P.
2
Department of Zoology, Sarojini Naidu Govt. Girls Post Graduate College, Bhopal
3
Department of Human Biology, Punjabi University, Patiala Punjab
ABSTRACT
The present biochemical study is planned primarily to characterize genetically the Gond Tribe of Madhya Pradesh.
The blood samples for the present study were collected at random from a total of 200 apparently healthy and not
closely related individuals of either sex, of the Gond of Hoshangabad, Betul and Sehore districts of Madhya Pradesh.
The samples were analyzed for phenotypes of A1A2BO and Rh (D) blood groups by standard tube method and for Red
Cell Enzymes electrophoretic method.Typed Red Cell Enzymes were Adenosine Deaminase, Acid Phosphatase locus
1, Phosphoglucomutase locus 1, Esterase D, Adenylate kinase locus 1 and Glucosephosphate isomerase. A rare allele
ACP*C was recorded in Gond tribe despite the fact that it was totally absent not only in Keer of Betul, but also in
Korku of Pachmarhi Hoshangabad and Bhils of Jhabua . In case of GPI, rare variant (GPI*1-7) was recorded in Gond
Tribe of Hoshangabad of the State. There was great heterogeneity (h) values over the loci in the Gond material, vary-
ing from as low as 0.0304 at GPI locus to as high as 0.6244 at A1A2BO locus. Analysis of heterozygosity revealed
that in the Gond tribe GPI was the least variable locus and A1A2BO was the most variable locus. Genetic relationships
among the present Gond tribe and earlier studied Tribal and Caste Populations of Neighboring States of Gujarat and
Rajasthan shows that the Hindu and Muslim separated out from the Tribal population of neighboring States from
earlier stage of evolution. Rajasthan Bhil shows distant single line subcluster, the latter tribes were placed together
in an another subcluster. In addition all the Tribes of Gujarat and Madhya Pradesh shows close genetic af nities.
KEY WORDS: BIOCHEMICAL MARKERS, GENETIC POLYMORPHISM, GOND TRIBE, RED CELL ENZYMES
732
ARTICLE INFORMATION:
*Corresponding Author: deepgenetics@gmail.com
Received 21
st
Oct, 2017
Accepted after revision 10
th
Dec, 2017
BBRC Print ISSN: 0974-6455
Online ISSN: 2321-4007 CODEN: USA BBRCBA
Thomson Reuters ISI ESC and Crossref Indexed Journal
NAAS Journal Score 2017: 4.31 Cosmos IF: 4.006
© A Society of Science and Nature Publication, 2017. All rights
reserved.
Online Contents Available at:
http//www.bbrc.in/
DOI: 10.21786/bbrc/10.4/19

Deepak Bharti et al.
INTRODUCTION
The Scheduled Tribe population of the State is
15,310,000 as per 2011 Census, this constitutes 20.1 per-
cent of the total population (72,620,000) of the State.
Madhya Pradesh holds rst rank among all the other
states in terms of Scheduled Tribe population. The State
has a total of forty six (46) Scheduled Tribes (Census of
India, 2011). The Great tribal community mostly found
in dense forests of the central India is Gond, They are
widely spread in the Chhindwara, Betul and others dis-
trict of Madhya Pradesh, Bastar district of Chhattisgarh
and also in the parts of Maharashtra, Andhra Pradesh,
and Orissa. Gonds are one of the largest tribal group
in the world. The main dialect of Gonds is Gondi boli
which is related to Telugu and the other Dravidian lan-
guages. In the northern parts, Gonds are often seen
speaking Hindi and Marathi while in the southern parts
Parsi or Persian is the frequently used language. Gonds
are mainly divided into four tribes namely - Raj Gonds,
Madia Gonds, Dhurve Gonds, Khatulwar Gonds. Gonds
have been largely in uenced by the Hindus and for the
long time have been practicing the Hindu culture and
traditions.
A molecular study (Chaubey et al., 2017) based on allele
frequency and haplotype revealed that the Gond share
genetic ancestry with the Indian Austroasiatic (ie, Munda)
groups, rather than with different Dravidian groups to
whom they are most closely related linguistically and The
haplotype based analysis (Chaubey et al., 2015) suggested
the genome sharing Gond with among Bhil, Kol and with
other ethnic groups of South Asian descent.
Although, recently studies (Thakur and Singh 2017;
Sharma 2017) were done on Gond tribes but in present
investigation we have selected different most Gond tribe
populated districts of the state. The present biochemical
study was planned to characterize genetically the Gond
tribe. They are endogamous population groups, hav-
ing their own unique culture and language. Although
serological studies have been done on some tribes but
biochemical genetic markers are still to be examined.
There is no previous report on the extensive study of
blood genetic markers in Gond of Hoshangabad district
of Madhya Pradesh.
MATERIAL AND METHODS
The present genetic study was based on Biochemical
and Serological markers for which the blood samples
were collected at random from a total of 200 apparently
healthy and not closely related individuals of either sex,
of the Gonds of Hoshangabad, Betul and Sehore dis-
tricts of Madhya Pradesh. About 0.5 ml of blood sam-
ples were collected by nger prick method into EDTA-K
2
vials, kept in thermo cool icebox and transported to the
laboratory within 3-4 days. The samples were analyzed
for phenotypes of A
1
A
2
BO and Rh (D) blood groups by
standard tube method and for red cell enzymes by elec-
trophoresis (Bhasin M.K. and Chahal, S.M.S.,1996). For
this purpose haemolysates were prepared using freezing
and thawing method and stored at -20ºC in the freezer.
Prepared haemolysates were used for isoenzyme typing
by biochemical technique of electrophoresis and speci c
staining protocols. Typed red cell enzymes were Adeno-
sine Deaminase (ADA), Acid Phosphatase locus 1 (ACP1),
Phosphoglucomutase locus 1 (PGM1), Esterase D (ESD),
Adenylate kinase locus 1 (AK1) and Glucosephosphate
isomerase (GPI).
RESULTS AND DISCUSSION
The distribution of two blood groups and four biochemi-
cal markers in Gond tribe are presented in table 1. In
A
1
A
2
BO, the frequency of A
1
allele in Gond is found to
be 20.41% while a low value (7.05%) has been recorded
in Keer tribe (Bharti et al., 2007) but on the other hand
showed partial variation with the Gond tribe (17%) of
Anuppur and Dindori districts of MP (Thakur S. and
Singh H.S., 2017), whereas Bharti et al., (2007) reported
high incidence of allele B in Keer (33.68%) and low in
Gond (28.11%) were observed
.
The allele frequency of
A
1
in Gond is similar to that of Bhil (21.9%) and Gond
(20.1%) of Ambikapur district (Bhatia et al.,1986). On
comparison with the caste population, it revealed that,
the A
1
allele frequency of Gond tribe is greater than
Hindu (15.91%) and Muslim (18.39%) of Indore (Roberts
et al., 1974). The percentage frequency of A
2
allele in
Gond has been found to be 1.0 %, which is the low-
est recorded incidence in any tribal population, but it is
noteworthy that it is totally absent in Keer (Bharti et al.,
2007) while recorded high (2.0%) in Gond tribe of Anup-
pur and Dindori districts of Madhya Pradesh (Thakur
and Singh 2017). The distribution of allele frequencies
of allele O in Gond shows approximate similarity with
earlier data of the tribes. In case of Rh blood group,
only one case has been found to be Rh negative in Keer
of neighboring district Sehore while in Gond tribe four
cases has been recorded . In contrast to the caste popula-
tion of the State these frequencies are lower than those
recorded in Sunni (25.2%), Shia (27.7%), Bohra (28.28%)
and Brahmin (18.26%), endogamous group of Hoshang-
abad district (Khan et al., 1985).
The allele frequencies obtained after the electropho-
retic typing of the biochemical marker viz, Adenosine
Deaminase (ADA), Acid Phosphatase locus 1 (ACP1),
Phosphoglucomutase locus 1(PGM1), Esterase D (ESD),
Adenylate Kinase locus 1 (AK1) and Glucosephosphate
isomerase (GPI), are given in table 2, which shows great
BIOSCIENCE BIOTECHNOLOGY RESEARCH COMMUNICATIONS THE GENETIC VARIATION IN GOND TRIBE OF MP 733
Deepak Bharti et al.
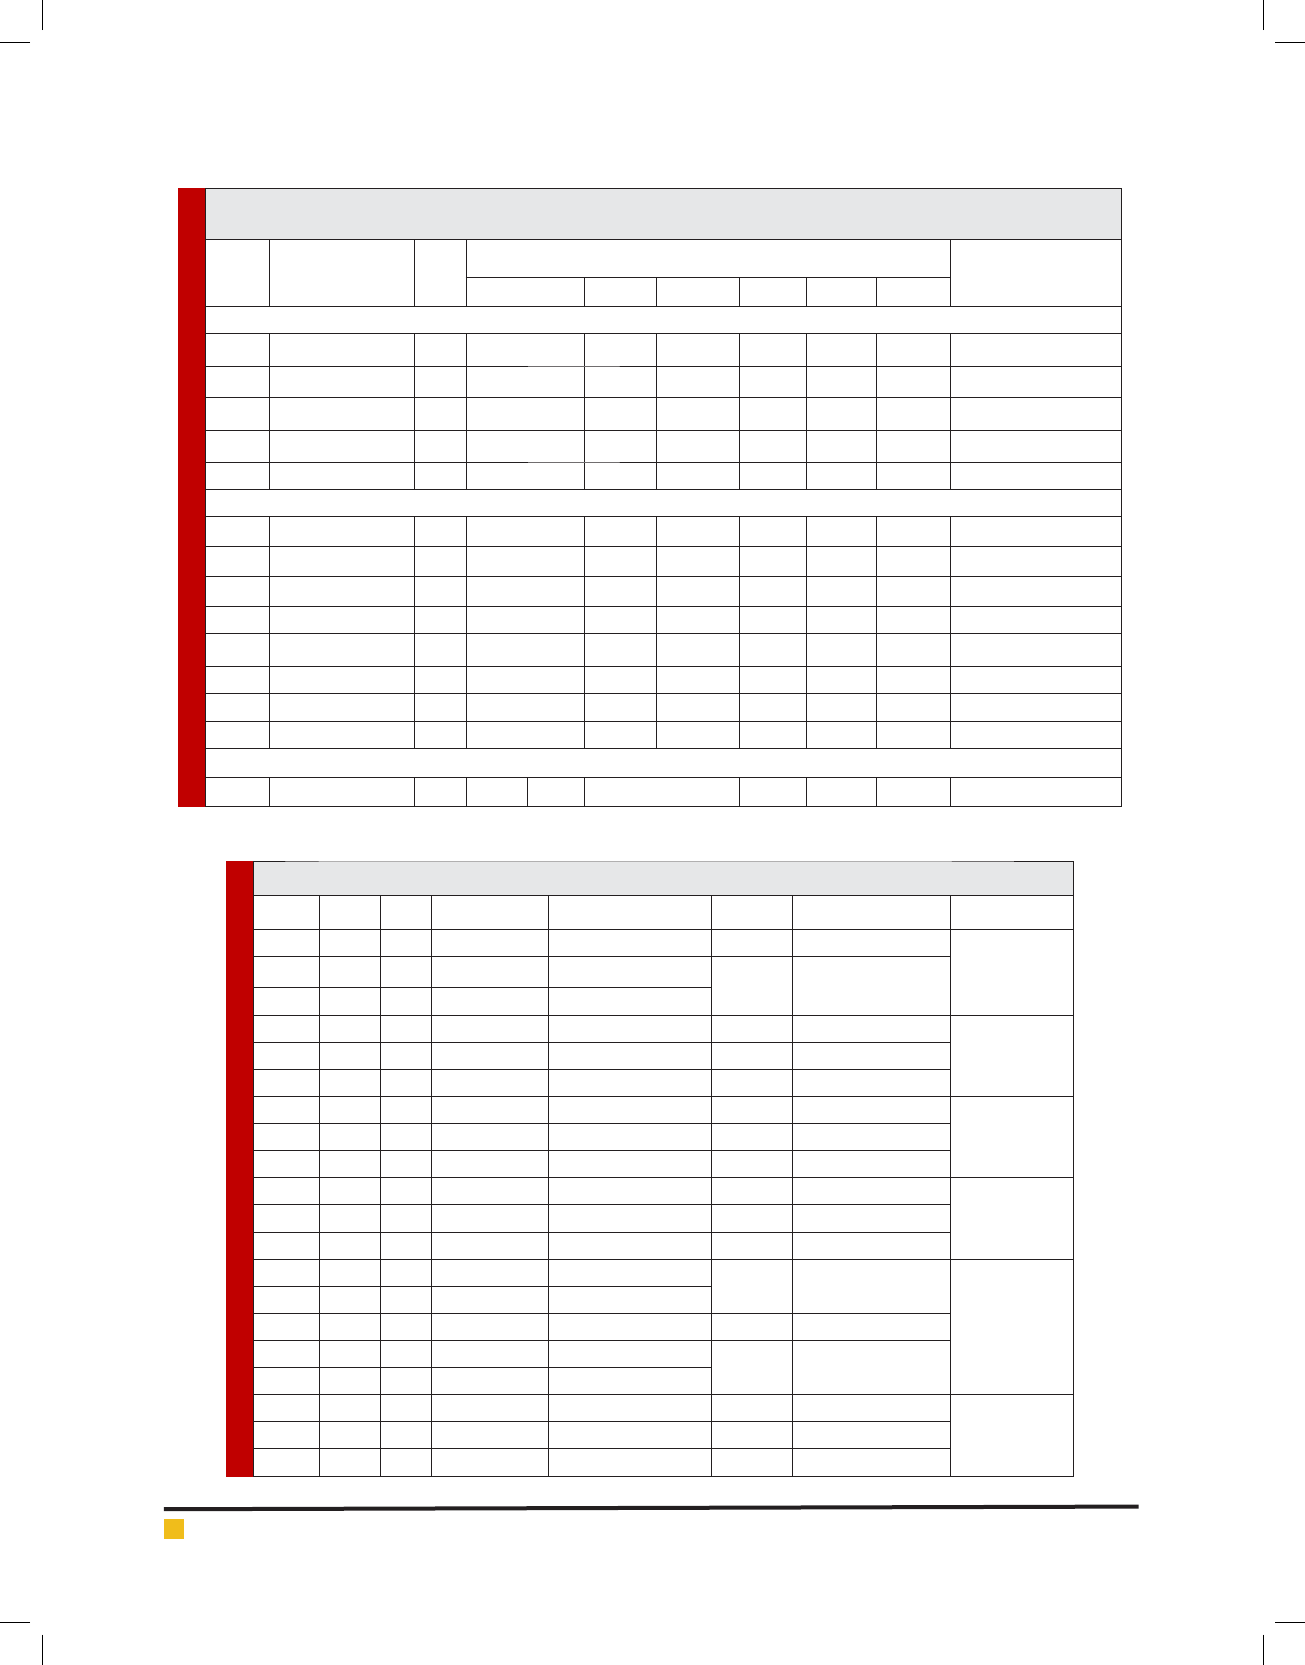
Table 1. Distribution of A1A2BO blood groups in various Scheduled Tribe and Non Tribal populations of Madhya
Pradesh and Neighboring States.
S. No.
NAME OF
POPULATION N
ALLELE FREQENCIES OF DIFFERENT BIOCHEMICAL GENES
REFERENCES
A1 A2 B O RHD RHd
MADHYA PRADESH
1. GOND 200 0.2041 0.01 0.2811 0.5048 0.8586 0.1414 Present study (n=200)
2. HINDU 175 0.167 0.0294 0.2503 0.5533 0.7732 0.2268 Roberts et al., 1974
3. MUSLIM 168 0.1869 0.033 0.2587 0.5214 0.8457 0.1543 Roberts et al., 1974
4. BHIL MP 145 0.219 0.025 0.221 0.535 0.8339 0.1661 Papiha et al., 1978
5. KEER 131 0.0705 0 0.3368 0.5926 0.9126 0.0874 Bharti et al., 2007
GUJARAT
6. VANIA SONI 267 0.1791 0.0138 0.2478 0.5593 0.703 0.297 Undevia et al., 1978
7. GHANCHI 58 0.255 0.051 0.254 0.44 0.7726 0.2274 Papiha et al., 1981
8. KUNBI 116 0.146 0.016 0.249 0.589 0.7543 0.2457 Papiha et al., 1981
9. ANAVIL 50 0.189 0.013 0.213 0.585 0.6536 0.3464 Papiha et al., 1981
10 MUSLIM GUJRAT 65 0.19 0.01 0.269 0.531 0.6962 0.3038 Papiha et al., 1981
11. VASAVA 71 0.22 0.013 0.185 0.582 0.7626 0.2374 Bhasin et al., 1985
12. KOTWALIA 102 0.158 0.019 0.315 0.508 0.7797 0.2203 Bhasin et al., 1985
13. GAMIT 261 0.282 0.031 0.227 0.46 0.7297 0.2703 Bhasin et al., 1985
RAJASTHAN
14. BHIL 92 0.14 0.027 0.231 0.602 0 0.2085 Kumar et al., 1999
Table 2. Distribution of Red cell Enzymes polymorphism in the Gond Tribe of Madhya Pradesh.
S. No. Gene n Phenotypes Number Observed Allele Allele frequencies 2 (H.-W.)
1. ADA 145 1 126 ADA*1 0.9345
0.003
1,2 19
ADA*2 0.0655
20
2. AK1 189 1 167 AK1*1 0.9418
0.003
1,2 22 AK2*2 0.0582
20
3. ESD 196 1 79 ESD*1 0.5995
1.040
1,2 77 ESD*2 0.4005
240
4. PGM1 196 1 94 PGM1*1 0.6856
0.087
1,2 78 PGM2*2 0.3144
222
5. ACP1 182 A 13
ACP1*A 0.2390
0.413
A,B 60
B106ACP1*B 0.7527
A,C 1
ACP1*C 0.0083
B,C 2
6. GPI 195 1 189 GPI*1 0.9846
-
1,3 5 GPI*3 0.0128
1,7 1 GPI*7 0.0026
734 THE GENETIC VARIATION IN GOND TRIBE OF MP BIOSCIENCE BIOTECHNOLOGY RESEARCH COMMUNICATIONS
BIOSCIENCE BIOTECHNOLOGY RESEARCH COMMUNICATIONS THE GENETIC VARIATION IN GOND TRIBE OF MP 735
Deepak Bharti et al.
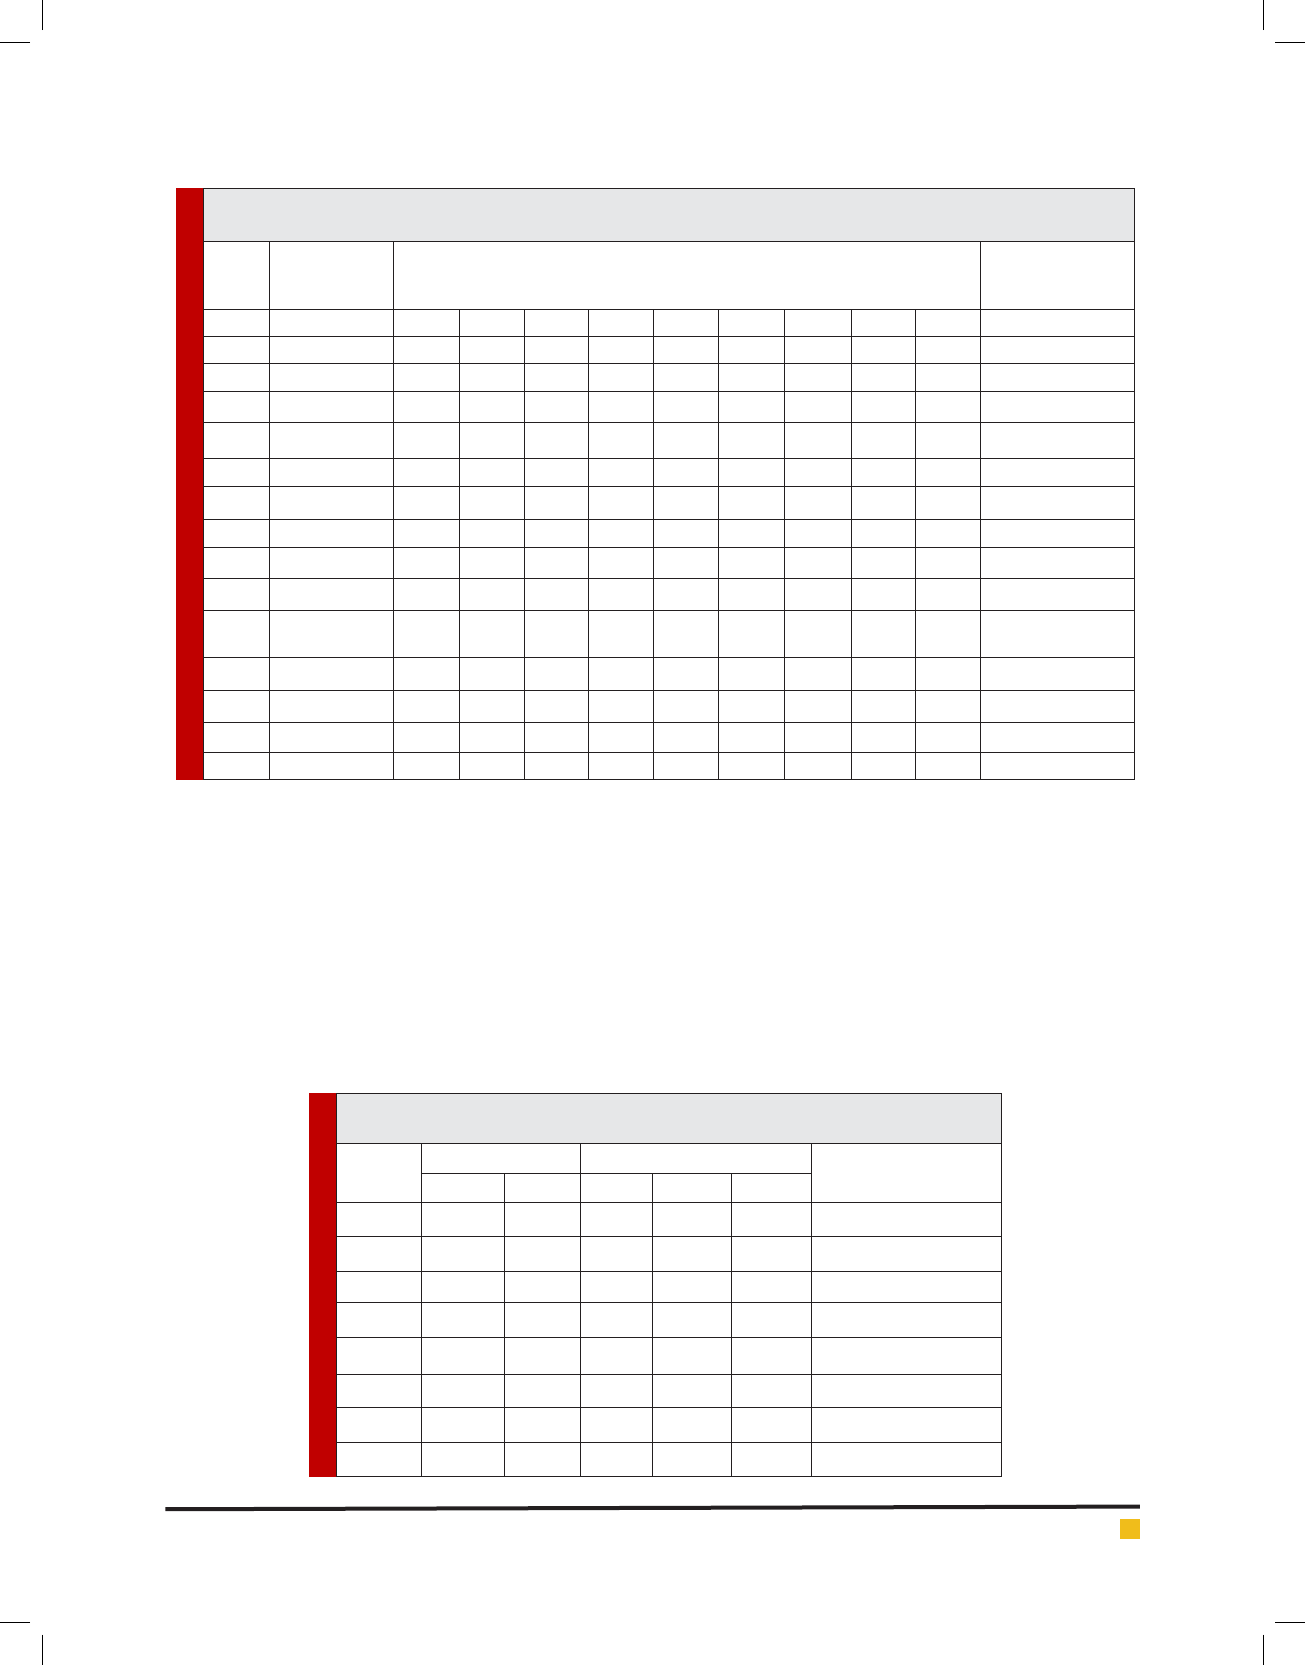
Table 4. Heterozygosity (h) estimates in the present tribe and earlier studied Caste
populations of Madhya Pradesh.
Locus
Caste Scheduled Tribe
Locus-wise Average
heterozygosity (H)
Muslim Hindu Gond Bhil Keer
A1A2BO 0.6297 0.6028 0.6244 0.6163 0.5304 0.6007
RH(D) 0.2610 0.3507 02428 0.2770 0.1595 0.2582
ADA - - 0.1224 - 0.1909 -
AK1 0.1768 0.1784 0.1096 0.0793 0.1909 0.1470
ESD - - 0.4802 0.3283 0.3986 -
PGM1 0.3982 0.4012 0.4311 0.4166 0.2535 0.3801
ACP1 0.4451 0.4319 0.3763 0.3192 0.4410 0.4027
GPI - - 0.0304 - 0.0076 0.0127
Table 3. Distribution of Allele frequencies of Red Cell Isozymes in various tribal and non tribal
populations of Madhya Pradesh and neighboring states.
S. No.
NAME OF
POPULATION
ALLELE FREQENCIES OF DIFFERENT BIOCHEMICAL GENES REFERENCES
AK1 AK2 ESD1 ESD2 PGM1 PGM2 ACPA ACPB ACPC
1 GOND 0.9418 0.0582 0.5995 0.4005 0.6856 0.3144 0.239 0.7527 0.0083 Present study
2 HINDU 0.901 0.099 0 0 0.7241 0.273 0.3103 0.6868 0.0029 Roberts et al., 1974
3 MUSLIM 0.902 0.098 0 0 0.7256 0.2744 0.3282 0.6687 0.0031 Roberts et al., 1974
4 BHIL MP 0.9586 0.0414 0.793 0.207 0.7042 0.2958 0.1993 0.8007 0 Papiha et al., 1978
5 KEER 0.8931 0.1069 0.8931 0.1069 0.8511 0.1489 0.3228 0.6712 0 Bharti et al., 2007
6 VANIASONI 0.8774 0.1226 0.8452 0.1548 0.6502 0.3498 0.2595 0.7405 0 Undevia et al., 1978
7 GHANCHI 0.956 0.044 0.873 0.127 0.634 0.357 0.364 0.646 0 Papiha et al., 1981
8 KUNBI 0.918 0.082 0.811 0.189 0.665 0.326 0.274 0.713 0.013 Papiha et al., 1981
91 ANAVIL 0.928 0.072 0.84 0.16 0.714 0.286 0.357 0.643 0 Papiha et al., 1981
10
MUSLIM
GUJRAT
0.918 0.082 0.815 0.185 0.667 0.325 0.254 0.738 0.008 Papiha et al., 1981
11 VASAVA 0.923 0.077 0.773 0.227 0.758 0.242 0.103 0.862 0.035 Bhasin et al., 1985
12 KOTWALIA 0.977 0.023 0.908 0.092 0.82 0.18 0.244 0.722 0.033 Bhasin et al., 1985
13 GAMIT 0.965 0.035 0.866 0.134 0.673 0.327 0.265 0.721 0 Bhasin et al., 1985
14 BHIL RAJ. 0.889 0.111 0.793 0.207 0.759 0.241 0.259 0.741 0 Kumar et al., 1999
variations. From the six enzymes studied, four enzyme
systems (ADA, PGM1, ESD and AK1) showed common
phenotypes, while in ACP1 a rare allele ACP*C was
recorded in Gond tribe despite the fact that it was totally
absent not only in Keer of Betul, but also in Korku of
Pachmarhi Hoshangabad (Saha et al., 1987) and Bhils of
Jhabua (Papiha et al., 1978). In case of GPI, rare vari-
ant (GPI*1-7) was recorded in Gond Tribe of Hoshang-
abad of the state. The comparison of allele frequencies
of Gond tribe with other caste and tribal populations of
the state is shown in table 3. The allele frequencies of
ADA*1 (0.9345), PGM1*1(0.6856), ACP1*A (0.239) and
AK1*1 (0.9417) in Gond are approximately similar from
Bhil of Jhabua {ADA*1 (0.921), PGM1*1(0.704), ACP1*A
(0.201) and AK1*1 (0.959)} (Papiha et al., 1978).
HETEROZYGOSITY (H)
Table 4 shows the locus–wise and population–wise
estimates of heterozygosity (h) in the Gond and erlier
studied caste and tribal populations of Madhya Pradesh.
There was great heterogeneity in h values over the loci
736 THE GENETIC VARIATION IN GOND TRIBE OF MP BIOSCIENCE BIOTECHNOLOGY RESEARCH COMMUNICATIONS
Deepak Bharti et al.
Table 5. Genetic differentiation in the present studied Gond tribe and earlier studied Tribal and Castes
population of Madhya Pradesh – estimates by Nei’s GST.
Genetic
locus
Gene diversity in
total population
(H
T
)
Intra-subpopulational
gene diversity
Inter-subpopulational
gene diversity
Coef cient of gene
differentiation
(G
ST
)
(H
s
)(D
ST
)
A1A2BO 0.6041727 0.5997652 0.0044075 0.0072951
RH(D) 0.2622226 0.2582126 0.00401 0.01529235
AK1 0.1483750 0.1446447 0.0037303 0.025141027
PGM1 0.3869012 0.3805439 0.0063573 0.01643132
ACP1 0.40892743 0.4035656 0.00536183 0.013111935
Average 0.362119786 0.3573464 0.004773386 0.013181787
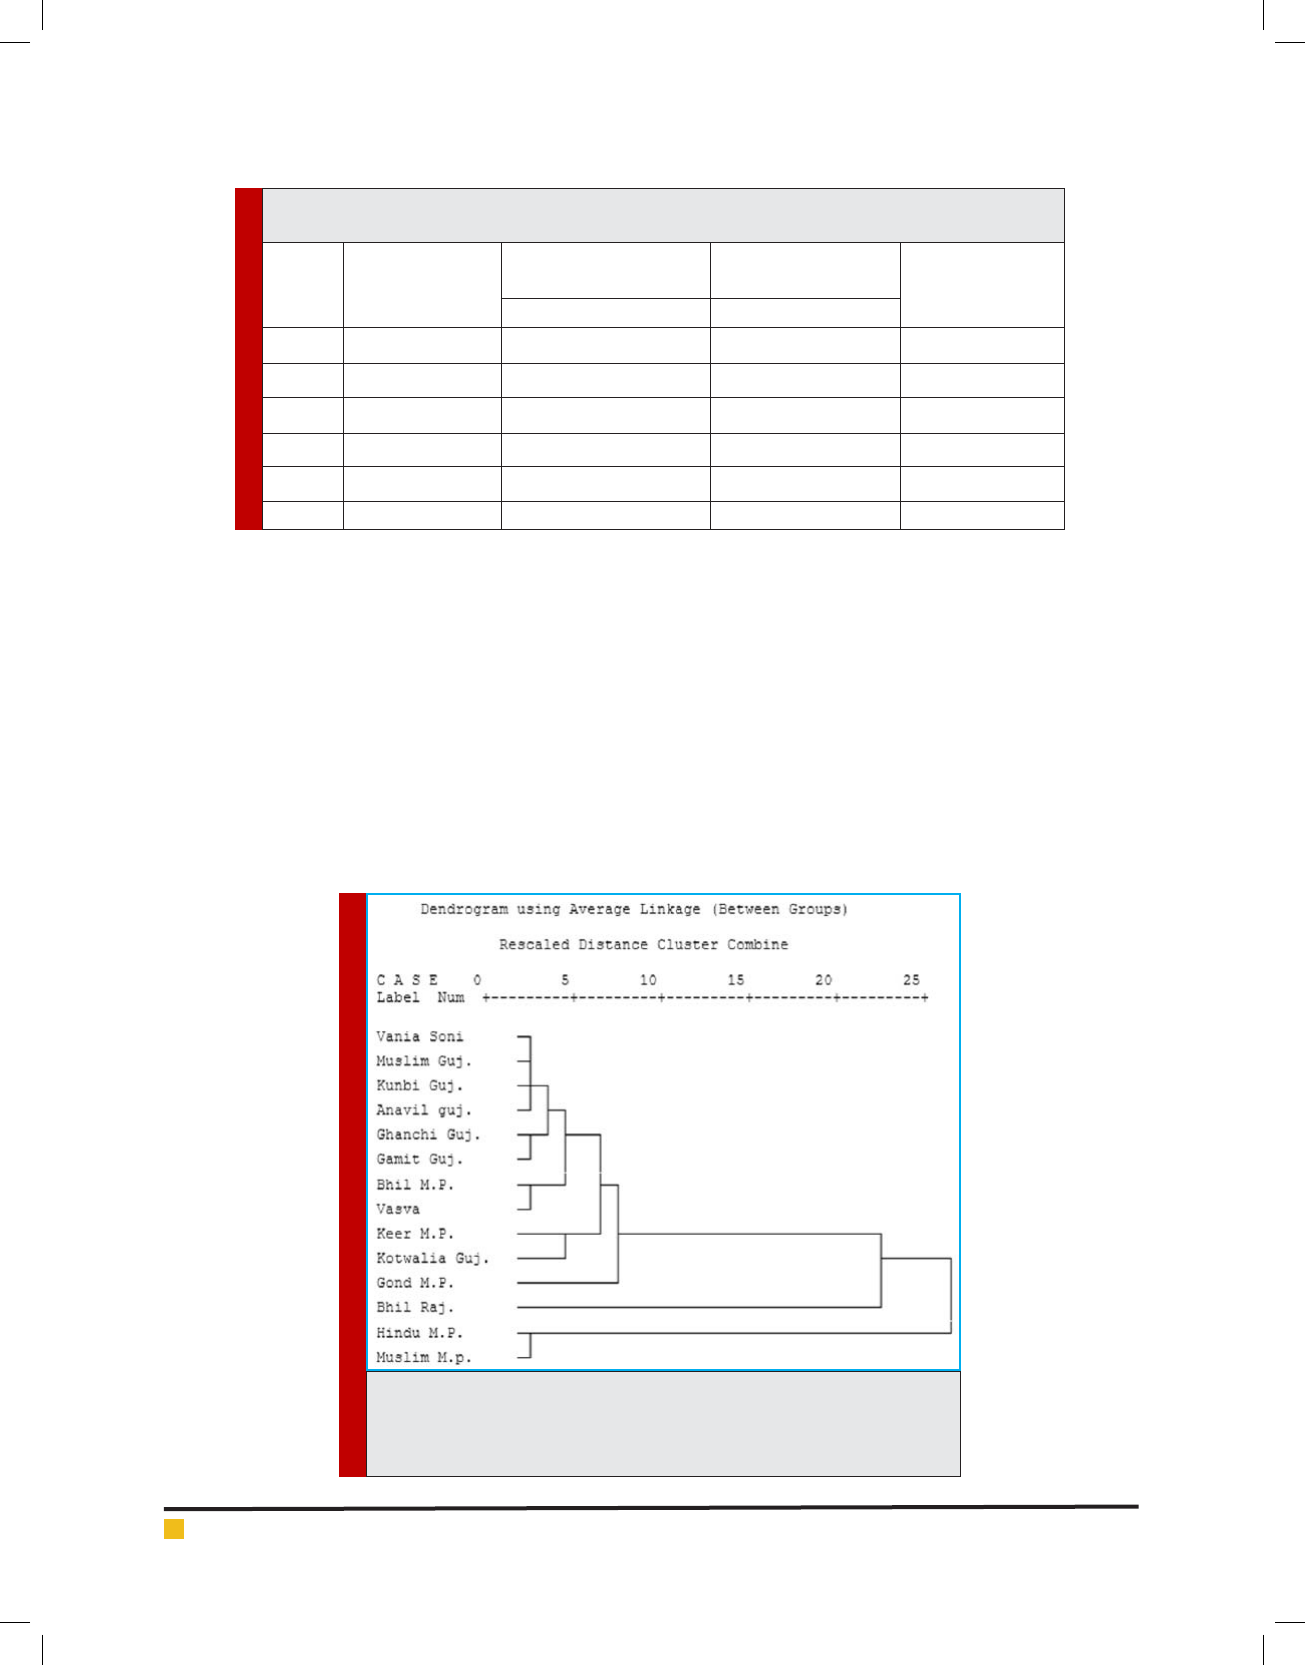
FIGURE 1. Dendrogram showing genetic relationships among the present
Tribe Gond of Madhya Pradesh and various Scheduled Tribe and Non tribal
populations of the state and neighboring states of Gujarat and Rajasthan
based.
in the Gond material, varying from as low as 0.0304 at
GPI locus to as high as 0.6244 at A1A2BO locus. Thus,
analysis of heterozygosity, a measure of genic variation,
revealed that in the present Scheduled Tribe material
GPI was the least variable locus and A1A2BO was the
most variable locus.
NEI’S GENE DIVERSITY ANALYSIS
Estimates of the various measures of gene diversity (Nei,
1973) viz., H
T
, H
S
and G
ST
among (Based on ve loci) the
present Tribe and earlier studied populations of Madhya
Pradesh are set out in Table 5. The table shows that the
intra–subpopulational gene diversity (H
S
) varied widely
(range 0.1446447 at AK1 locus to 0.5997652 at A1A2BO
locus). As for the inter–subpopulational gene diversity
(D
ST
), it ranged from a low of 0.0037303 at AK1 locus to
a high of 0.0063573 at PGM1 locus. Thus, it is clear that
the gene diversity between populations (0.004773386)
was much lower than the gene diversity within them
(0.357364). As for the coef cient of gene differentia-
tion (G
ST
), the values were quite variable over loci (range
0.0072951 – 0.02514102 ), A1A2BO being the least dif-
ferentiated locus and AK1 being the most differentiated
locus among the Tribal and Caste populations of Mad-
hya Pradesh (Table 5).
BIOSCIENCE BIOTECHNOLOGY RESEARCH COMMUNICATIONS THE GENETIC VARIATION IN GOND TRIBE OF MP 737
Deepak Bharti et al.
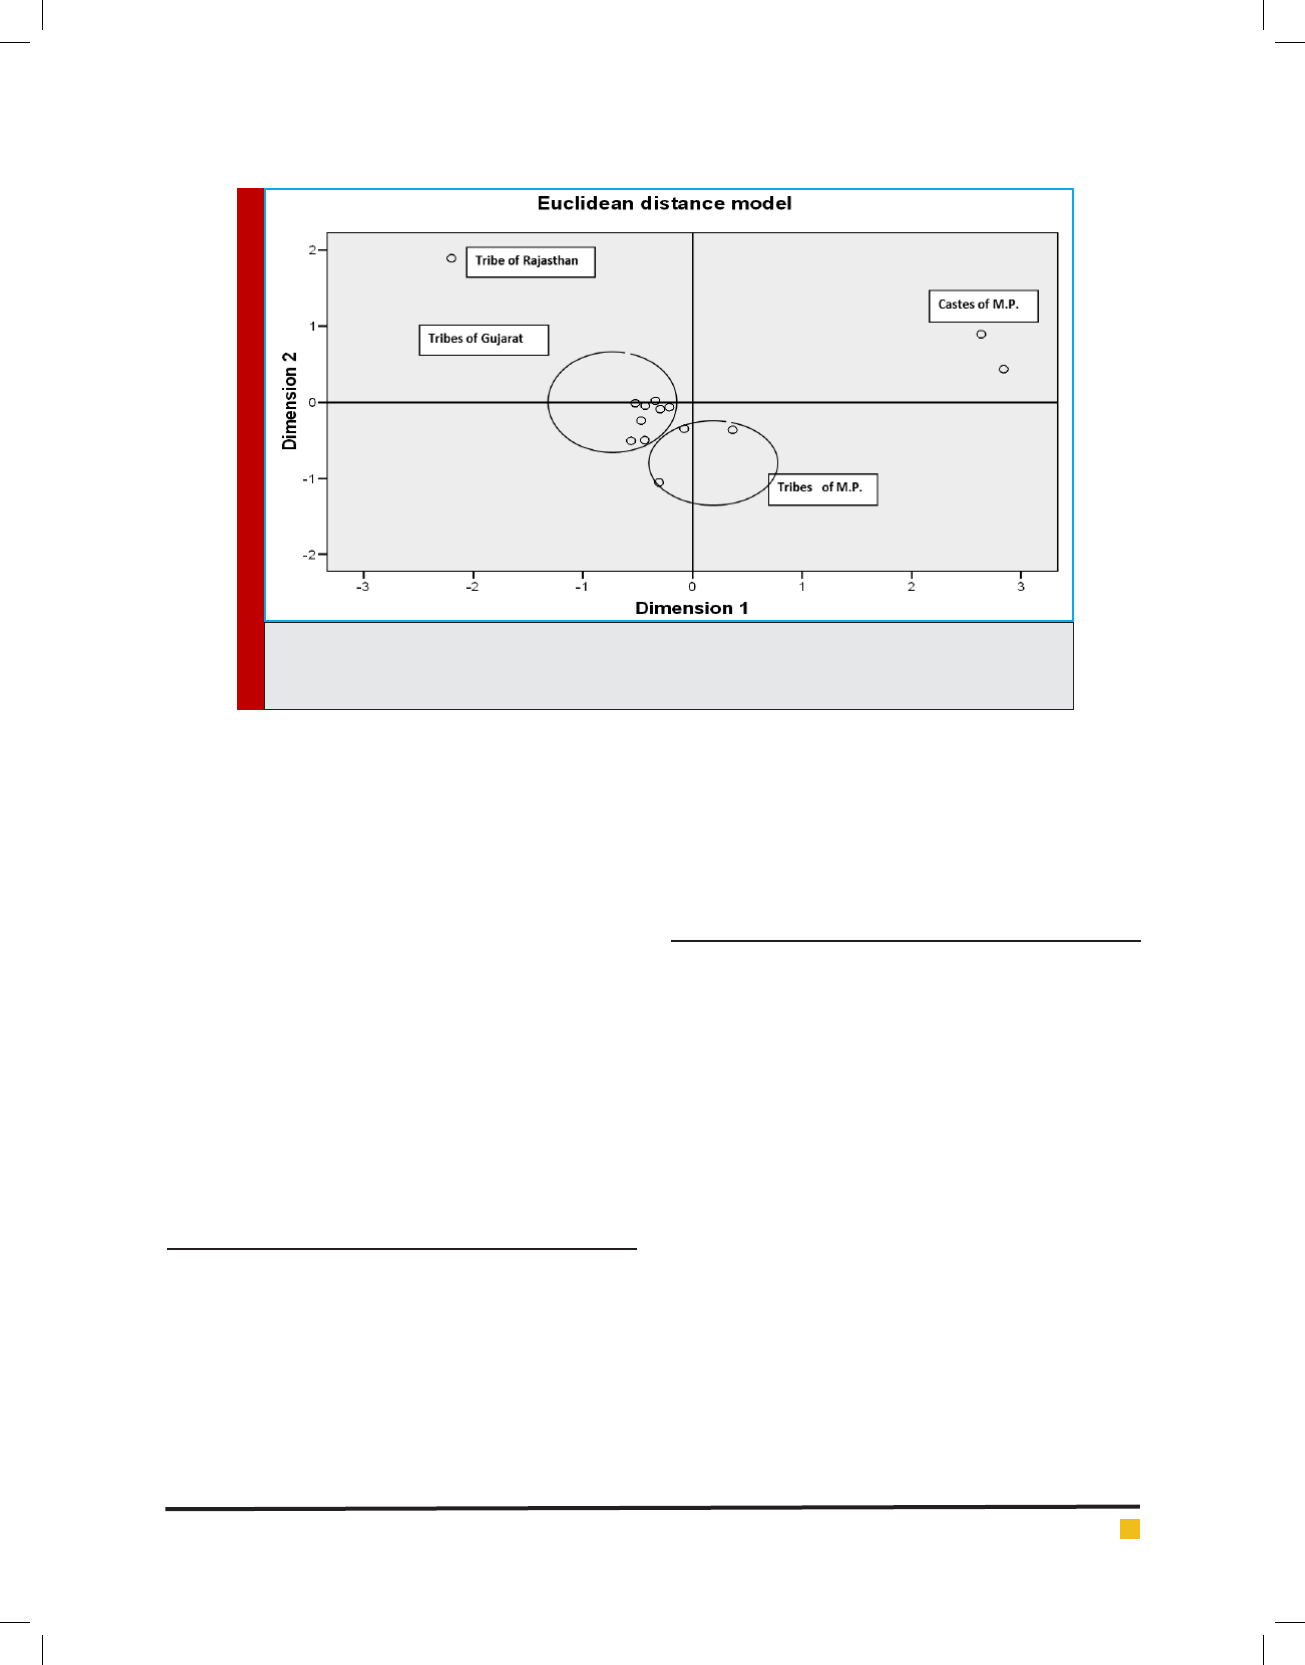
Nei’s genetic distance (D) and Eulclidean model
analysis
Genetic relationships among the present studied
Gond tribe and earlier studied tribal and Caste Popu-
lations of Neighboring States of Gujarat (Papiha et al.,
1981; Bhasin et al.,1985 and Undevia et al., 1978) and
Rajasthan (Kumar et al.,1999) presented in gure 1 and
2 (Based on Six common Genetic Markers). These gures
show that the Hindu and Muslim separated out from the
Tribal population of all the studied States. Rajasthan
Bhil showed a single line subcluster, the latter tribes
were placed together in an another subcluster. In edi-
tion all the Tribes of Gujrat and Madhya Pradesh showed
close genetic af nities. The chi square (
2
) test depicted
that serological and biochemical ( ADA, PGM1, ACP and
AK1) markers are in genetic equilibrium as the differ-
ences between observed and expected frequencies are
statistically not signi cant, except for ESD where the
(
2
) value is statistically signi cant.
CONCLUSION
The present serological markers study concludes with
the low incidence of A
1
allele and high of B and pres-
ence of A
2
allele in few cases of Gond of Hoshangabad
District. On the other hand Rh negative allele was found
higher in Gond. In Biochemical trait, presence of less
common phenotype in ACP i.e. ACP*C and GPI (GPI*7)
were recorded The allele frequencies of ADA, PGM1,
ACP1 and AK1 indicate closeness between Gonds of
Hoshangabad, Bhil and Korku of Hoshangabad district
of M.P. (Pachmarhi) but different from Keer of neigh-
boring district. Gond tribe has genetic af nities with
tribes of M.P. and Gujarat but great distance showed
against Caste population of M.P. and tribal population
of Rajasthan. The present study will help to characterize
genetically the Gond tribe of Madhya Pradesh.
ACKNOWLEDGEMENTS
Authors acknowledge gratefully to the subjects who
voluntarily donated their blood samples for this study.
We are also thankful to the authorities of Department
of Zoology, Govt. M.V.M., Bhopal and Department of
Human Biology, Punjabi University, for providing their
lab facilities in this study.
CONFLICT OF INTEREST
None, all authors equally contributed to this research work
REFERENCES
Census of India. (2011). Basic data sheet [table]. Available at
Census 2011 - Madhya Pradesh
Chaubey, G., Tamang, R., Pennarun, E., Dubey, P., Rai, N., Upad-
hyay, R.K., Meena, R.P., Patel, J.R., van Driem, G., Thangaraj,
K. and Metspalu, M.(2017) Reconstructing the population his-
tory of the largest tribe of India: the Dravidian speaking Gond
European. Journal of Human Genetics Issue/Volume: in press.
Chaubey, G., Kadian, A., Bala, S., & Rao, V. R. (2015). Genetic
Af nity of the Bhil, Kol and Gond Mentioned in Epic Rama-
yana. PLoS ONE, 10(6)
FIGURE 2. The Euclidean distance Tribes of Madhya Pradesh and various Scheduled Tribe and non tribal
populations of the neighboring states of Gujarat an Rajasthan based on 6 common markers (A1A2BO,
RH(D), AK1, ESD, PGM1, ACP1).

738 THE GENETIC VARIATION IN GOND TRIBE OF MP BIOSCIENCE BIOTECHNOLOGY RESEARCH COMMUNICATIONS
Deepak Bharti et al.
Thakur S and Singh HS. (2017) Distributions of A1A2BO and
Rh blood group among Gonds and Panikas of Madhya Pradesh.
The Anthropologist.,Volume 18, Pages 1123-1124
Sharma S (2017) Genetic Variation of ABO Blood Groups
among Three Endogamous Tribal Populations of Chhattisgarh,
Central India. The Anthropologist Pages 765-766.
Bhasin M.K. and Chahal, S.M.S. (1996) A Laboratory Manual
for Human Blood Analysis. Kamla-Raj Enterprises, Delhi.
Bharti D, Chaudhary R, Chahal S.M.S. and Sharma G ,(2007)
The distribution of serological and biochemical markers in the
Keer tribe of the Madhya Pradesh .Asian J.Exp.Sci.,Vol. 21, No.
2, 337-340.
Bhatia, H.M., Rao, V.R., Vasantha, K., Sathe, M.S. and Mishra,
R.P.(1986) A
1
A
2
BO, MN, Rh blood groups among Gond, Oeaon
and Kawar tribal groups of Ambikapur district, Madhya
Pradesh. J. Ind. Anthrop. Soc., 21: 73-77.
Roberts, D.F., Papiha, S.S., Green, C.K., Chhaparwal, B.C. and
Mehta, S. (1974) Red cell enzyme and other polymorphic system
in Madhya Pradesh, central India. Ann. Hum. Biol., 1:159-174.
Khan, M.F.H., Khatoon, S., Choube, R. and Balakrishnan,
V. (1985) Relationship among three Muslim and one Hindu
endogamous groups of Madhya Pradesh. 1. Genetic distance
analysis. Acta Anthropogenet., 9: 214-224.
Saha, N. and Goswami, H.K.(1987) Some blood genetic markers
in Korkus of Central India. Hum. Hered., 37: 273-277.
Papiha, S.S., Roberts, D.F.Mukerjee, D.P., Singh, S.D. and Mal-
hotra, M. (1978) A genetic survey in the bhil tribe of Mad-
hya Pradesh, Central India. Am. J. Phys. Anthrop. 49: 176-
185.
Papiha, S.S., Roberts, D.F., Shah, K.C. and Shah, A.C. (1981)
A genetic study of some Gujarat populations. Acta Anthropo-
genet. 5: 23-40.
Bhasin, M.K., Singh, Indera P., Sudhakar, K., Bhardwaj, V.,
Chahal, S.M.S., Walter, H. and Dannewitz, A. (1985) Genetic
studies in four tribal populations of the Surat district , Gujarat
(India). Ann. Hum.Biol. 12: 27-39.
Undevia, J.V., Balakrishnan, V., Kirk, R.L., Blake, N.M., Saha, N.
and McDermid, E.M. (1978) A population genetic study of the
Vania Soni in western India. Hum. Hered. 28 : 104-121.
Kumar, S., Kushwaha, K.P.S., Rao, M.B. and Bhasin, M.K.(1999)
Serogenetic characterization of the Bhil tribe of Rajasthan.
Anthropologist 1 : 57-60.