
Environmental
Communication
Biosci. Biotech. Res. Comm. 10(4): 662-671 (2017)
Trend step changes of seasonal and annual precipitation
over Kermanshah during a 60-year period using
non-parametric methods
Amir Hossein Hashemian,
1,3
Mansour Rezaei,
2,3
* Hajar Kashe ,
3
Meghdad Pirsaheb
1,4
and
Hassan Kharajpour
5
1
Research Center for Environmental Determinants of Health (RCEDH), Kermanshah University of Medical
Sciences, Kermanshah, Iran
2
Social Development and Health Promotion Research Centre, Kermanshah University of Medical Sciences,
Kermanshah, Iran
3
Department of Biostatistics, Faculty of Health, Kermanshah University of Medical Sciences, Kermanshah, Iran
4
Department of Environmental Health, Faculty of Health, Kermanshah University of Medical Sciences,
Kermanshah, Iran
5
PhD student of Meteorology, Department of Geography, University of Kharazmi, Tehran, Iran
ABSTRACT
One of the approaches usedtoinvestigate trend step changes in precipitation isstatistical techniques.The main objective ofthis paper is
toidentify and analyze thetrend ofchanges in annual and seasonalprecipitation overthe studied area.The current study employs monthly
precipitation data from 1951 to 2010 derived from a weather station in Kermanshah. Using non-parametric Mann-Kendall test and
graphic based methods depicting total annual and seasonal (cold and warm seasons) precipitation, the research analyzes trend changes
of Kermanshah over different time series. Primarily, data changes in studied seasons and years are analyzed. Then, type and time of these
changes are identi ed. Averages of monthly precipitation overKermanshah during warm and cold seasons are determined as 47.9±33.64
Mm and 169.68±54.56 Mm, respectively. There is no signi cant trend in annual precipitation over Kermanshah. Analysis of averages
precipitation of warm and cold seasons indicates no signi cant trend; however, warm season seems to follow a decreasing trend in
general. Yet, there are leaps in the average levels of both annual and seasonal precipitation. The obtained results show that general trend
of change in average precipitation during warm seasons is downward with leaps of average during the studied period. But, in general,
there is no signi cant trend of change in the averages of annual and seasonal precipitation during the studied time.
KEY WORDS: CHANGES OF PRECIPITATION, TREND ANALYSIS, ANNUAL, SEASONAL, KERMANSHAH, NON-PARAMETRIC MANN-KENDALL
TEST
662
ARTICLE INFORMATION:
*Corresponding Author: rezaei39@yahoo.com
Received 22
nd
Oct, 2017
Accepted after revision 27
th
Dec, 2017
BBRC Print ISSN: 0974-6455
Online ISSN: 2321-4007 CODEN: USA BBRCBA
Thomson Reuters ISI ESC and Crossref Indexed Journal
NAAS Journal Score 2017: 4.31 Cosmos IF: 4.006
© A Society of Science and Nature Publication, 2017. All rights
reserved.
Online Contents Available at:
http//www.bbrc.in/
DOI: 10.21786/bbrc/10.4/8

Amir Hossein Hashemian et al.
INTRODUCTION
Precipitation is the most important input data in hydro-
logical cycle which needs to be considered mostly in
runoff, drought, groundwater, ood and sediment stud-
ies. Now a day, global warming, caused by increasing
greenhouse gases, and its effect on climate change is
a scienti c fact accepted by many researchers. Almost
all processes in the biosphere are affected by climate
change and the effect of this phenomenon on the envi-
ronment and water resources is a matter of great con-
cern. In order to be prepared against adverse effects of
climate change and to reduce its resulting damages, it is
necessary to study common trends of change in weather
variables in each area so as to adopt proper policies
and plans for development and management ofwater
resources Katirai et al., (2007) Aziz and Burn (2006) and
Chen et al., (2007).
To detect trends of weather variables in different time
intervals various test may be used which can be divided
into two groups: parametric and non-parametric tests.
Parametric tests have more trend analysis potentials than
non-parametric tests and require random (independent)
data with normal distribution. On the other side, non-
parametric tests are consistent with random data and
are not sensitive to normal distribution. Mann-Kendall
and Spearman are examples of these tests used in trend
analysis of weather variables.
In general, trend analysis of climate change, changes
in precipitation trend in particular, is among issues that
have been considered by researchers of climate and
hydrology science, in recent years. Regardless of climate
status of a region (wet or dry), precipitation trend analy-
sis of a region may aid executives and managers asso-
ciated with water issue to make better decisions about
implementation of future development projects. Consid-
ering that large parts of Iran is located in belt of arid and
semi-arid regions of earth , on one hand, and impor-
tant role of precipitation in supplying water resources of
the country, on the other hand, has put more emphasis
on gaining greater awareness of trends of precipitation
over Iran. Broad investigations have been carried out
to identify the process of precipitation over the whole
world and Iran. With respect to the signi cant impact of
precipitation on climate system numerous studies have
been conducted, including the studies of Matyasovszky
et al. 1993, Angel and Huff (1997) Keily et al (1998)
Gellens (2000) Piccarreta et al. (2004) Xu et al. (2003)
Turgay and Ercan (2005).
All of these studies, trend analysis of precipitation
intervals is carried out using non-parametric tests.
Trend analysis of precipitation in different time inter-
vals using parametric and non-parametric methods has
attracted the attention of many domestic researches, as
well. Kamali (11) investigated precipitation trend of dif-
ferent stations during statistical period from 1986-1996
and found that precipitation trend was both increscent
and decrescent depending on the region. He indicated
that increscent trend has been more frequent Iran than
decrescent trend.
Javeri investigated temporal changes in temperature
and precipitation over Iran using statistical tests with
xed and variable model and proved that the variation
is signi cant and these changes appear in the form of
random displacements, changes in trend, seasonal uc-
tuations, and periodical changes. Accordingly, in term of
temporal changes in temperature and precipitation, Iran
is divided to ve different zones. In this study, to meas-
ure seasonal and annual trend of precipitation data, two
non-parametric tests, Mann-Kendall test and Sen’s Esti-
mator, are used and the results are compared. Proving
the signi cance of precipitation trend in a given time
interval cannot be decisive evidence on climate changes
in a region on its own, however, it strengthens such a
hypothesis. It is caused bymultiplicity offactors control-
ling the climate system (KamaliGh 1996., Javeri 2003
Serrano et al., (1999)
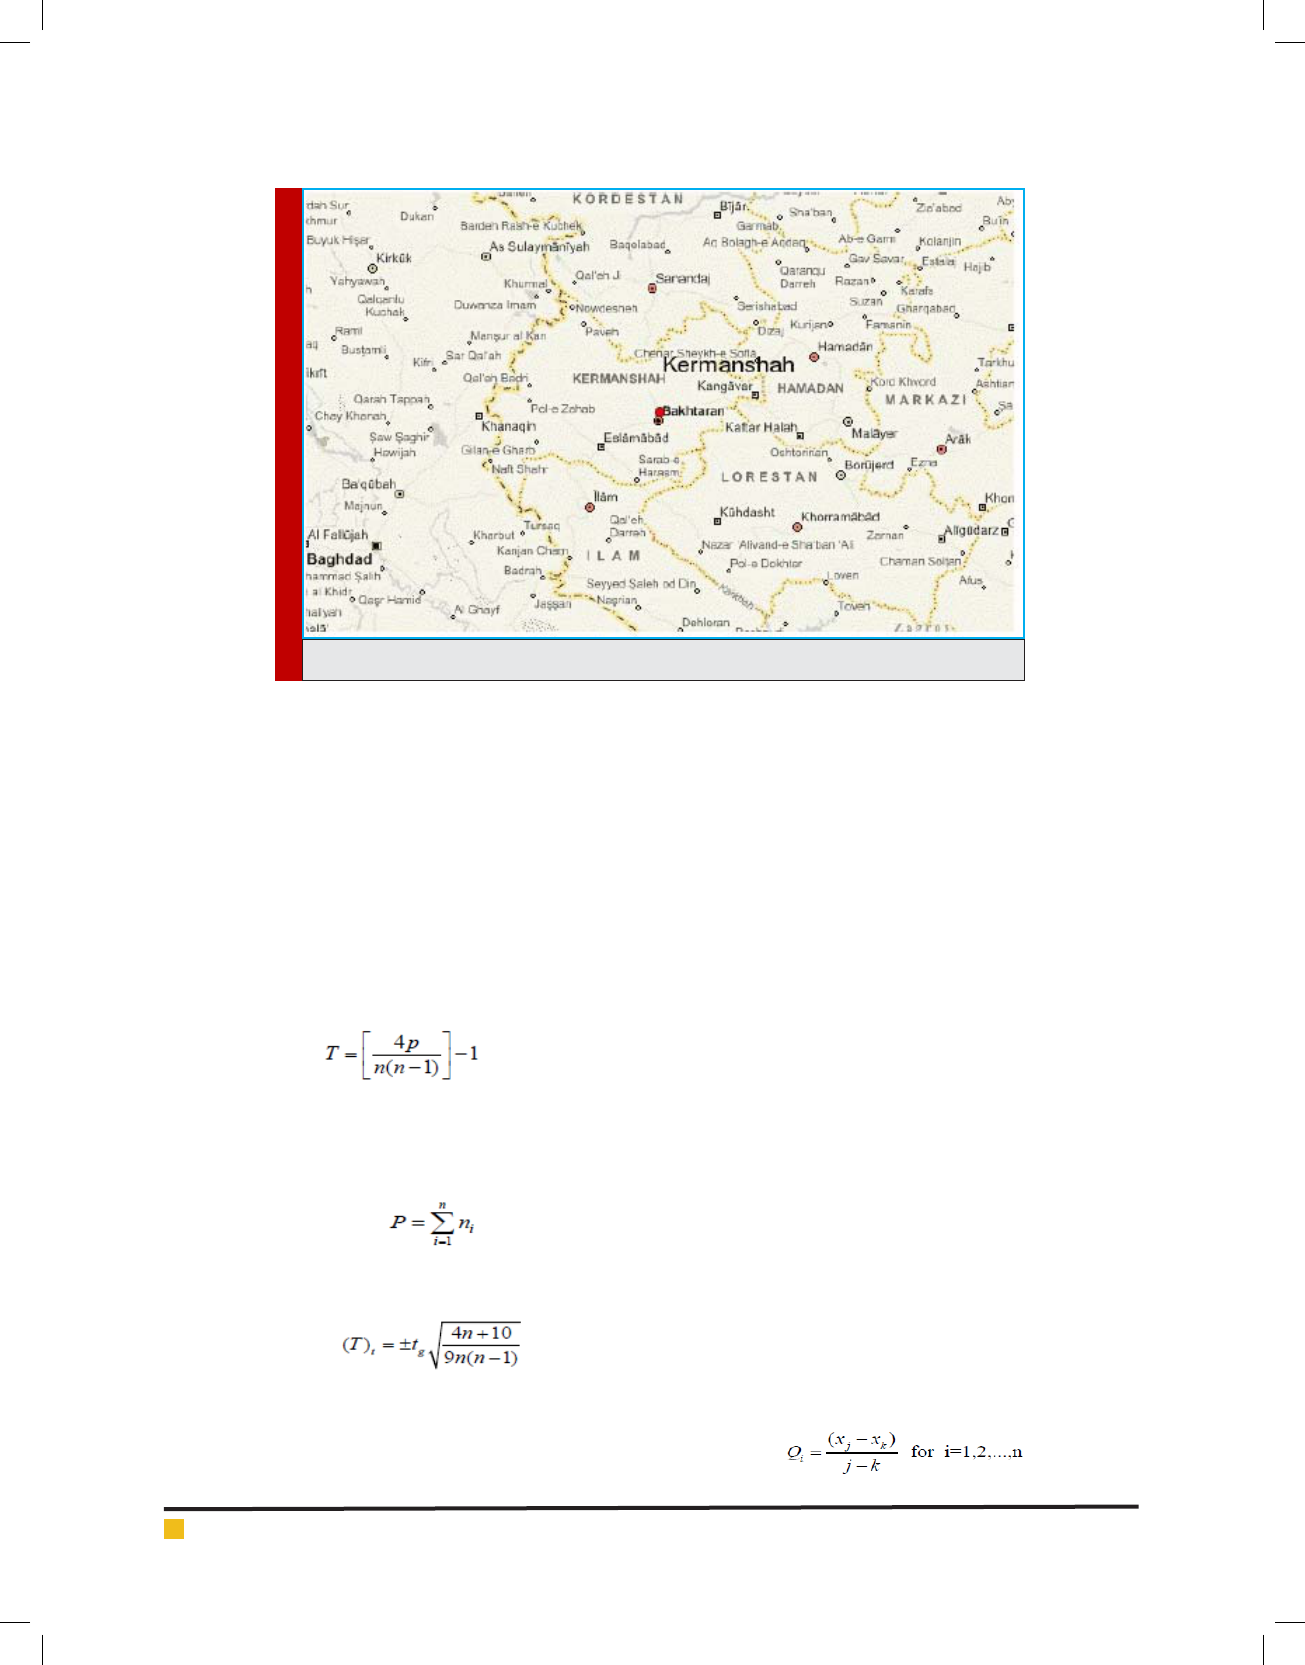
Kermanshah Province, situated in western Iran,
spreads over an area of 25,000 km2 (9,560 square miles,
roughly the size of Vermont), or 1.5 percent of the total
area of the country (Fig.1). It lies between latitudinal
45.5° and 48° E, longitudinal 33.7° and 35.3° N .The
province is bound on the south by Il
a
¯m Province, on the
southeast by Lorest
a
¯n Province, on the east by Hamad
a
¯n Province, on the north by Kordest
a
¯n Province, and
on the west by Iraq, with about 250 km of international
borderline. The capital city of this province is Kerman-
shah (Ahmadi et al 2010 ).
The province is bound on the south by Il
a
¯m Province,
on the southeast by Lorest
a
¯n Province, on the east by
Hamad
a
¯n Province, on the north by Kordest
a
¯n Province,
and on the west by Iraq, with about 250 km of interna-
tional borderline. Considering the geographical location
of Kermanshah, studies of climate change during the
past decades and identifying that it follows a trend or
not, with respect to recent droughts and growing popu-
lation, may affect making proper policies to deal with
drought and proper consumption. Such a study has not
been done in this way in the metropolis of Kermanshah,
so far.
MATERIAL AND METHODS
To examine the trend of change in precipitation of Ker-
manshah and nd a proper model for it, monthly pre-
cipitation data of synoptic meteorological station (mm)
in a 60-year period (1951-2010) are derived from Mete-
BIOSCIENCE BIOTECHNOLOGY RESEARCH COMMUNICATIONS TREND STEP CHANGES OF SEASONAL AND ANNUAL PRECIPITATION 663
Amir Hossein Hashemian et al.
FIGURE 1. Map of geographical location of Kermanshah
orological Organization of Iran. Seasonal precipitation is
a collection of monthly rainfall and annual precipitation
is a collection of seasonal rainfall. The obtained data are
restored using correlation method and regression model.
Data homogeneity is evaluated using Run test so as to
be sure homogeneity of data in a 60-year period. In the
rst place, this test is employed to indicate that time
series are non-parametric. In doing so, statistical series
are arranged in ascending order. In this test, having no
de ned trend indicates that data are random. If we nd
a trend, data are not random. To show that data are ran-
dom, the following test was carried out as per Mitchell
et al (1996):
Where T is Kendall’s statistic, n is total statistical years,
and P is total number of ratings bigger than n
i
placed
under it and can be determined through the following
relation:
The following equation tests the signi cance of T:
Where t
g
is critical value of normal standard (z) with the
test probability level which is 1.96 at the con dence
level of 95%. If -T, < T < +T, series are random with no
trend. T < - T
t
indicates a downtrend and if T < + T
t
a ris-
ing trend is governs the time series (16). If n represents
a 60-year period, the obtained values would be ± 0.089.
To determine the trend direction, type, and time,
graphic Kendall test has to be carried out. In calculat-
ing thestatistics using graphical sequential mann-ken-
dalltest for detection of change time, in two phases of
beginning to end, and vice versa, plotted in one graph,
change point appears well. Detailed (short term) proce-
dures, change in position, or starting point of the series
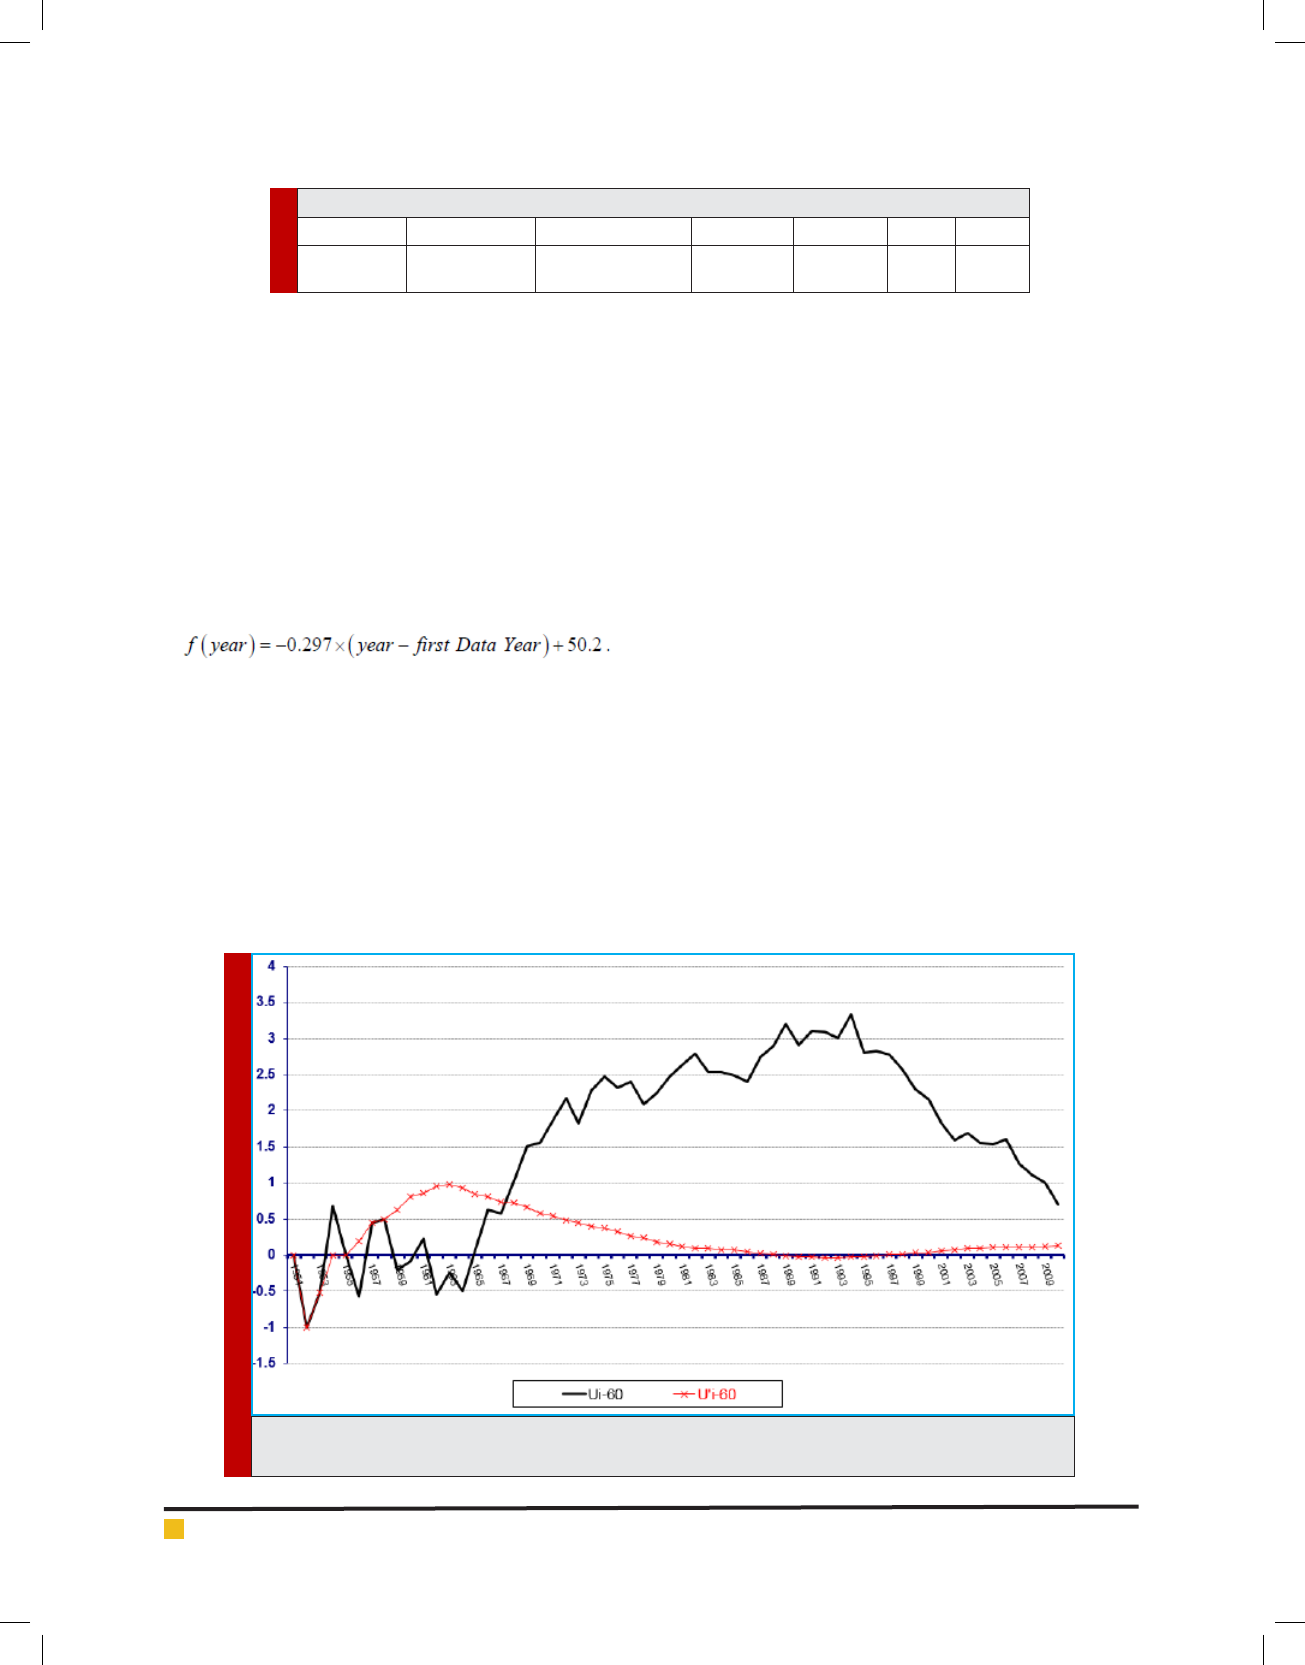
are examined using time series graphs of u(t) and u´(t).
If you graph u and u´ sequences indexed by i, when the
trend is signi cant, the two lines intersect, outside the
range of1.96, at the starting point and move in opposite
direction. This intersection point is referred to as a leap.
While, if there was no trend, the two sequences (u and u´)
would move on roughly in a parallel direction or intersect
each other in a several points in a way that result in no
change in direction. U graph is plotted based on year and
u´ is de ned to show its signi cance of leap point. Where
-1.96<u<1.96, series are random and no certain trend can
be de ned. But, u>1.96 and u<-1.96 indicate existence of
a positive and a negative trend, respectively. This study
considers a two-dimensional data matrix (12×60: 60 =
studies years, 12=number of months).
If data series indicate a certain trend, the actual slope
(change rate per unit of time), can be obtained using a
simple non-parametric methodof Sen’s slope estimator.
First, obtain slope of each pair of consecutive data series
using the following equation:
664 TREND STEP CHANGES OF SEASONAL AND ANNUAL PRECIPITATION BIOSCIENCE BIOTECHNOLOGY RESEARCH COMMUNICATIONS
Amir Hossein Hashemian et al.
BIOSCIENCE BIOTECHNOLOGY RESEARCH COMMUNICATIONS TREND STEP CHANGES OF SEASONAL AND ANNUAL PRECIPITATION 665
Where, X
j
and X
k
are data values in time j and k, respec-
tively, which differ one unit of time, Q
i
is the median
value, and n is slope of line estimated by Sen’s slope
estimator. Sen’s slope estimatoris obtained through the
following equation:
Where n is an even number, Sen’s slope estimatoris
achieved as:
If you measure Q
med
with mutual test at the con dence
level of 100(1-)%, it is possible to obtain the actual value
of the line slope. Considering zero between two derived
slopes, no trend can be attributed to the time series with
this con dence level. Otherwise, signi cant trend of time
series, at the considered level of con dence, is proved.
Total monthly precipitation data in 1996, from January
to May, is not available so average precipitation value of
other months are used. Months of the year are divided
into two groups, warm and cold months, and trends in
each group are examined and compared separately.
RESULTS AND DISCUSSION
Average precipitation over Kermanshah per month
(±Standard Deviation) is 36.18 mm (±42.52) and the
highest amount of precipitation per month during the
statistical period (60 years) is 494.8 mm recorded in 1974.
The least amount of precipitation is zero and recorded
during summer. Mann- Kendall test results for total
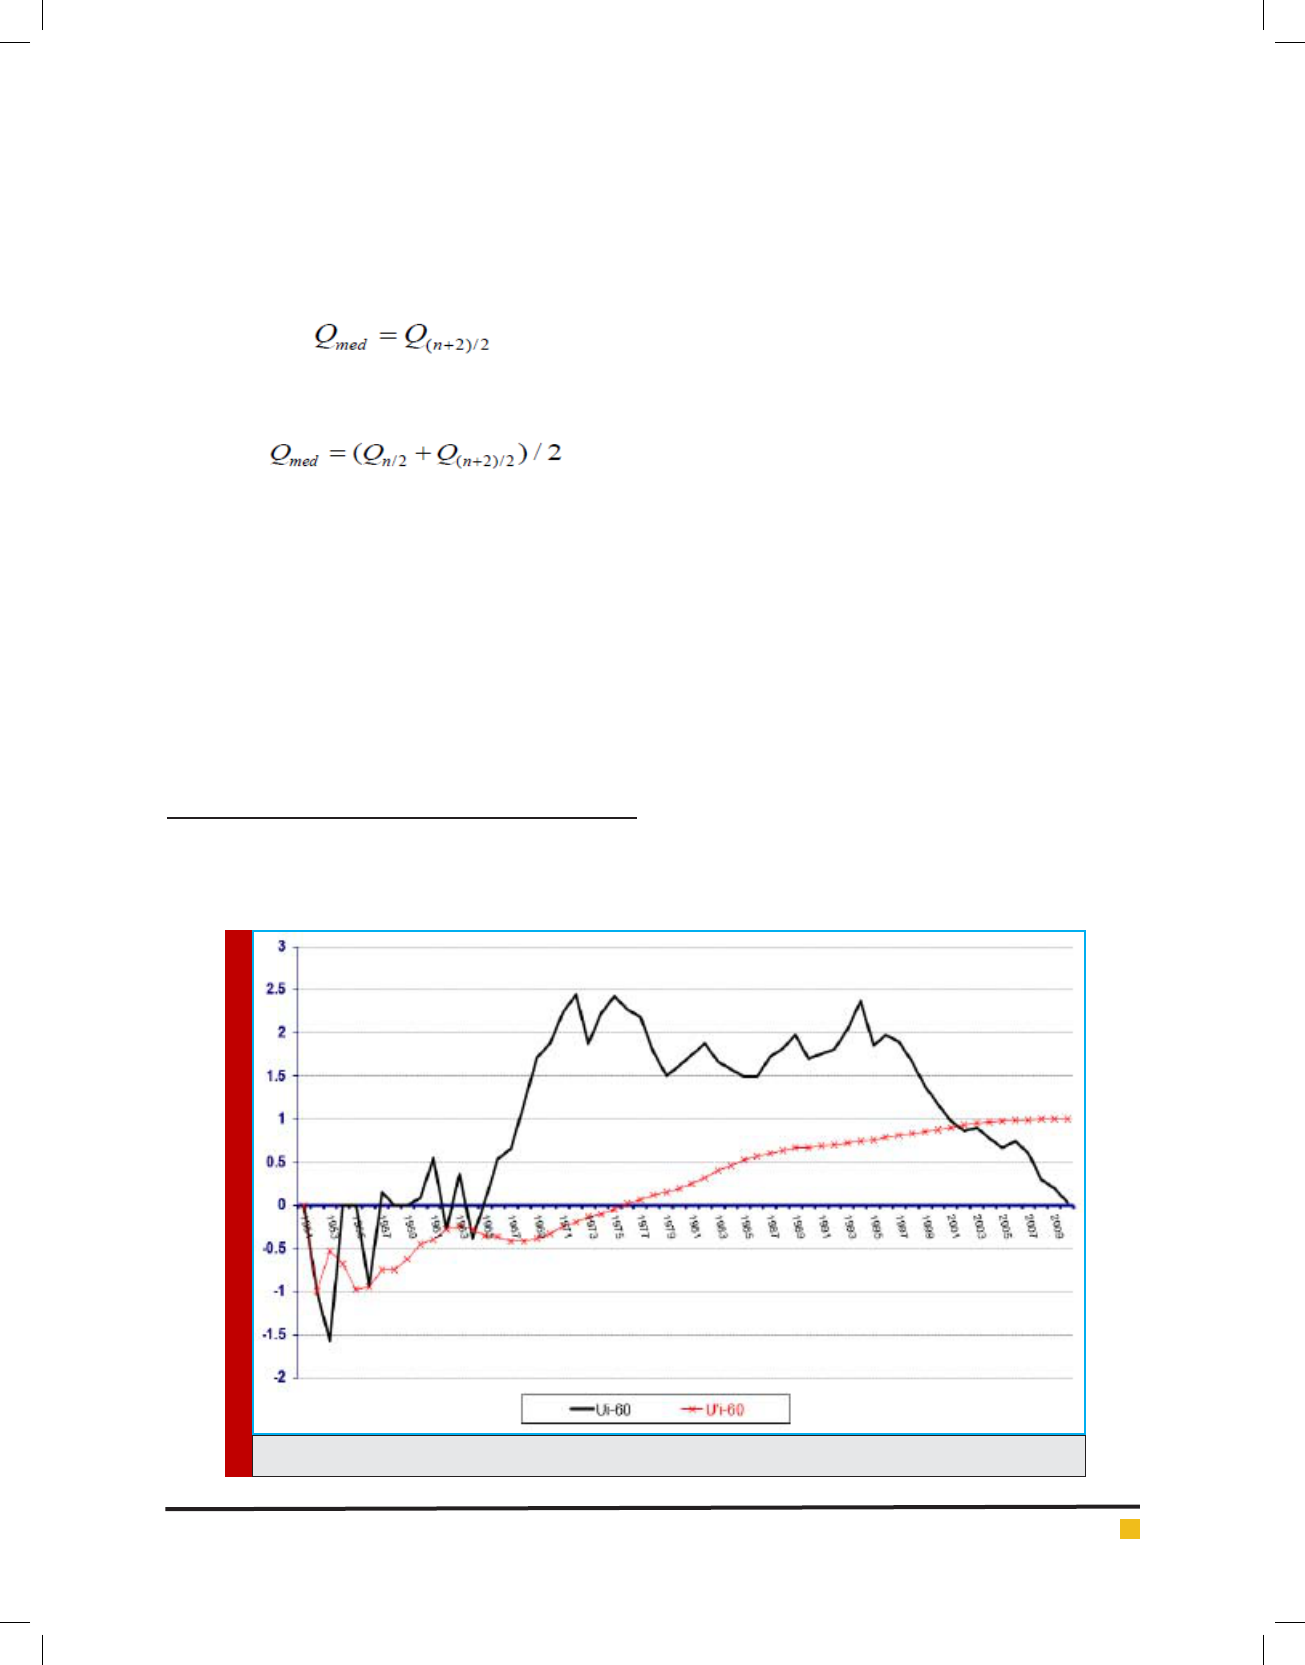
annual precipitation are calculated and drawn. During
the studied period, no trend is detected in average pre-
cipitation over Kermanshah weather station within the
signi cant levels of the test since u and u´, at no time
interval, intersect outside the meaningful range1.96
(Chart 1). From 1968 to 1975 the graph falls above 1.96;
changes which indicate leapsin total annual precipita-
tion during these years.
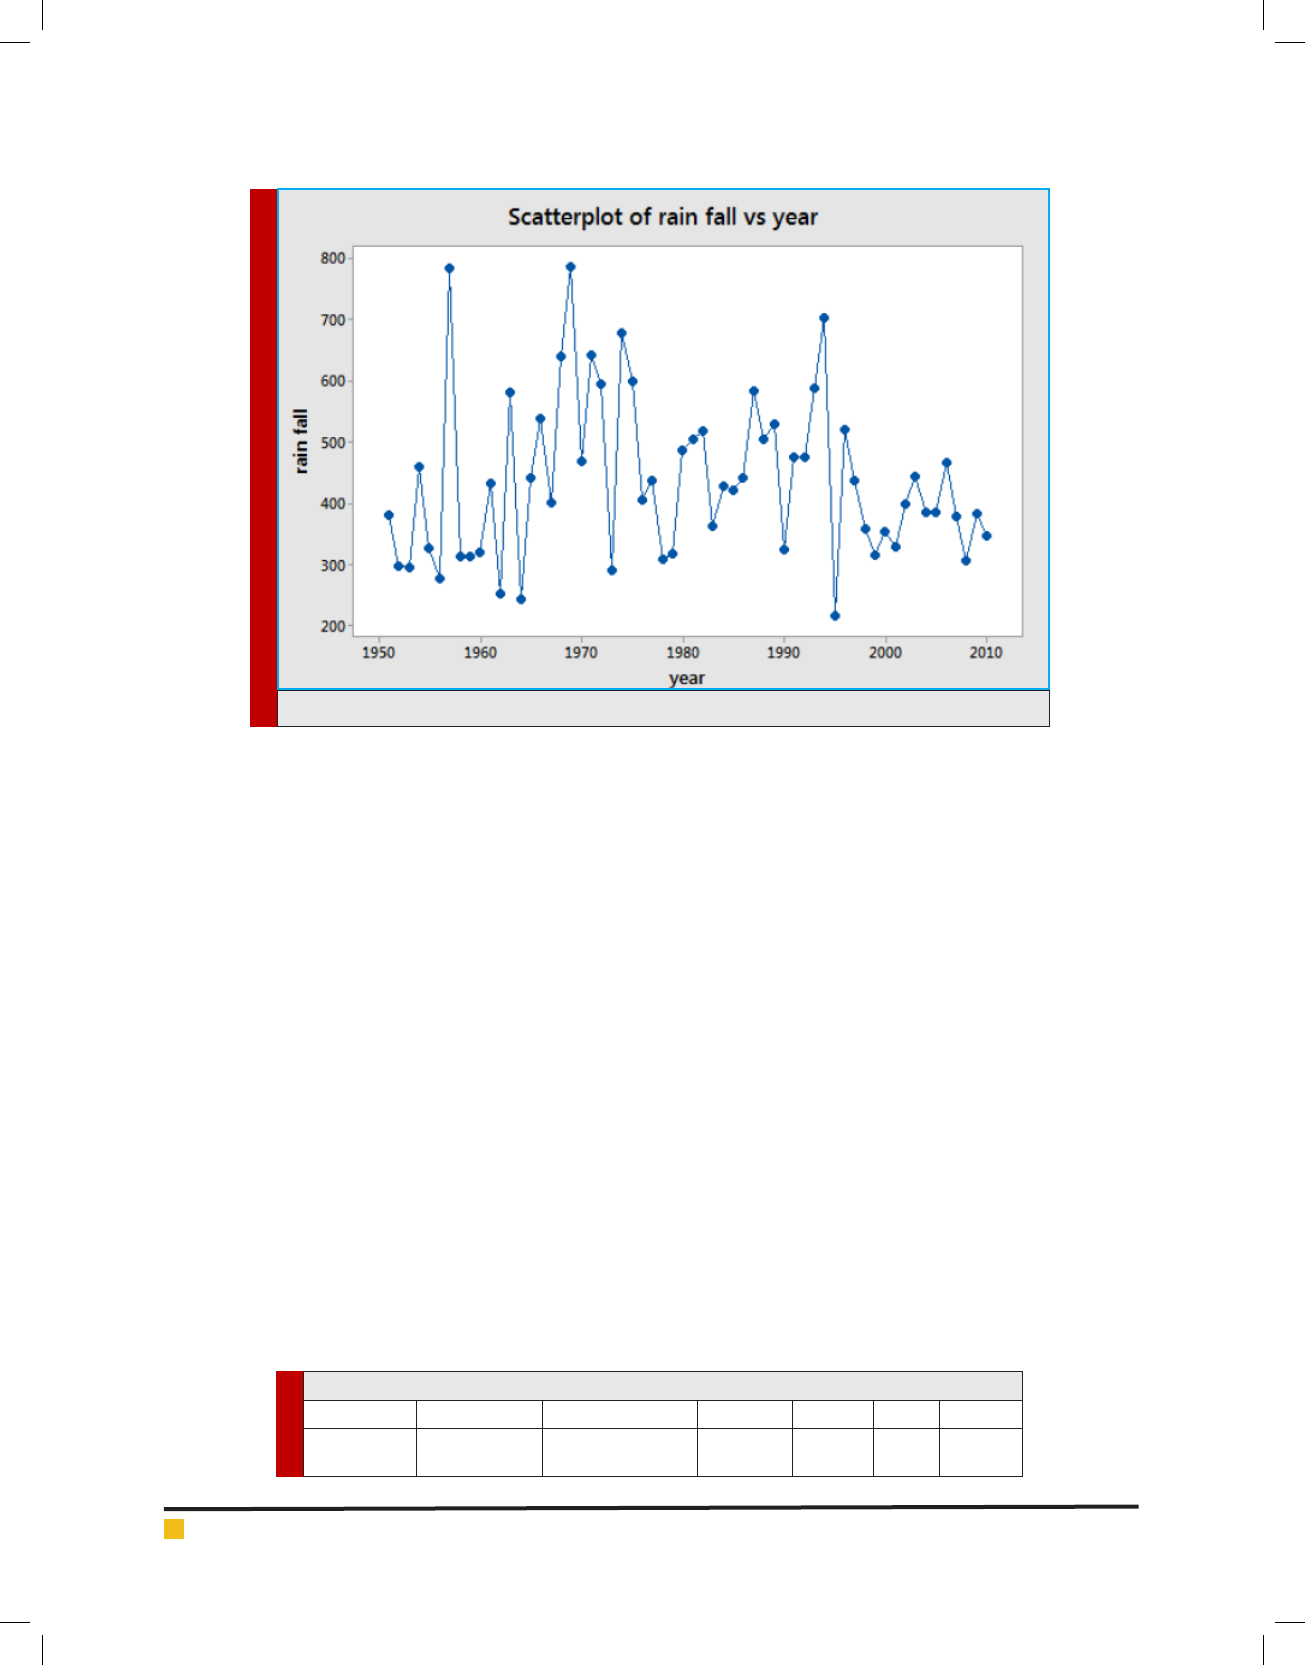
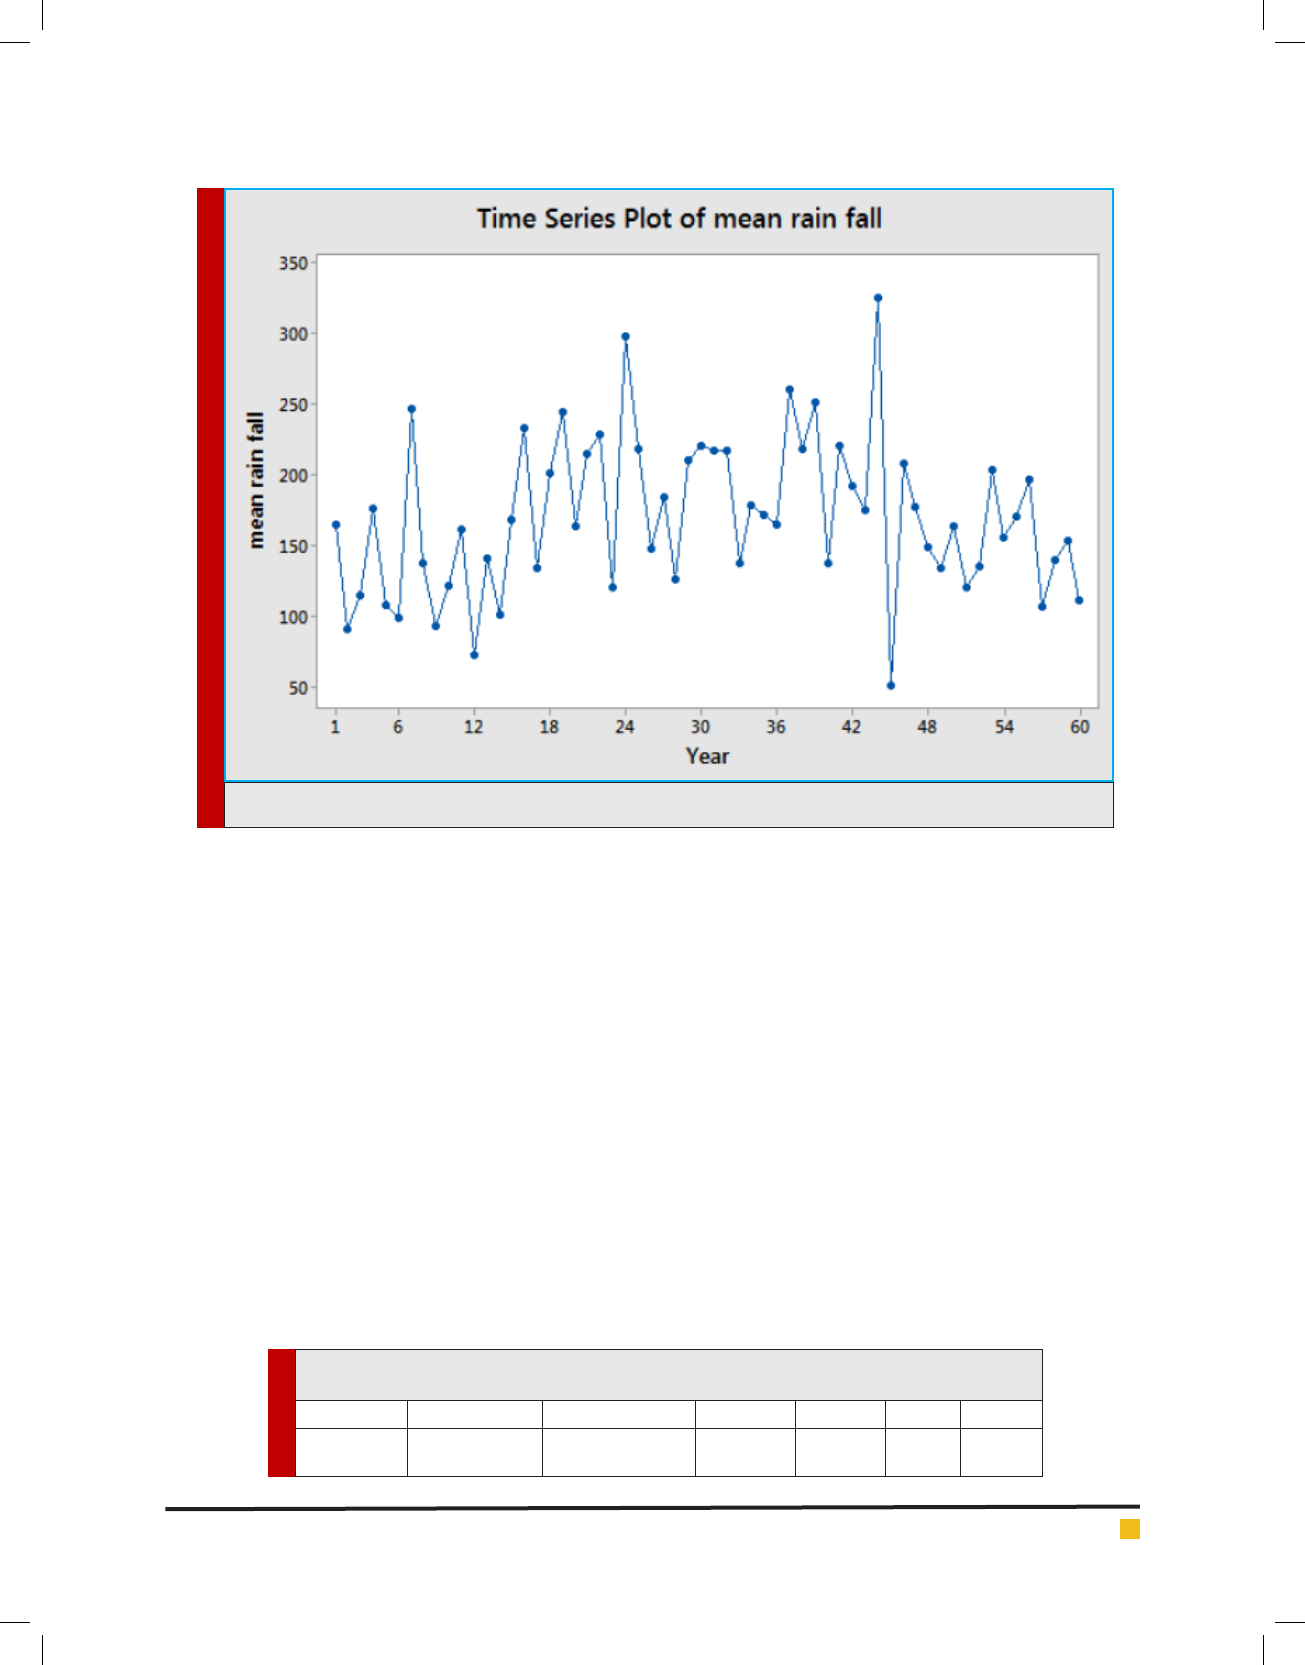
Distribution of annual precipitation during the stud-
ied years is drawn. The least amount of annual precipita-
tion is 215.8 recorded in 1995 and the highest amounts
of precipitation is 785.5 recorded in 1996 and 783.9
recorded in 1957 (Chart 2).
According to the results of Mann-Kendall diagram,
no signi cant trend is detected in annual precipitation
data recorded during the studied period (60 years).Sen’s
slope estimator con rms the obtained results. The value
of statistic in Z is 0.03. With respect to obtained values
for the highest (1.67) and lowest (-2.26) amount of Q,
with con dence level of 95%, it may be concluded that
null hypothesis of this test is con rmed and no trend
in detected in the precipitation data recorded during
the 60-year period. In Sen’s slope estimator test, null
hypothesis is: there is no trend is the studied period.
Considering the obtained P-value (>0.05) and available
CHART 1. Mann-Kendall graph of total annual precipitation over Kermanshah during a 60-year period
Amir Hossein Hashemian et al.
666 TREND STEP CHANGES OF SEASONAL AND ANNUAL PRECIPITATION BIOSCIENCE BIOTECHNOLOGY RESEARCH COMMUNICATIONS
data, the assumption of existence of a trend in the stud-
ied period is rejected. In other words, no trend can be
attributed to existing data. With regard to the highest
and lowest slope values, zero depends on the interval
between these two values. Therefore, null hypothesis of
the test is con rmed based on this con dence interval
(Table 1).
Average precipitation over Kermanshah per month (±
standard deviation) is 47.9 Mm (±33.64) and the highest
amount of precipitation per month during the statistical
period (60 years) is 297.6 mm recorded in spring of 1963.
Average monthly precipitation over Kermanshah dur-
ing cold seasons is 169.68 mm (±54.56) and the highest
amount of monthly precipitation during cold seasons is
494.8 mm recorded in winter of 1947. The least amount
of precipitation is zero and recorded mostly in summers.
Mann – Kendall test results of average monthly pre-
cipitation are analyzed and drawn for both warm and
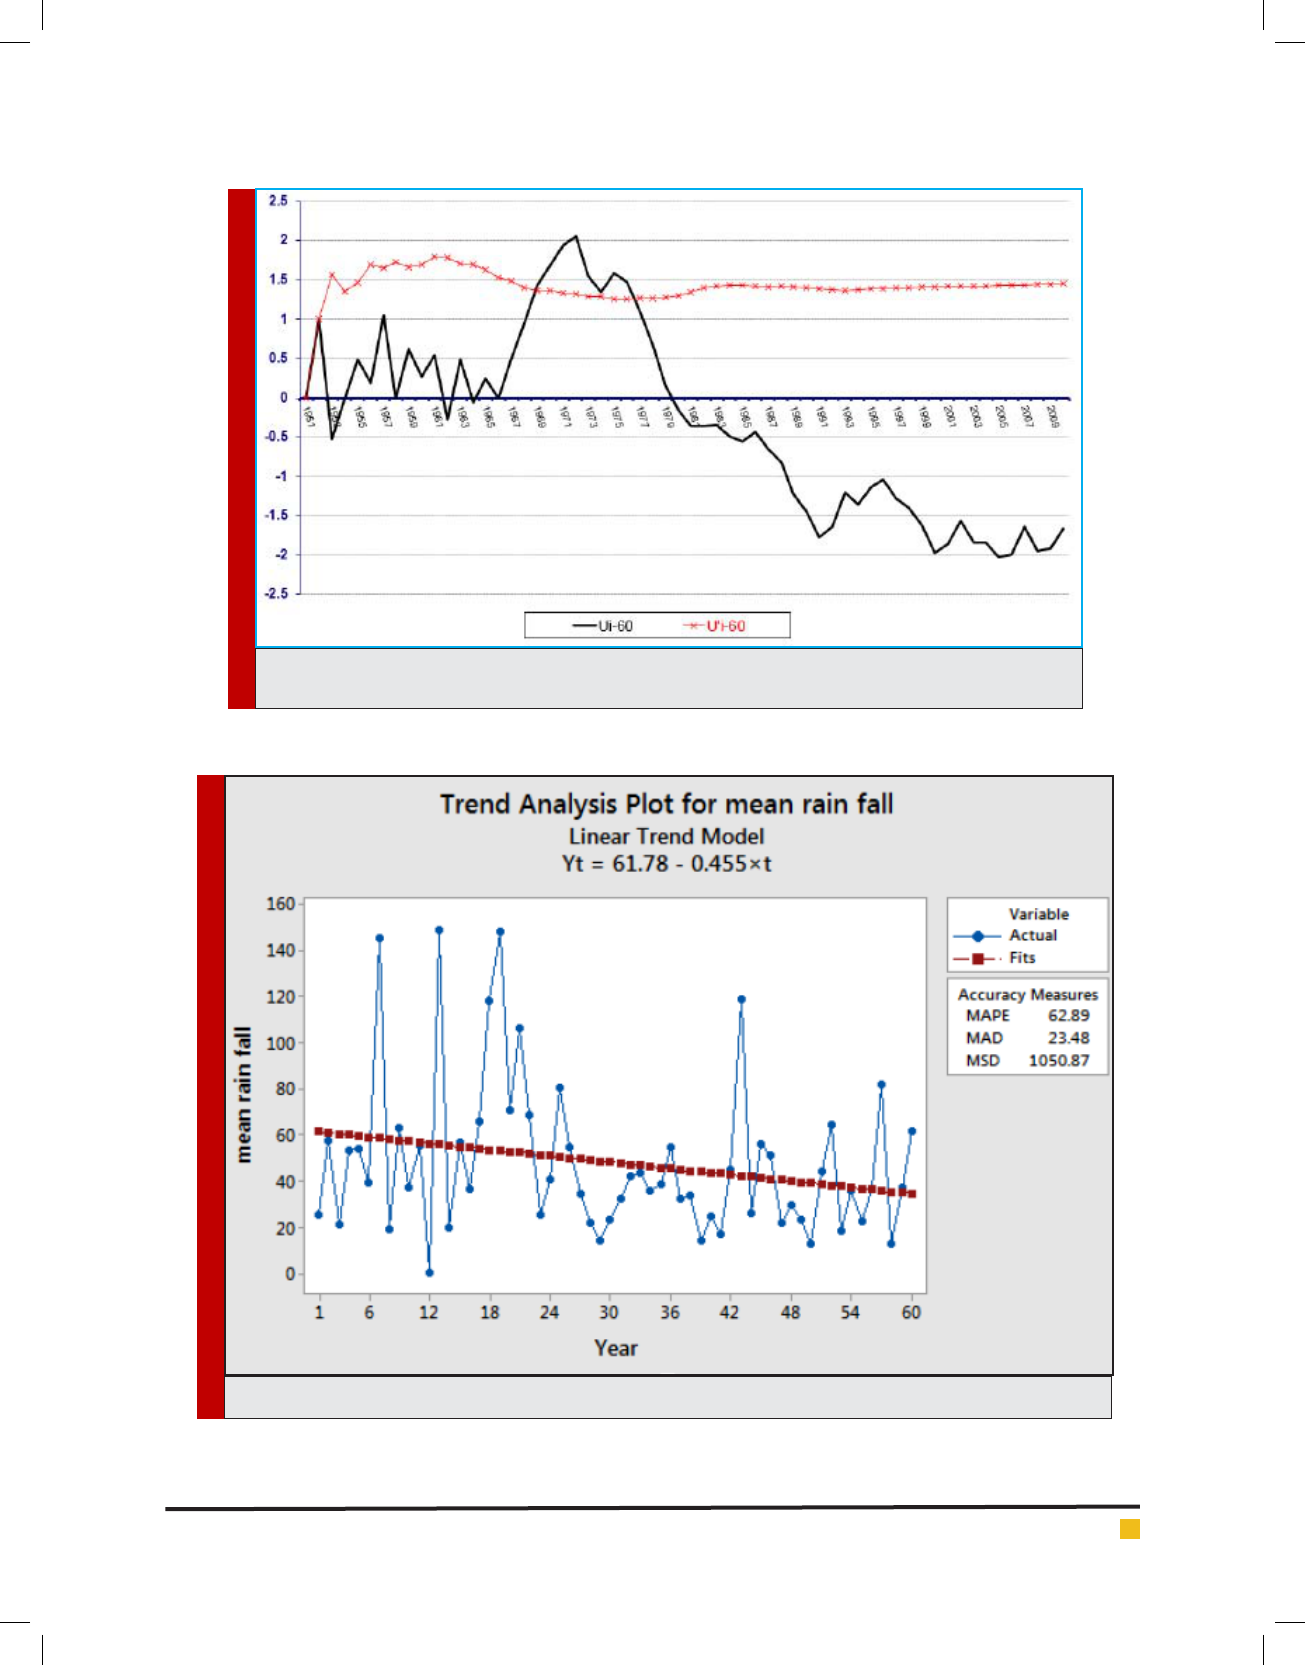
cold seasons. During warm seasons of the study period,
the average amount of precipitation over Kermanshah
weather station indicates no statistically signi cant
trend in the signi cant range; however, from 1951 to
1968, a rising trend is detected with sharp leaps and falls
and positive phase of change is witnessed in precipita-
tion. In 1969, a leap from average is occurredand data
are considerably increased. Again, in 1977 the precipita-
tion goes back to normal phase. Since 1978 precipitation
level follows a decreasing trend which again has its own
ups and downs and does not go beyond the signi cant
level (Chart 3).
Diagram of distribution of average monthly pre-
cipitation over Kermanshah during warm seasons of a
60-year period is drawn. The lowest and highest aver-
ages of monthly precipitation during warm seasons are 0
and 148.8, respectively, recorded in 1963 (Chart 4).
According to the results of Mann-Kendall diagram
for warm seasons, no signi cant trend is detected in
monthly precipitation data recorded during the stud-
ied period (60 years).Sen’s slope estimator con rms the
obtained results. The value of statistic in Z is 0.69. With
respect to obtained values for the highest (1.11) and low-
est (-63.1) amount of Q, with con dence level of 95%,
it may be concluded that null hypothesis of this test is
con rmed and no trend in detected in the precipitation
data recorded during the 60-year period (Table 2).
Considering the obtained P-value (>0.05) and avail-
able data, the assumption of existence of a trend in the
studied period is accepted. In other words, no trend can
CHART 2. Distribution of total annual precipitation over Kermanshah
Table 1. Results of Sen’s slope estimator test for total annual precipitation over Kermanshah
variable Time interval Number of years Z statistic p-value Qmax Qmin
Amount of
precipitation
1951-2010 60 0.03 0.488 1.67 -2.26
Amir Hossein Hashemian et al.
BIOSCIENCE BIOTECHNOLOGY RESEARCH COMMUNICATIONS TREND STEP CHANGES OF SEASONAL AND ANNUAL PRECIPITATION 667
CHART 3. Mann – Kendall diagram of average monthly precipitation over Kermanshah during warm sea-
sons of a 60-year period
CHART 4. Distribution of average monthly precipitation over Kermanshah during warm seasons
Amir Hossein Hashemian et al.
668 TREND STEP CHANGES OF SEASONAL AND ANNUAL PRECIPITATION BIOSCIENCE BIOTECHNOLOGY RESEARCH COMMUNICATIONS
Table 2. Results of Sen’s slope estimator test for total monthly precipitation over Kermanshah
variable Time interval Number of years Z statistic p-value Qmax Qmin
Amount of
precipitation
1951-2010 60 1.56 0.059 0.06 -0.712
CHART 5. Mann – Kendall diagram for average precipitation over Kermanshahduring cold seasons of a
60-year period
be attributed to existing data. With regard to the highest
and lowest slope values, zero depends on the interval
between these two values. Therefore, null hypothesis of
the test is con rmed based on this con dence interval
(table 2). Although, with regard to Sen and Mann-Kend-
all statistical indicators, no signi cant trend is detected
in average monthly precipitation during warm seasons,
the general trend of time series is decrescent (Chart 4).
The linear equation of times series obtained by trend
analysis test is
y
t
= 61.78 - 0.455 t (t is the time differ-
ence since the beginning of time series). The linear equa-
tion obtained by Sen’s slope estimator is below:
Forecasts of the two employed tests for the average
precipitation in warm seasons are very close and similar.
To examine existence of trend in precipitation during
cold seasons, Mann-Kendall test and Sen’s slope estima-
tor are used, the results of which are as follows. During
cold seasons of the studied period, no trend is detected
in average precipitation over Kermanshah weather sta-
tion within the signi cant levels of the test. In 1967, a
leap from average is occurred and this sudden change
continues in an upward positive direction until 1995.
Then, until the end of the study period, precipitation fol-
lows a downward trend (Chart 5).
The lowest and highest averages of monthly precipi-
tation during cold seasons are 51.6 and 325.35, respec-
tively (Chart 6).
According to the results of Mann-Kendall diagram,
no signi cant trend is detected in annual precipitation
data recorded during the studied period (60 years).Sen’s
slope estimator con rms the obtained results. The value
of statistic in Z is 0.69. With respect to obtained values
for the highest (1.11) and lowest (-0.63) amount of Q,
with con dence level of 95%, it may be concluded that
null hypothesis of this test is con rmed and no trend in
detected in the precipitation data recorded during the
60-year period (table 3).
Considering the obtained P-value (>0.05) and avail-
able data, the assumption of existence of a trend in the
studied period is accepted. In other words, no trend can
be attributed to existing data. With regard to the highest
and lowest slope values, zero depends on the interval
between these two values. Therefore, null hypothesis of
the test is con rmed based on this con dence interval
(Table 3).
Generally, a comparison between average precipi-
tations during warm and cold seasons indicate that
Amir Hossein Hashemian et al.
BIOSCIENCE BIOTECHNOLOGY RESEARCH COMMUNICATIONS TREND STEP CHANGES OF SEASONAL AND ANNUAL PRECIPITATION 669
CHART 6. Distribution of average monthly precipitation over Kermanshah during cold seasons
Table 3. Results of Sen’s slope estimator test for average precipitation over Kermanshah during
cold seasons
variable Time interval Number of years Z statistic p-value Q min Q max
Average
precipitation
1951-2010 60 0.69 0.246 -0.63 1.11
changes in warm season starts a downward trend since
1970. But an upward trend of precipitation in cold sea-
sons changes to a downward direction since 1993. In the
beginning years of the study period, changes in average
monthly precipitation during warm seasons is more than
cold seasons; however, the more we approach the end
of the study period, the less evident are these ups and
downs.
1. Statistical studies of precipitation have been large-
ly considered since 1980. Statistical studies of
Kane and Trivedi (1988), Karl (1988)and Katsoulis
and Kambetzldis (1989) are among these. When
compared with Iran with annual precipitation of
about 260 mm, Kermanshah, with average annual
precipitation of 434 mm, is regarded as an area
with high rate of precipitation. Trend step changes
in precipitation are evident in different stations.
But in most stations, the trend of change seems not
be statistically signi cant. Average monthly pre-
cipitation over Kermanshah during warm and cold
seasons indicates no signi cant trend of change.
The results of this study are different from the
ndings of the study carried out by Jahanbakhsh
et al. in which they measured changes in precipi-
tation and temperature of Karkha region. This dif-
ference may be due to differences in geographical
location of the two regions (19). But, Hejam et al.
research is consistent with the current study. They
examined trend of changes in seasonal and annual
precipitations over several meteorological stations
and because of lack of trended and un-trended
series they could not attribute a certain trend to
seasonal and annual precipitations of the studied
region, ( Jahanbakhsh et al., (2010) Negaresh et al
(2012) .

Amir Hossein Hashemian et al.
670 TREND STEP CHANGES OF SEASONAL AND ANNUAL PRECIPITATION BIOSCIENCE BIOTECHNOLOGY RESEARCH COMMUNICATIONS
Investigation seasonal (warm and cold) trend of pre-
cipitation indicated that average precipitation during
warm seasons of the 60-year period is generally down-
ward; however, this trend is not signi cant at 0.05.
The results of this study are consistent with the results
obtained from the study of Alijani et al. (2012). During
summer, cloud formation and precipitation is not pos-
sible over a wide range of Iran. Therefore, this season
is the driest season. In the 60-year period, because of
lack of precipitation during summer, changes in aver-
age precipitation during warm seasons was similar to
springs which was different to that of Katirai et al report.
They found a decreasing trend for spring precipitation
in Iran. Although, they examined precipitation trend of
the whole country of Iran from 1960 to 2001 but we
only studied Kermanshah with more detail and during
a longer period. Negaresh et al. (2012 ), in a statistical
investigation of changes in precipitation over Saqqez,
found similar results and decreasing trend for precipita-
tion during summer. Although we found no signi cant
trend for precipitation during warm seasons, direction of
changes in precipitation trend was downward.
The current study found no trend for precipitation
during cold seasons and in this regard our ndings are
consistent with Alijani et al 2012 . studies of precipita-
tion during cold seasons indicated no trend, either, and
these ndings are consistent with the study of Negaresh
et al. (2012). In case of nding a trend, precipitation
forecast for coming years would be possible.
CONCLUSION
In general, annual precipitation over Kermanshah, dur-
ing a 60-year period, from 1951 to 2010, follows no
speci c (downward or upward) trend. General changes
in trend of precipitation during warm seasons, although
non-signi cant, follow downward directions. Also, some
leaps of change are witnessed in annual and seasonal
trend of precipitation.
ACKNOWLEDGMENT
The researchers wish to thank Deputy of research and
technology of university for their nancial support of
this project (No.93502), and Weather Organization for
their cooperation and allowing us to use data recorded
in synoptic meteorology station.
REFERENCES
Abdul Aziz O.I., and Burn D.H. (2006) Trends and variability in
the hydrological regime of the Mackenzie River Basin, Journal
of Hydrology 319:282-294.
Ahmadi A., Maru S., ZareAbyaneh H. andHeidari M. (2010)
Statistical analysis of rainfall trend in Kermanshah province
by f Mann-Kendall test. First Conference of Iranian Water
Resources Research. Kermanshah University of Technol-
ogy.29-37.
Alijani B., Mahmoudi P. and Chogan A.J. (2012) A study of
annual and seasonal precipitation trends in Iran using a non-
parametric method (Sen’s slope estimator). Journal of climate
resaerch 3 (9); 105 - 106.
Angel J.R.and Huff F.A. (1997) Changes in heavy rainfall in
Midwestern United States. Journal of water Resources plan-
ning and management 123(4): 246-249.
Chen H., Guo S., Xu C.Y. and Singh V.P. (2007) Historical tem-
poral trends of hydro-climatic variables and runoff response to
climate variability and their relevance in water resource man-
agement in the Hanjiang basin. Journal of Hydrology 344:171-
184.
Gellens D. (2000) Trend and Correlation Analysis of k-Day
Extreme Precipitation over Belgium. Theoretical and Applied
Climatology 66:117-129.
Hejam S., Khoushkhou Y. and ShamsaldinVandi R. (2008)
Annual And Seasonal Precipitation Trend Analysis of Some
Selective Meteorological Stations In Central Region of Iran
Using Non-Parametric Methods. Physical Geography Research
Quarterly 40(64): 157–168.
Jahanbakhsh S., RahimiBondarabadi S., Hosseini A., Rezaei S.
andKhosh Zaman T. (2010) Annual rainfall and temperature
trends in Karkharivar basin. 4th international congress of the
Islamic world geographers.
Javeri M.(2003) Temperature and precipitation changes in Iran.
PhD thesis of geography. University of Tehran 2003.
KamaliGh. (1996) Severe changes in rainfall in different parts
of the country in the last ten years. The rst regional confer-
ence of climate changes. Tehran, 21-23 May 1996.
Katirai, P.S., Hejam S. and Irannejad P. (2007) Daly precipi-
tation frequency and intensity changes in precipitation trend
distribution over 1960-2001.Journal of the Earth and Space
Physics 33(1): 67-83.
Keily G., Albertson J.D. and Parlange M.B. (1998) Recent
Trends in Diurnal Variation of Precipitation at Valentia on the
West Coast of Irland. Journal of Hydrology207: 270-279.
Matyasovszky I., Bogardi I., Bardossy A. andDuckstein L.
(1993). Estimation of Local Precipitation Statistics Re ecting
Climate Change, Water Resources Research. 29, 3955-3968.
Mitchell. J.M., ChairmanJ., Dzerdzeevskii B., Flohn H., Hofmeyr
W.L., Lamb H.H., Rao K.N. and Wallen C.C.(1966)Climatic
Change. Technical Note No. 79. (Report of a working group of
the Commission for Climatology). WMO 195.
Negaresh H., Sari B. and Darayi M. (2012) The Statistical Sur-
vey of Precipitation Changes in Saqqez. 16(42);239-59.
Piccarreta M.,Capolongo D. and Boenzi F.(2004) Trend Analy-
sis of Precipitation and Drought in Basilicata from 1923 to
2000 within Southern Italy Context. International journal of
climatology 24, 907-922.

Amir Hossein Hashemian et al.
BIOSCIENCE BIOTECHNOLOGY RESEARCH COMMUNICATIONS TREND STEP CHANGES OF SEASONAL AND ANNUAL PRECIPITATION 671
Serrano A., Mateos V.L. and Garcia J.A. (1999) Trend analy-
sis of monthly precipitation over the iberian peninsula for the
period 1921–1995. Physics and Chemistry of the Earth, Part
B: Hydrology, Oceans and Atmosphere 24(1-2):85-90.http://
www.iranicaonline.org/articles/kermanshah-01-geography
Turgay P. and Ercan K. (2005)Trend Analysis in Turkish Pre-
cipitation data. Hydrological Processes 20(9): 2011–2026.
Vivekanandan N. (2007) Analysis of Trend in Rainfall Using
Non Parametric Statistical Methods.International symposium
on rainfall rate and radio wave propagation, American insti-
tute of physics: 101-113.
Xu Z.X., Takeuchi K. and Ishidiaira H. (2003) Monitoring trend
step changes in precipitation in Japanese precipitation. Journal
of Hydrology 279: 144-150.