
Statistical optimization of extracellular tannase
production by
Streptomyces sp.
AT 13 using response
surface methodology and Plackett-Burmen design
Archana D. Tripathi* and Lakshmi B.
Department of Biotechnology, Kadi Sarva Vishwavidyalaya, Gandhinagar, Pin-382028, Gujarat, India
ABSTRACT
Tannase has many important applications in animal feed, chemical, food, and pharmaceutical industries. In the present study,
optimization of tannase production by Streptomyces sp. AT13 was carried out using statistical experimental designs. Initially, a
Plackett-Burmen design (PBD) was employed to screen the preferable nutriments (carbon and nitrogen sources of the medium) to
produce tannase. The result showed that only tannic acid was found to be signi cant for the production of tannase by Strepto-
myces sp. AT 13. The signi cant factor was further optimized by using Box-Behnken design under response surface methodology
(RSM). From among 6 fermentative variables that were studied, 5 signi cant variables were picked up by PBD. Among 5 variables
from PBD, 3 were further optimized by Box-Behnken design. The parameters studied through RSM were 1% Tannic Acid, 0.5 %
KCl and 0.1 % KH
2
PO
4
. Under optimized conditions tannase activity was 18.12 U/ml/min. This activity was almost three times
higher as compared to the amount obtained by ‘one-at-a-time’ approach. (5.19 U/ml/min)
691
Biotechnological
Communication
Biosci. Biotech. Res. Comm. 11(4): 691-698 (2018)
INTRODUCTION
Tannins are polyphenolic compounds with molecular
weights ranging from 500 to 3000 daltons which occur
widely ina variety of plants including monocots, dicots
and ferns (Bate-Smith and Swain 1962; Mcleod 1974;
Haslam 1989). They are the fourth most abundant plant
constituents after cellulose, hemicellulose and lignin.
Based on their structure and properties, tannins are dis-
tributed into two major groups – hydrolysable and con-
densed tannins. Hydrolysable tannins are composed of
esters of gallic acid (gallotannins) or ellagic acid (ella-
gitannins) with a sugar core, which is usually glucose,
and are readily hydrolysed by acids and enzymes into
monomeric products. Hydrolysable tannins are notably
absent in monocots. Commercially, hydrolysable tannins
ARTICLE INFORMATION:
Corresponding Authors: archana315@gmail.com,
lakjayan@gmail.com
Received 19
th
Sep, 2018
Accepted after revision 18
st
Dec, 2018
BBRC Print ISSN: 0974-6455
Online ISSN: 2321-4007 CODEN: USA BBRCBA
Thomson Reuters ISI ESC / Clarivate Analytics USA
Mono of Clarivate Analytics and Crossref Indexed
Journal Mono of CR
NAAS Journal Score 2018: 4.31 SJIF 2017: 4.196
© A Society of Science and Nature Publication, Bhopal India
2018. All rights reserved.
Online Contents Available at: http//www.bbrc.in/
DOI: 10.21786/bbrc/11.4/21

Archana and Lakshmi
692 STATISTICAL OPTIMIZATION OF EXTRACELLULAR TANNASE PRODUCTION BIOSCIENCE BIOTECHNOLOGY RESEARCH COMMUNICATIONS
are extracted from Chinese gall (Rhus semialata), Sumac
(R. coriara), Turkish gall (Quercus infectoria), Tara (Cae-
salpina spinosa), Myrobalan nuts (Terminalia chebula)
and chestnuts (Castania sativa) (Bhat et al., 1998).
Tannase (tannin acyl hydrolase) catalyses the hydroly-
sis of ester and depside bonds of hydrolysable tannins to
produce glucose and gallic acid (Barthomeuf et al.,1994).
Hydrolysis of tannic acid by tannase results in the liber-
ation of glucose, gallic acid and various galloyl esters of
glucose (Van de Lagemaat and Pyle, 2006). This enzyme
nds widespread applications in food processing, brew-
ing, pharmaceuticals, medicine, textiles, detergents and
tea industry (Lekha and Lonsane, 1997). A combination
of trimethoprim and sulphonamide is effective against
many antibiotic resistant species of bacteria. More than
8000 tonnes per annum of gallic acid is manufactured
out of which, almost 70% is used in production of tri-
methoprim (Beena, 2010).
The use of a sequential experimental design strategy
is a useful tool for process optimization. Response sur-
face methodology (RSM) provides important information
regarding the optimum level of each variable along with
its interactions with other variables and their effects on
product yield. It reduces the number of experiments with-
out neglecting the interactions among the parameters.
This multivariate approach also improves statistical inter-
pretation possibilities and evaluates the relative signi -
cance of several contributing factors even in the presence
of complex interactions (Dilipkumar et al.,2011). RSM is
widely used for multivariable optimization studies in sev-
eral biotechnological processes such as the optimization of
media, process conditions etc. (Mannan et al.,2007; Pan
et al.,2008). Statistical optimization allows the interaction
amid possible in uencing parameters to be evaluated with
a limited number of experiments (Rodriguez et al., 2008).
Statistical designs such as Plackett-Burman and Response
surface methodology are common in practice for testing
multiple factors and interactions that can be quanti ed in
an error-free and robust manner (Mohan, 2014).
In order to fully exploit the prospective of this
enzyme for various applications, it is imperative to
investigate the possibility of enhancing its production
by using more ef cient production strategies (Rana and
Bhat, 2005). Hence in this study the process parameters
were optimized for maximum enzyme production adopt-
ing Plackett-Burman (PB) and Response Surface Meth-
odology (RSM) with Box Behnken design. The statisti-
cal software package DesignExpert® 7.0 (Stat Ease Inc.,
Minneapolis, and USA) was used.
MATERIALS AND METHODS
Tannic Acid was purchased from Sigma Aldrich, USA.
All other chemicals and reagents were used of analytical
grade and purchased from Hi-Media, India. Sterptomy-
ces sp. AT 13 used for the present study was screened
and isolated from Tannery Ef uent at G.I.D.C Naroda,
Ahmedabad and the organism was maintained on tannic
acid agar (TAA) medium. Tannase production by Sterp-
tomyces sp. AT 13 was carried out using tannase pro-
duction medium containing NaNO
3
0.6 % w/v, KCl 0.5
% w/v, MgSO
4
0.05 % w/v, K
2
HPO
4
0.05 % w/v, KH
2
PO
4
0.05 % w/v and 1 % (w/v) ltered sterilized tannic acid
(designated as TA broth). The broth was assayed for tan-
nase activity.
TANNASE ASSAY
The tannase activity was estimated by modi ed spectro-
photometric method of Sharma et al., 2000. Tannic Acid
was used as substrate. The basic principle of this assay
is based on the formation of chromogen between gallic
acid (released by the action of tannase on tannic acid)
and rhodanine (2-thio-4-ketothiazolidine). A standard
curve was prepared using gallic acid.Crude enzyme was
used for the assay. All the tests were performed in trip-
licates. One unit of tannase activity is de ned as the
amount of enzyme required to liberate 1μM of gallic
acid /min under de ned conditions. Enzyme activity
was expressed as U/ml/min.
Plackett–Burman design
Plackett–Burman design, an ef cient technique for
medium component selection (Plackett-Burman, 1946)
was employed to establish the factors that signi cantly
enhance the tannase production. Five independent vari-
ables (Table 1) were analysed in 12 experimental runs
(Table 2) for the production of tannase. Triplicates were
maintained for each experimental set up. The response
of these factors for the production of tannase was meas-
ured by Spectrophotometer method as proposed by
Sharma et al., (2000). The low level (-1) and the high
level (+1) of each factors are demonstrated in Table 2.
The statistical software design expert 6.0 was used for
analysing the experiment. Total 5 independent variables
Table 1. Screening of variables using a Plackett–
Burman design
Variable
codes
Variables Low
level (-1)
High
level (+1)
A Tannic Acid -1 +1
B KCl -1 +1
C NaNO
3
-1 +1
DKH
2
PO
4
-1 +1
EK
2
HPO
4
-1 +1

Archana and Lakshmi
BIOSCIENCE BIOTECHNOLOGY RESEARCH COMMUNICATIONS STATISTICAL OPTIMIZATION OF EXTRACELLULAR TANNASE PRODUCTION 693
Table 3. ANOVA for the experiment with PBD for Tannase Production by
AT 13
Analysis of variance table [Partial sum of squares - Type III]
Sum of Mean F p-value
Source Squares df Square Value Prob > F
Model 427.76 10 42.78 285.87 0.0460 signi cant
A-TANNIC ACID 153.08 1 153.08 1023.04 0.0199
B-KCl 9.12 1 9.12 60.93 0.0811
C-NaNO
3
15.01 1 15.01 100.30 0.0634
D-KH
2
PO
4
9.97 1 9.97 66.65 0.0776
E-K
2
HPO
4
11.96 1 11.96 79.93 0.0709
G-G 77.32 1 77.32 516.71 0.0280
H-H 69.89 1 69.89 467.08 0.0294
J-J 43.85 1 43.85 293.07 0.0371
K-K 19.15 1 19.15 127.99 0.0561
L-L 18.40 1 18.40 122.98 0.0573
Residual 0.15 1 0.15
Cor Total 427.91 11
Table 2. Plackett Burman design matrix for the screening of variables
F1 F2 F3 F4 F5 F 6 F 7 F 8 F 9 F 10 F11
Run
A:Tannic
Acid
B:KCl C:NaNO
3
D:KH
2
PO
4
E:K
2
HPO
4
F:F G:G H:H J:J K:K L:L R1
1 -1.00 1.00 1.00 1.00 -1.00 -1.00 -1.00 1.00 -1.00 1.00 1.00 1.62
2 1.00 1.00 1.00 -1.00 -1.00 -1.00 1.00 -1.00 1.00 1.00 -1.00 12.99
3 1.00 -1.00 1.00 1.00 -1.00 1.00 1.00 1.00 -1.00 -1.00 -1.00 7.17
4 -1.00 -1.00 -1.00 -1.00 -1.00 -1.00 -1.00 -1.00 -1.00 -1.00 -1.00 10.12
5 1.00 1.00 -1.00 1.00 1.00 1.00 -1.00 -1.00 -1.00 1.00 -1.00 16.53
6 -1.00 1.00 -1.00 1.00 1.00 -1.00 1.00 1.00 1.00 -1.00 -1.00 5.61
7 -1.00 -1.00 -1.00 1.00 -1.00 1.00 1.00 -1.00 1.00 1.00 1.00 5.91
8 1.00 -1.00 1.00 1.00 1.00 -1.00 -1.00 -1.00 1.00 -1.00 1.00 16.2
9 -1.00 -1.00 1.00 -1.00 1.00 1.00 -1.00 1.00 1.00 1.00 -1.00 2.58
10 -1.00 1.00 1.00 -1.00 1.00 1.00 1.00 -1.00 -1.00 -1.00 1.00 0.3
11 1.00 1.00 -1.00 -1.00 -1.00 1.00 -1.00 1.00 1.00 -1.00 1.00 15.75
12 1.00 -1.00 -1.00 -1.00 1.00 -1.00 1.00 1.00 -1.00 1.00 1.00 0.36
+ “sign indicates high level of the variable a nd” – “sign indicates low level”
along with 5 dummy variables generated by the soft-
ware. All the experiments were done in triplicate and the
average of lipase production was taken as response. The
obtained results are matched with the polynomial equa-
tion 1 in signi cant order 1:
Y = 0 + iXi (i=1, 2, 3……………k) (1)
Where Y is the response (Enzyme activity), 0 is model
intercept, i is linear coef cient, Xi is level of the inde-
pendent variables. The model was statistically analyzed
and the overall signi cance of the model was evaluated
by ANOVA (Analysis of variance) involving Fischer’s
test (F test). P (probability) values and determination
of coef cient obtained determines regression model’s
goodness of t.
Box-Behenken Design
After optimizing the various nutritional variables by
PBD, the 3 most signi cant variables (Tannic Acid, KCl
and KH
2
PO
4
) were further chosen for response surface
methodology using Box-Behnken design. Design-Expert®
statistical software was used to analyze the experimental
design. A Box-Behnken design with a set of 12 experi-
ments was generated (Table 4). Each variable was stud-
Archana and Lakshmi
694 STATISTICAL OPTIMIZATION OF EXTRACELLULAR TANNASE PRODUCTION BIOSCIENCE BIOTECHNOLOGY RESEARCH COMMUNICATIONS
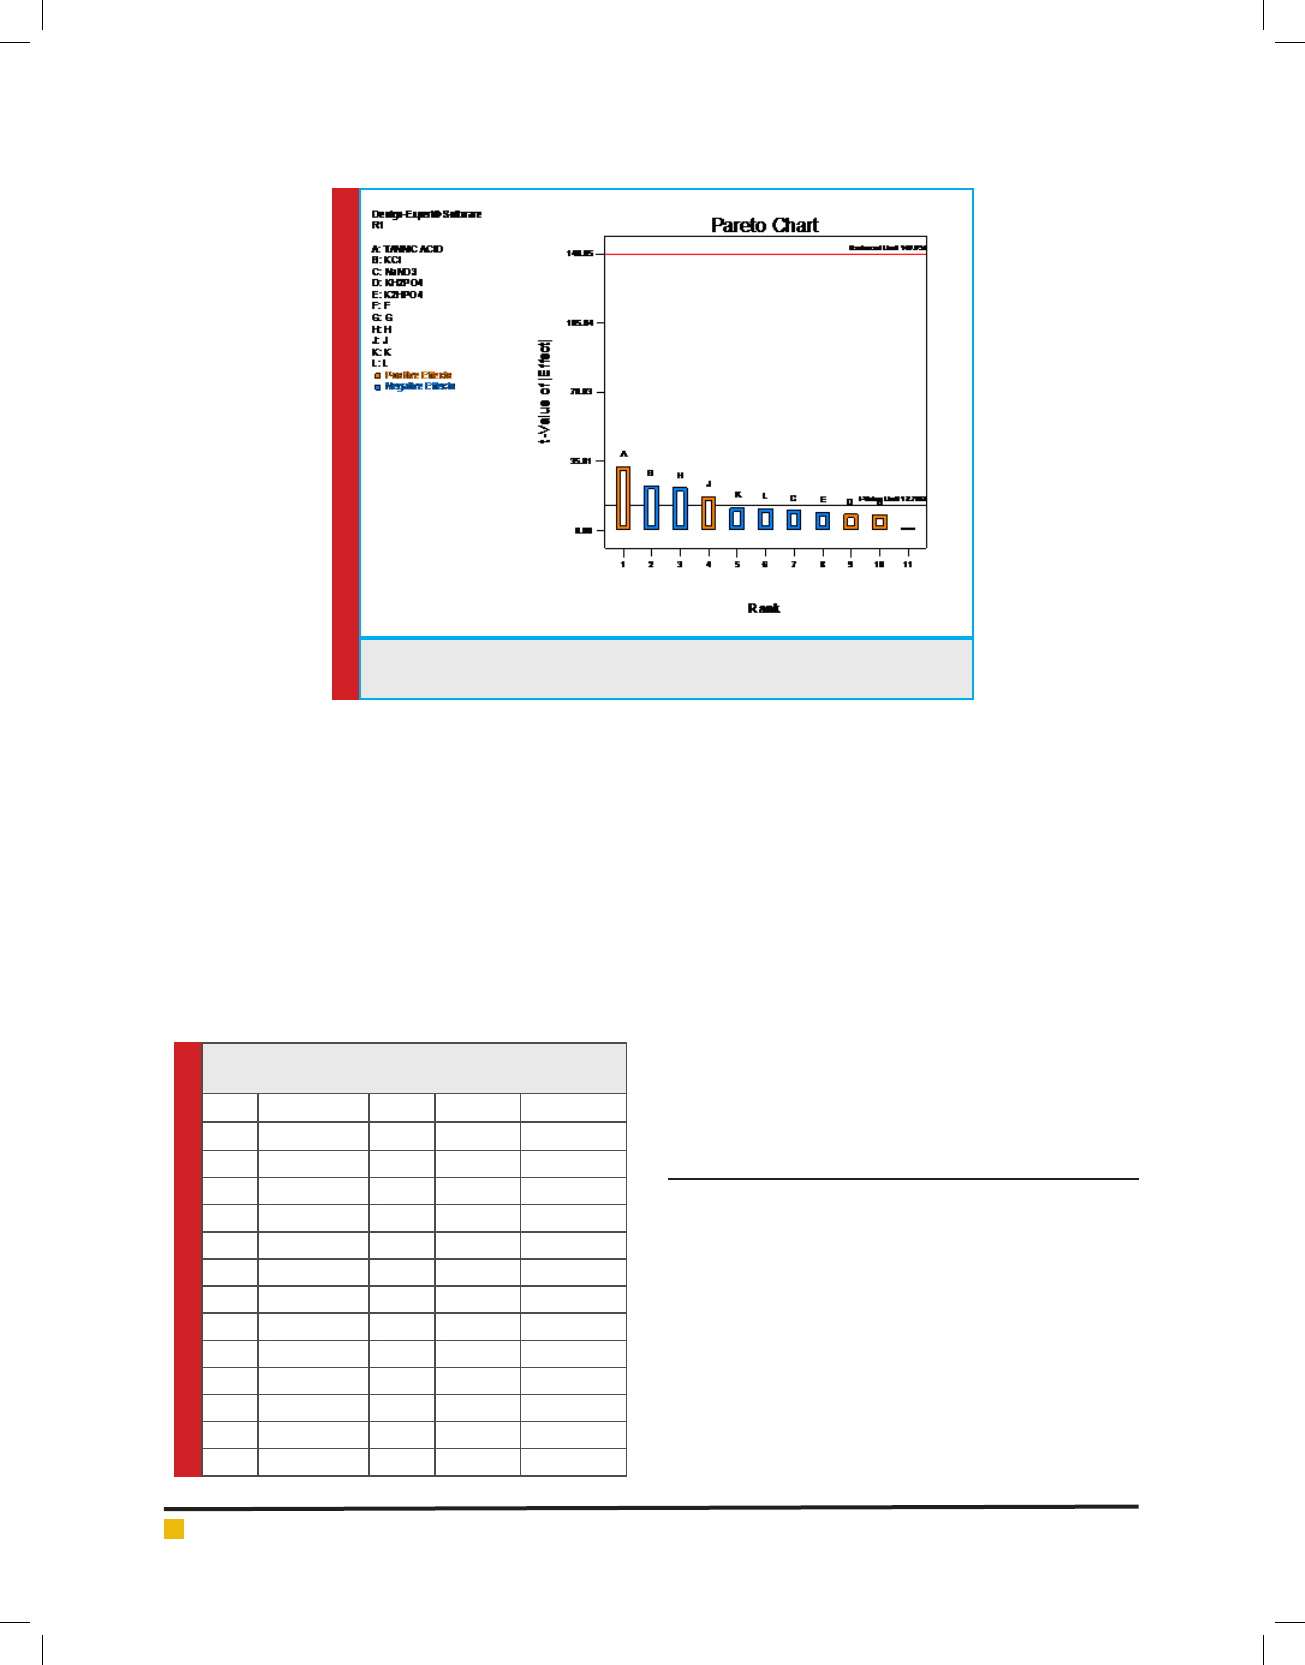
FIGURE 1. Pareto chart showing the effect of media components on tannase
activity using AT 13
Table 4. Box-Behenken (BB) design matrix of
optimizing factors in uence for tannase activity
Tannic Acid KCl KH
2
PO
4
E.A
Run A:A B:B C:C R1
1 -1.00 1.00 0.00 12.99
2 -1.00 0.00 -1.00 14.61
3 0.00 1.00 1.00 17.34
4 0.00 -1.00 1.00 12.33
5 0.00 1.00 -1.00 11.52
6 1.00 0.00 1.00 9.27
7 1.00 0.00 -1.00 10.71
8 1.00 1.00 0.00 2.61
9 -1.00 -1.00 0.00 9.66
10 1.00 -1.00 0.00 6.57
11 0.00 -1.00 -1.00 17.79
12 -1.00 0.00 1.00 18.12
ied at three levels, +1, 0, -1 where “0” is the central
coded value, “+1” high value and “-1” low value. The
fermentation was carried out in 250 ml asks containing
100 ml of the production medium. All experiments were
done in triplicate and tannase production obtained was
taken as the response.
The obtained results are matched with the polynomial
equation 2 in signi cant order
Y = 0 + iXi + iiXi 2 + ijXiXj (2)
where Y is the predicted response, 0 is the intercept
term, Xi and Xj are the input variables, i the linear
coef cients, ii the squared coef cients and ij the
interaction coef cients. The model was statistically
analyzed and the overall signi cance of the model was
evaluated by ANOVA (Analysis of variance) involving
Fischer’s test (F test). P (probability) values and coef-
cient of determination obtained determines regression
model’s goodness of t. The optimum values of each of
the 3 signi cant variables were determined by solving
regression equation.
The interactive effects of the variables on tannase
production were studied by analyzing the 3D and coun-
ter plots which depicted the interactions graphically.
Validation of the model: The statistical model was again
tested by carrying out the fermentation under the opti-
mum conditions that were obtained through the Box-
Behnken design.
RESULTS AND DISCUSSION
SCREENING OF VARIABLES BY PBD
Iimportant fermentative parameters can be effectively
and quickly picked up by applying PBD. The use of sta-
tistical tools not only saves time by simultaneously opti-
mizing several process variables with few experimental
runs but also reduces the cost of fermentation. A total
of 5 important variables Viz., tannic acid, KCl,NaNO
3,
KH
2
PO
4
and K
2
HPO
4
which were selected for statistical
optimization using PBD (Table 1).
Experiments were carried out based on Plackett–Bur-
man design and the results obtained are given in Table2.
Archana and Lakshmi
BIOSCIENCE BIOTECHNOLOGY RESEARCH COMMUNICATIONS STATISTICAL OPTIMIZATION OF EXTRACELLULAR TANNASE PRODUCTION 695
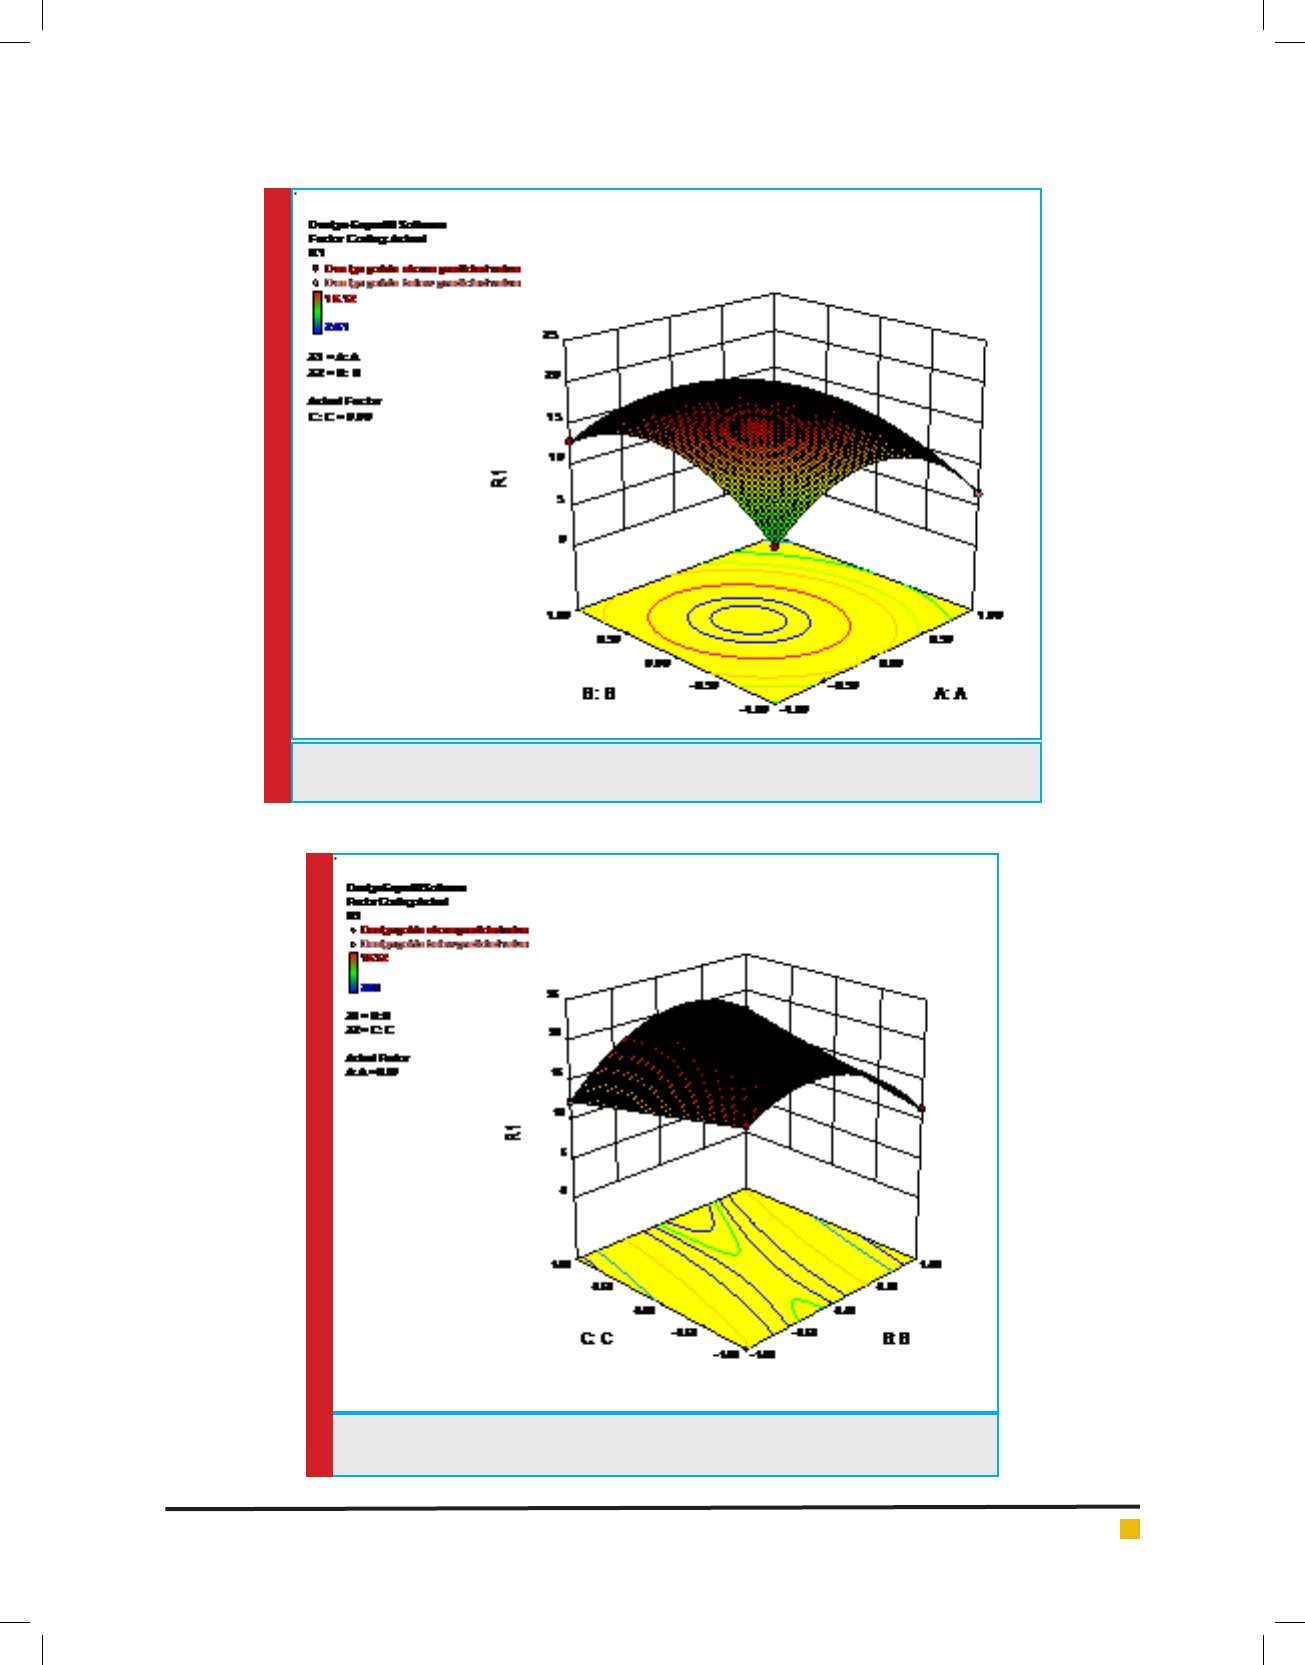
FIGURE 2a. Response surface plot of tannase production by AT 13 showing interaction between
tannic acid and KCl
FIGURE 2b. Response surface plot of tannase production by AT 13 showing interaction
between KCl and KH
2
PO
4
Archana and Lakshmi
696 STATISTICAL OPTIMIZATION OF EXTRACELLULAR TANNASE PRODUCTION BIOSCIENCE BIOTECHNOLOGY RESEARCH COMMUNICATIONS
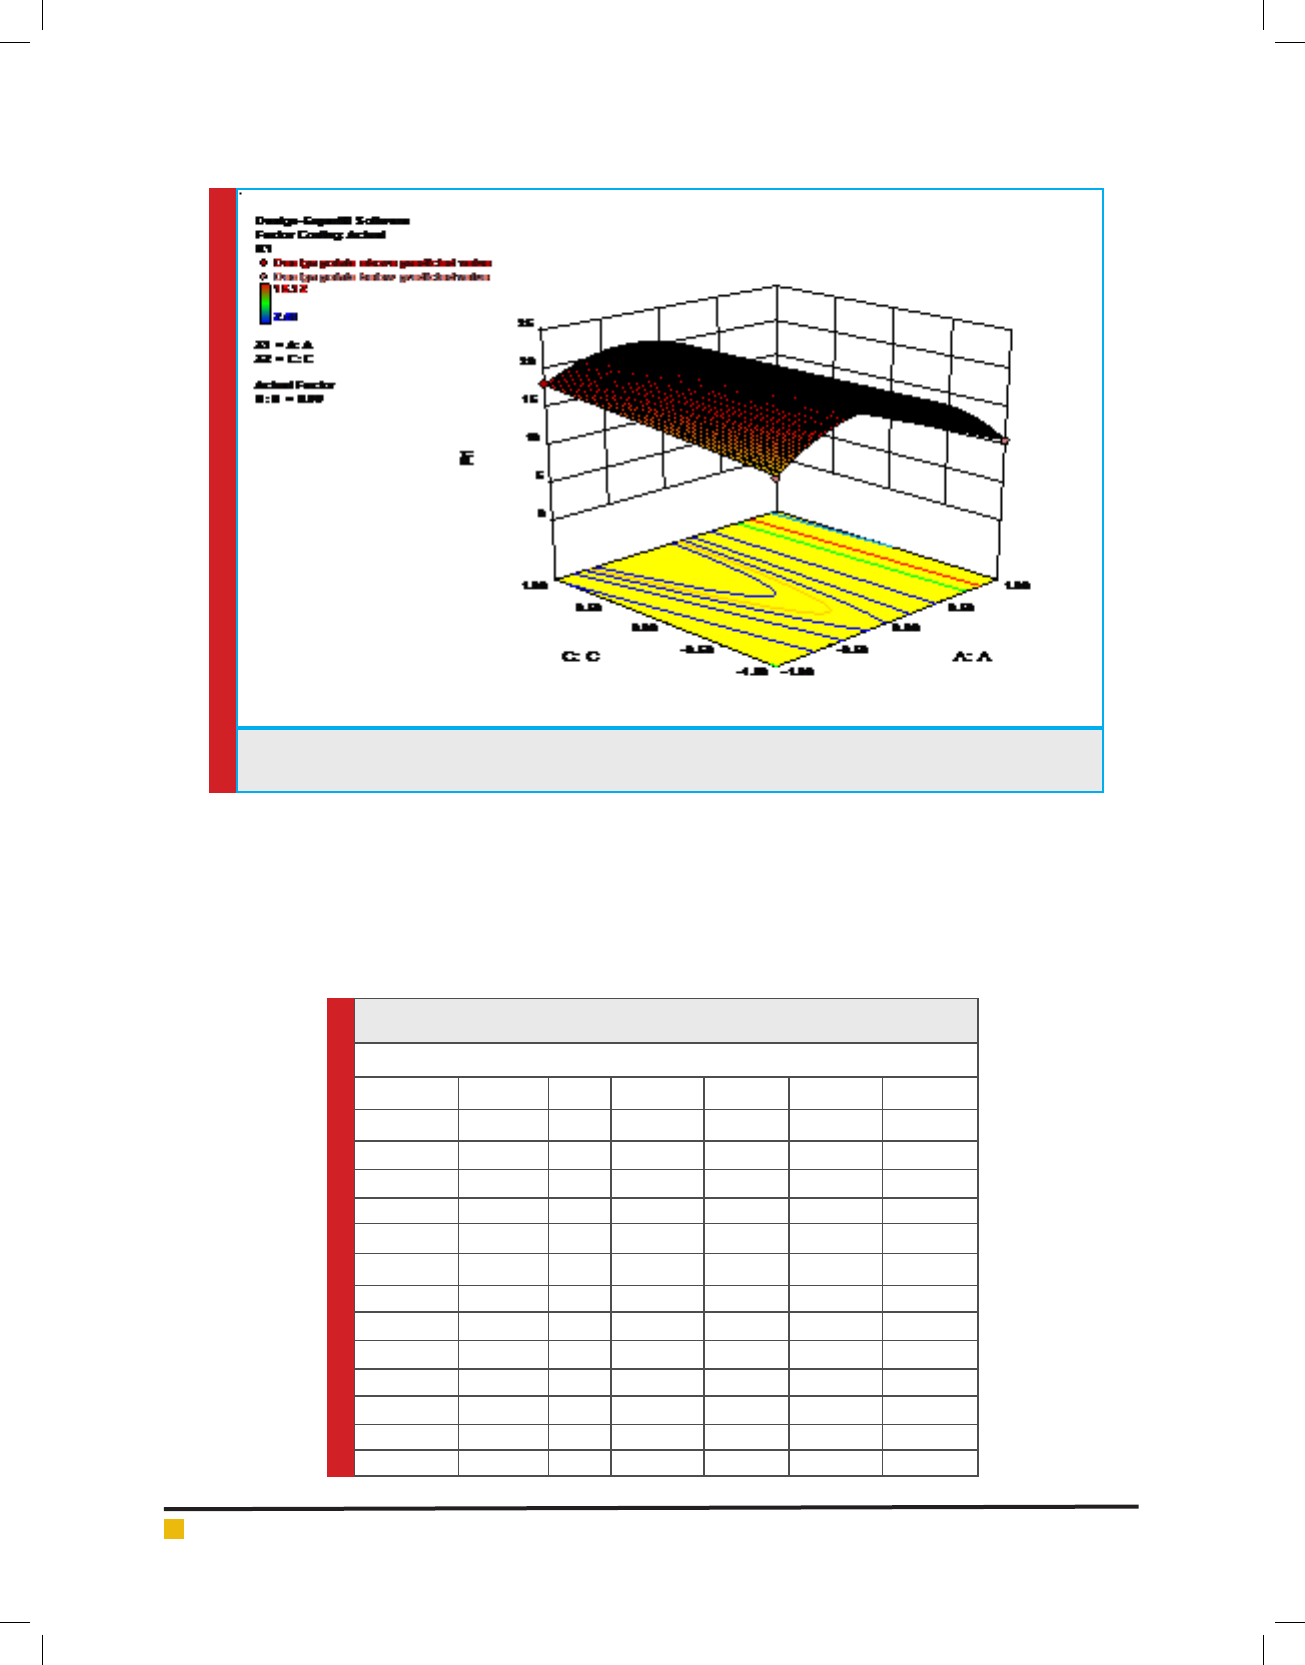
FIGURE 2c. Response surface plot of tannase production by AT 13 showing interaction between KH
2
PO
4
and
tannic acid
Table 5. ANOVA for Response Surface Quadratic Model for the production of
tannase by AT 13
Analysis of variance table [Partial sum of squares - Type III]
Sum of Mean F p-value
Source Squares df Square Value Prob > F
Model 239.38 8 29.92 187.04 0.0006 signi cant
A-A 85.94 1 85.94 537.18 0.0002
B-B 0.45 1 0.45 2.79 0.1934
C-C 0.74 1 0.74 4.61 0.1209
AB 13.29 1 13.29 83.05 0.0028
AC 6.13 1 6.13 38.29 0.0085
BC 31.81 1 31.81 198.84 0.0008
A2 92.14 1 92.14 575.97 0.0002
B2 54.50 1 54.50 340.66 0.0003
C2 0.000 0
Residual 0.48 3 0.16 187.04
Cor Total 239.86 11
From the table, it was observed that the variation in tan-
nase activity was 0.3–16.53U/ml/min. From the Pareto
chart (Fig.1), only tannic acid was found to be signi -
cant for the production of tannase by AT 13.
Figure 1 show the Pareto chart of effects of vari-
ables on tannase production which helps in. identify-
ing important factors that are mainly responsible for
enzyme production. From the chart it was evident that
the most important contributing factor for tannase pro-
duction was tannic acid only.
The ANOVA results are given in Table 3. The p-value
of ANOVA table serves as a tool for checking the sig-

Archana and Lakshmi
BIOSCIENCE BIOTECHNOLOGY RESEARCH COMMUNICATIONS STATISTICAL OPTIMIZATION OF EXTRACELLULAR TANNASE PRODUCTION 697
ni cance of each of the coef cients and is indicative
of interaction strength of each independent variable.
P-value less than 0.05 indicate that the model terms are
signi cant. In this experiment, the Model F-value of
285.87 implied that the model is signi cant in enhanc-
ing enzyme production In this case A (Tannic acid ), G
(Dummy), H (Dummy) and J (Dummy) gave signi cant
terms and B, C, D, K and E gave negative signi cant
terms.
Optimization of signi cant variables by Response
surface methodology (RSM)
Tannic acid was found to be signi cant by PBD was
optimized by RSM using Box-Behnken design for tan-
nase production. The response values in terms of tan-
nase activity and the matrix design were represented in
Table 4.
The results obtained by Box-Behnken were analyzed
by Analysis of variance (ANOVA) with a model F-value
of 187.04 indicating that the model was signi cant
(Table 5). Values of Prob > F less than 0.05 indicate that
the model terms are signi cant. In the present model
A, AB, BC, AC, A
2
, B
2
are signi cant model terms. The
Model F-value of 187.04 implies the model is signi -
cant. There is only a 0.06% chance that an F-value this
large could occur due to noise. The Values of “Prob >
F” less than 0.0500 indicate model terms are signi -
cant.This t of the model was checked with the coef-
cient of determination R
2
, which was calculated to be
0.9680. The determination coef cient (R
2
) of the model
was 0.9980 indicating that 99.80% of variability in the
response could be accounted by the model.
The ANOVA gave the following regression equation:
R1 = +19.97 -3.28* A -0.24* B+0.30* C-1.82*
AB-1.24* AC+2.82* BC-6.79* A
2
-5.22*+0.000* C
2
Where R1 is the tannase activity; A is tannic acid; B is
KCl; C is KH
2
PO
4
and the interactions AB, BC, AC, A
2
, B
2
are signi cant.
3D Surface Plots
The three-dimensional response surface curves were
plotted to study the interaction among different phys-
icochemical factors used and to nd out the optimum
concentration of each factor for maximum tannase pro-
duction.
For the construction of 3D plots, effect of two vari-
ables was considered while the other variable was held
at zero. These plots were helpful in understanding both
the individual and the interaction effects of the two fac-
tors. For the construction of 3Dplots, effect of two vari-
ables was considered while the other variable was held
at zero. From the 3D plots, it was clear that the tannase
activity signi cantly increased with increase in the con-
centration of tannic acid (A) reaching to its maximum
at 18.12 U/ml/min, where as the enzyme activity gradu-
ally increased with increase KCl (B) concentration and
then declined (Figure 2a).Signi cant interactions were
also present between KCl (B) and KH
2
PO
4
(C)with a low
p-value (0.0008) and between KH
2
PO
4
(C) and tannic
acid(A) with a low p-value (0.0085) (Figure 2b and 2c).
Validation of the Model: Validation of the response sur-
face model was con rmed by using opt imum conditions
obtained by the model. The experimental values were
very close to the predicted values and hence it was con-
cluded that the model was successfully validated.
CONCLUSION
The response surface methodology was applicable for
the production of tannase from Streptomyces sp. AT13.
In the present study,optimum conditions for tannase
production by Streptomyces sp. AT13 was done using
Plackett-Burmen design followed by Response surface
methodology using Box-Behnken design. From among
6 fermentative variables that were studied, 5 signi cant
variables were picked up by PBD. Among 5 variables
from PBD, 3 were further optimized by Box-Behnken
design. Analysis of variance (ANOVA) showed the sig-
ni cance of the model and the validity of the model was
con rmed by the veri cation experiments. P-value less
than 0.05 indicate that the model terms are signi cant.
The optimum values of parameters obtained through
RSM were 1 % tannic acid, 0.5 % KCl and 0.1% KH
2
PO
4
to achieve maximum tannase production.
ACKNOWLEDGMENTS
The Authors are thankful to the head of Department of
Biotechnology and Microbiology, KSV University for
providing all the laboratory facilities. The authors are
also thankful to Biogene department of Gujarat State
Biotechnology Mission (GSBTM), Gandhinagar, Gujarat,
India for bacterial strain identi cation.
COMPLIANCE WITH ETHICAL STANDARDS
Con ict of Interests: There are no con icts of interest.
REFERENCES
Barthomeuf, C., Regerat, F., Pourrat, H. (1994). Production,
puri cation and characterization of a tannase from Aspergil-
lus niger LCF 8. J. Ferment. Bioeng. 3: 320-323.
Bate-Smith, E.C. and Swain, T. (1962). Flavonoid compounds.,
In: Comparative biochemistry. Academic Press, Pp 755-809
(Eds) Mason and A.M. Florkin. New York.

Archana and Lakshmi
698 STATISTICAL OPTIMIZATION OF EXTRACELLULAR TANNASE PRODUCTION BIOSCIENCE BIOTECHNOLOGY RESEARCH COMMUNICATIONS
Beena P.S., Soorej, M.B., Elyas, K.K., Sarita, G.B., Chandrasekaran,
M. (2010). Acidophilic tannase from marine Aspergillus awamori
BTMFW032. J Microbiol Biotechnol., 20:1403–1414.
Bhat, T.K., Singh, B. and Sharma, O.P. (1998). Microbial degrada-
tion of tannins–a current perspective. Biodegradation, 9:343-357.
Dilipkumar, M., Rajasimman, M., Rajamohan, N. (2011). Appli-
cation of statistical design for the production of inulinase
by Streptomyces sp. using press mud. Front Chem Sci Eng.;
5(4):463–470. doi: 10.1007/s11705-011-1112-1.
Haslam, E. (1989). In Plant Polyphenols Plant Polyphenols: Vege-
table Tannins Revisited. Cambridge: Cambridge University Press.
Cambridge, Pp 230. Cambridge.
Lekha, P.K., Lonsane, B.K. (1997). Production and application
of tannin acyl hydrolase: state of the art. Adv Appl Microbiol
44:215–260.
Mannan S., Fakhrul
´
-Razi, A., Alam, M.Z. (2007). Optimiza-
tion of process parameters for the bioconversion of activated
sludge by Penicillium corylophilum, using response surface
methodology. J Environ Sci. (China):19(1):23-8.
Mcleod, M.N. (1974). Plant tannins – their role in forage qual-
ity. Nutrition Abstracts and Reviews 44:803–815.
Mohan, S. K. (2014). Optimization of tannase production from
agro industrial wastes- kinetics and modelling. From: Ph. D.
Thesis. Department of Chemical Engineering, Annamalai Uni-
versity, Annamalainagar, Tamilnadu, India.
Pan, C.M., Fan, Y.T., Xing, Y., Hou, H.W., Zhang, M.L. (2008).
Statistical optimization of process parameters on biohydrogen
production from glucose by Clostridium sp. Fanp2. Bioresour
Technol.; 99(8):3146-54.
Rana, N. K. and Bhat, T. K. (2005). Effect of Fermentation
System on the Production And Properties of Tannase from
Aspergillus niger van Tighem MTCC 2425. Journal of Applied
Microbiology. 51: 203-212.
Rodríguez, H., De las Rivas, B., Gómez-Cordovés, C., Munoz, R.
(2008). Degradation of tannic acid by cell-free extracts ofLac-
tobacillus plantarum.Food Chem.107:664–670.
Sharma, S., Bhat, T.K., Dawra, R.K. (2000). A Spectrophoto-
metric Method for Assay of Tannase Using Rhodonine. Anal.
Biochem. 278: 85-89.
Van de Lagemaat, J. and Pyle, D.L. (2006). Tannase. In: Enzyme
Technology. Pp 380-397 (Eds) A. Pandey, A.C. Webb, C.R. Soc-
col and C. Larroche,1st Edn., Springer, New York.