Chemical Engineering
Communication
Biosci. Biotech. Res. Comm. 10(1): 172-177 (2017)
Simulation study of oil production rate and water
coning in oil reservoirs using ECLIPSE software
Abdolreza Dabiri*, Mohammad Afkhami Karaei and Amin Azdarpour
Department of Petroleum Engineering, Marvdasht Branch, Islamic Azad University, Marvdasht, Iran
ABSTRACT
Oil reservoirs are usually consist of hydrocarbons (oil and gas) and bottom water. The natural depletion of the res-
ervoir occurs by the natural energy of the reservoir. Reservoirs pressures are usually high in the beginning and this
will transmit the uid from the reservoir to the surface. However, after some time of production, when the reservoir
pressure falls down, water comes into the formation and starts to produce through the wellbore. This happens because
of the disturbance in gravitational force in the reservoir, which results in water production along with oil. Reducing
well productivity, water separation and handling, corrosion and environmental issues are the major challenges asso-
ciated with water coning phenomena. In this study, the black oil model of ECLIPSE software was used to study the
water coning issue in an oil reservoir. Different production plans were studied and their effect on water coning was
investigated. In addition, the best production plan was introduced using simulation results. The simulation results
showed that pressure draw down in the reservoir decreased with decreasing oil production rate, which inherently
decreases the water production rate. Moreover, the simulation results showed that oil recovery factor can be increased
signi cantly by decreasing the amount of water production.
KEY WORDS: WATER CONING, OIL PRODUCTION, IMPROVED OIL RECOVERY, ECLIPSE
172
ARTICLE INFORMATION:
*Corresponding Author: dabiri211@yahoo.com
Received 16
th
Dec, 2016
Accepted after revision 14
th
March, 2017
BBRC Print ISSN: 0974-6455
Online ISSN: 2321-4007 CODEN: USA BBRCBA
Thomson Reuters ISI ESC and Crossref Indexed Journal
NAAS Journal Score 2017: 4.31 Cosmos IF : 4.006
© A Society of Science and Nature Publication, 2017. All rights
reserved.
Online Contents Available at: http//www.bbrc.in/
INTRODUCTION
Water production from oil wells is a common occur-
rence in oil elds. Water coning, increasing water oil
contact level, and water ngering especially in injec-
tion wells are the major reasons of waster produc-
tion in oil elds. In general, water production is not a
favorable occurrence. Reducing well productivity, water
separation and handling, corrosion and environmental
issues are the major challenges associated with water
coning phenomena (Armenta and Wojtanowicz, 2002,
Bahadori and Nouri, 2012; Mauriya et al., 2014; Carpen-
ter, 2015; Moortgat and Firoozabadi, 2016; Kamari et al.,
2016).
Dabiri, Karaei and Azdarpour
Disturbance in gravitational and viscous force around
the perforated area is the major cause of water coning
in oil elds. An upward dynamic force upon reservoir
uid is induced by the ow of oil from the reservoir
to the well. Adding the effects of pressure draw down
at the wellbore will causes the water to move upward
and be produced at the surface (Pang et al, 2008, Ansari
and Johns, 2013; Dos Santos and Oliveira, 2014; Ghane
Ezabadi, 2015; Hatzignatiou et al., 2016; Carpenter,
2016; Zeinijahromi and Bedrikovetsky, 2015; Zeinijah-
romi and Bedrikovetsky, 2016).
Different factors including mobility ratio, the extent
of penetration, vertical permeability, oil zone thick-
ness, and most importantly the production rate are the
major parameters that affect the severity of water coin-
ing. This phenomenon is more complicated in fractured
reservoirs, where dual porosity exists, which results in
the formation of two cones. In this case, two different
cones with two different rates, one in matrix and one
in fracture may form, which creates a very complicated
situation at the surface (Egbe and Appah, 2005; Lakatos
et al., 2014; Mohammed et al., 2014; Cinar et al., 2016;
Li et al., 2016; Zemtsov and Lytkin, 2016).
Permadi and Jayadi (2010) proposed a new calculation
method for determining the water coning in horizontal
wells. The post breakthrough performance in horizontal
wells was calculated and predicted using a semi empiri-
cal method in their study. They used two sets of eld
data where in the rst case no water cut was observed
and in the second case water cut occurred after produc-
tion started. Results of prediction for both cases are in
very good agreement with the eld data.
In another study by Buranatavonsom (2011), water
coning was managed successfully in a gas reservoir using
downhole water pump ood. In this method, water con-
ing is reduced signi cantly. In addition, it is not required
to produce water into surface and also to drill a well for
water production. Therefore, it can minimize cost of drill-
ing and water treatment system. Moreover, in another
study by Jin and Wojtanowics (2010), the feasibility of
water coning control installation in reservoir with down-
hole water sink (DWL) was investigated. The DWL feasi-
bility was tested with a simple analytical model derived in
this study. Also, a good match was obtained when com-
paring the model-calculated data to real production data.
Their work was comparable with the resulted presented in
the literature (Qin et al., 2014; Alblooshi and Wojtanow-
icz, 2014; Anthony and Al-Mosaileekh, 2016; Muktadir et
al., 2016; Yoshida and Hill, 2016).
In this study, different scenarios including different
oil ow rate, water cut, blocking of critical penetra-
tion intervals and drilling of new horizontal wells were
investigated and the best production plan was selected
accordingly.
MATERIALS AND METHODS
RESERVOIR CHARACTERISTICS AND SIMULATION STUDY
The oil reservoir is an under saturate oil reservoir with
no initial gas cap present. Water, oil and solution gas
are the available phases exists in the reservoir, where oil
is in contact with water in the fth layer. Table 1 rep-
resents porosity and permeability in three directions (Z,
Y, Z). On the other hand, Table 2 represents the proper-
ties of reservoir rock and uid. The reservoir is divided
into three directions of X, Y, and Z. Black oil model of
ECLIPSE software has been used to simulate water con-
Table 1. Reservoir rock characteristics
Porosity (layer 1) (ave.) 0.04425
(layer 2) (ave.) 0.01485
(layer 3) (ave.) 0.0406
(layer 4) (ave.) 0.02955
(layer 5) (ave.) 0.037
Permeability X (md) (layer 1) (ave.) 2455
(layer 2) (ave.) 11
(layer 3) (ave.) 825.26
(layer 4) (ave.) 20
(layer 5) (ave.) 1300
Permeability Y (md) (layer 1) (ave.) 2455
(layer 2) (ave.) 11
(layer 3) (ave.) 825.26
(layer 4) (ave.) 20
(layer 5) (ave.) 1300
Permeability Z (md) (layer 1) (ave.) 11
(layer 2) (ave.) 1.09
(layer 3) (ave.) 71
(layer 4) (ave.) 50.44
(layer 5) (ave.) 84
Table 2. Reservoir characteristic
Dx (ft) (ave.) 260
DY (ft) (ave.) 300
DZ (ft) (ave.) 115
Tops (ft) 2552 to 3235
Net to Gross ratio (NTG) 1.0
Pressure (psia) 5684
Temperature (F) 260
Initial Oil saturation 0.8268
Initial Gas saturation 0.0
Initial Water saturation 0.1732
Density (lb/ft3) 52.86
API 35
BIOSCIENCE BIOTECHNOLOGY RESEARCH COMMUNICATIONS SIMULATION STUDY OF OIL PRODUCTION RATE AND WATER CONING IN OIL RESERVOIRS 173
Dabiri, Karaei and Azdarpour
ing in this reservoir. Equations were solved fully implic-
itly since the error term is minimized as compared to
Impes method. The solution method in this study was
recommended by the previous authors in the literature
(Zeinijahromi et al., 2014; Langaas and Hjellbakk, 2015;
Zhao et al., 2016; Zeinijahromi and Bedrikovetsky, 2016).
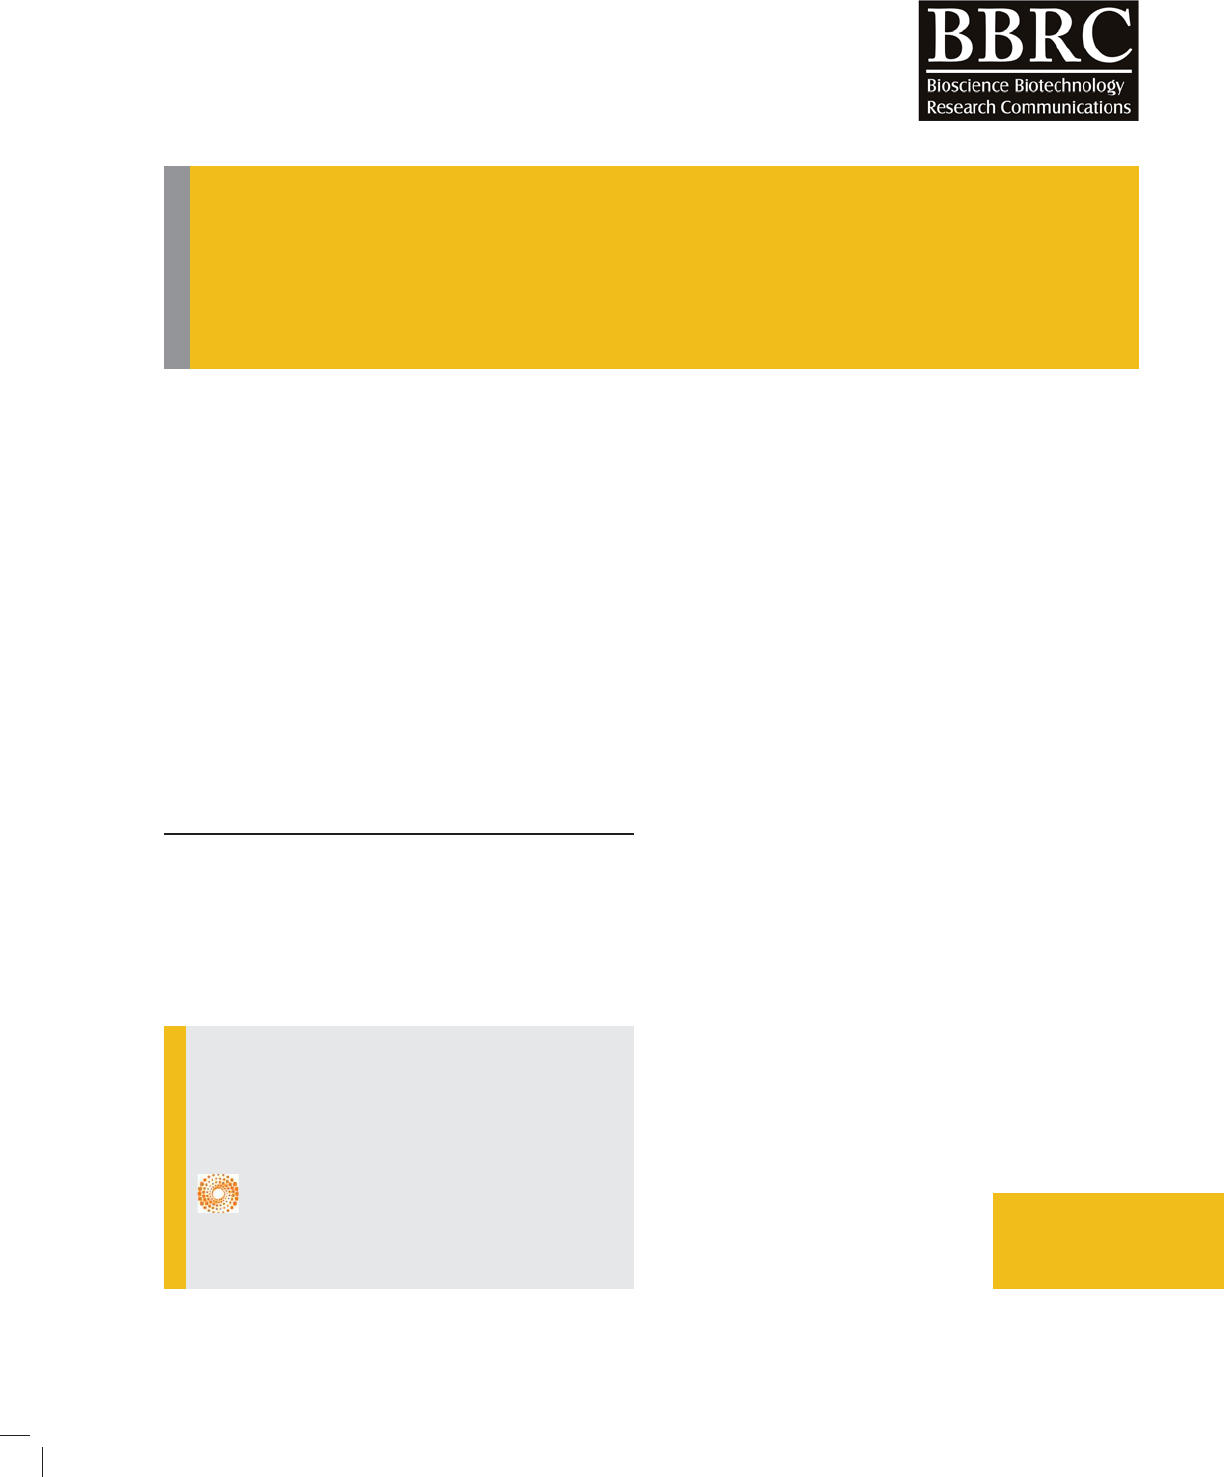
The production from this reservoir was started in
1998 using 12 production wells. Oil production rate is
the main parameters that affect water coning severity in
oil reservoirs. Figure 1 represents the three-dimensional
picture of the wells in this reservoir. Thus, ve different
scenarios were introduced and their effect on water con-
ing was investigated.
RESULTS
In the rst scenario, oil production rate from all wells
were assumed to be as default values and no limitation
on production rate was applied. The main objective of
this production scenario is to observe the productivity of
each well. As is shown in Figure 1, well number 5, 9, 10,
and 11 are near the water level in the reservoir and the
possibility of water production in these wells are higher
FIGURE 1. Three dimensional location of
production wells.
FIGURE 2. Total oil and water production
from well number 5.
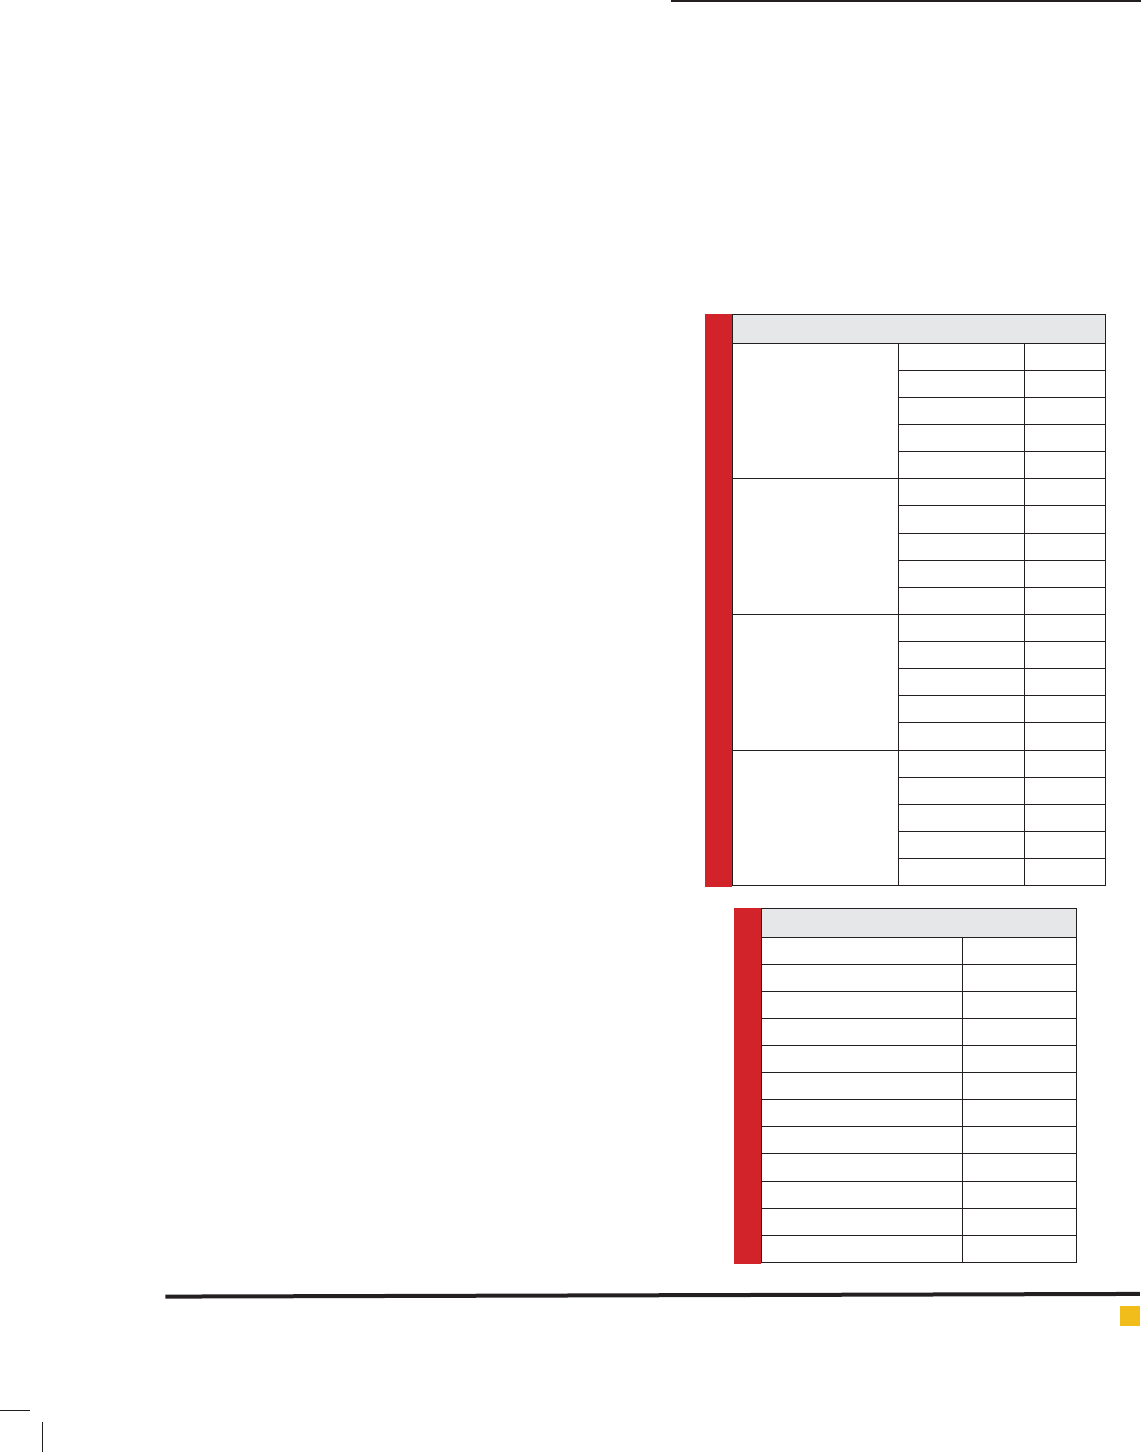
FIGURE 3. Total oil and water production
from well number 9.
FIGURE 4. Total oil and water production
from well number 11.
FIGURE 5. Total oil and water production
from well number 10.
than the other wells. Thus, simulation study was focused
on the behavior of these wells. Figures 2-5 represents
the oil and water production from these four production
wells. As shown in these wells, after some time of pro-
duction from this reservoir, water starts to come to the
surface and produce along with oil.
174 SIMULATION STUDY OF OIL PRODUCTION RATE AND WATER CONING IN OIL RESERVOIRS BIOSCIENCE BIOTECHNOLOGY RESEARCH COMMUNICATIONS
Dabiri, Karaei and Azdarpour
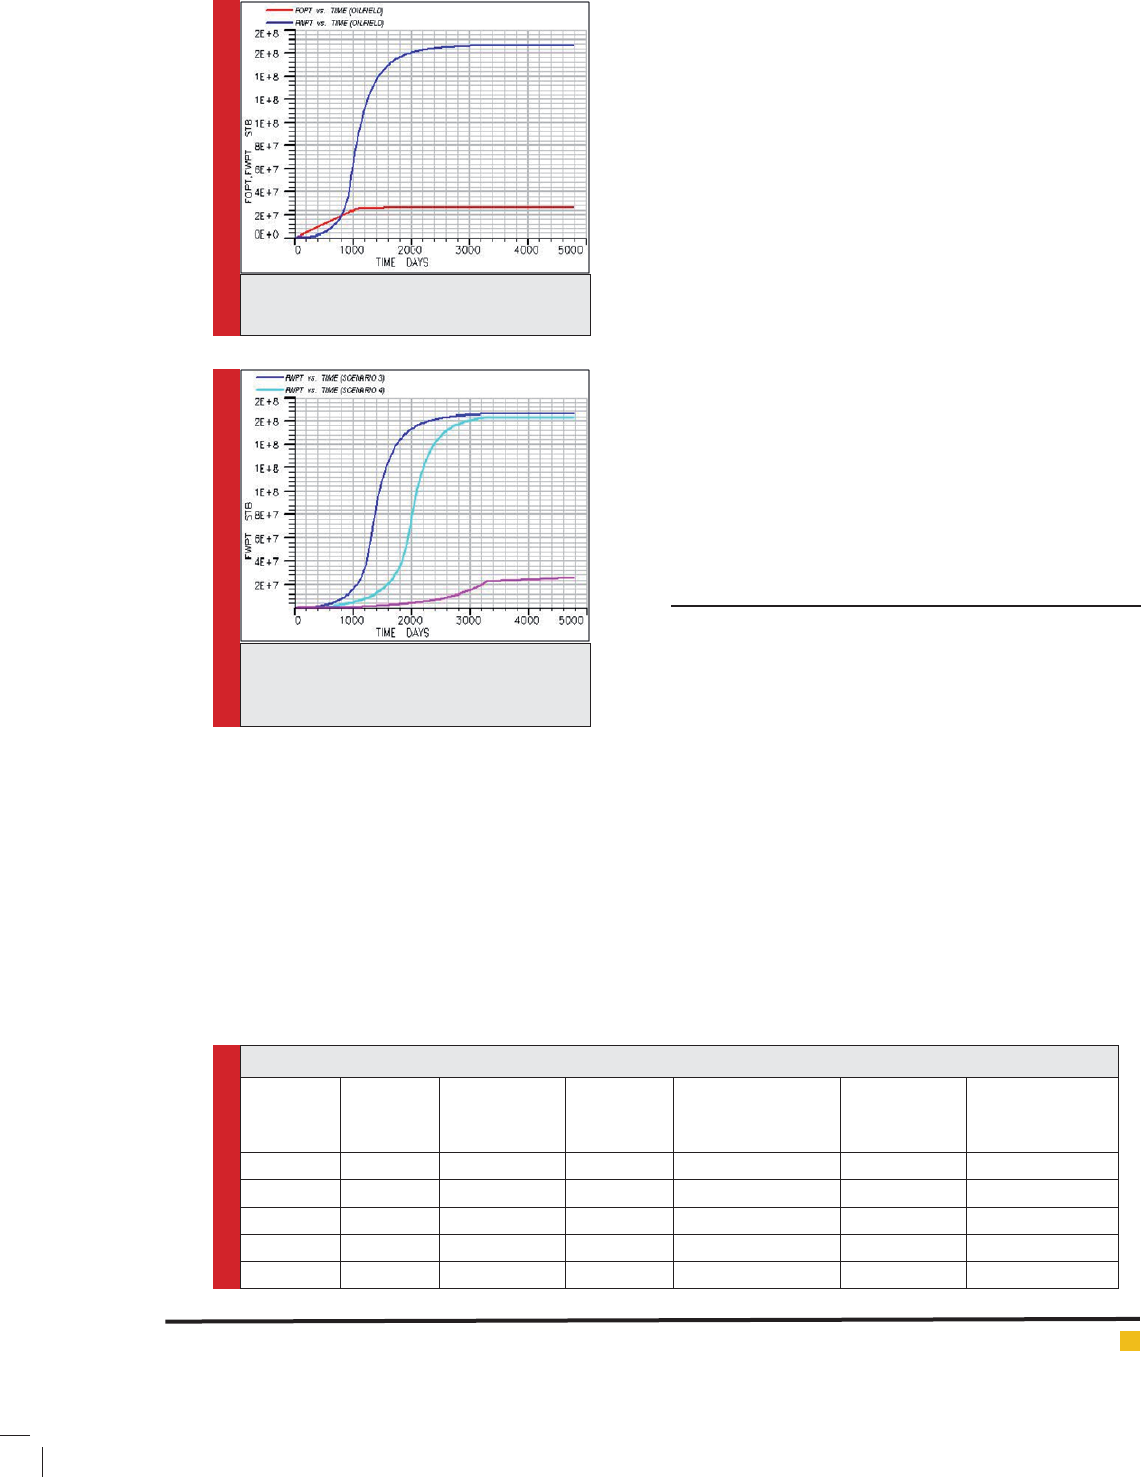
tion is increased with increasing. In the forth scenario,
production occurs from all the wells under constant
production rate of 1000 bbl/day. As shown in this g-
ure, the duration of water production is increased with
increasing. In the fth scenario, production occurs from
all the wells under constant production rate of 500 bbl/
day. The simulation results showed that water produc-
tion is decreased with oil production. In addition, a lesser
amount of water is produced at the surface as compared
to other scenarios. In addition, reducing the oil produc-
tion rate also increases recovery factor. Figure 7 repre-
sents a comparison on total amount of water production
from this reservoir under different scenarios.
Another conclusion from the simulation study is that
with decreasing oil production rate, recovery factor is
increased. In addition, the total amount of produced is
reduced as well. This happens because by lowering the
oil ow rate, pressure draw down is reduced, thus the
water movement to upper layers is delayed and reduced.
Table 3 represents a summary of the total amount of
oil and water production, recovery factor and water cut
level under these ve production scenarios.
DISCUSSIONS
Liminar ow condition exists in the wellbore when the
a well is producing with constant ow rate and pressure
gradient. In this case, viscous forces are less than the
gravitational forces in the well, which inhibit the prod-
cution of cone in the well. On the other hand, when the
pressure drop is signifcant in the wellbore, viscose forces
are dominant over the gravitational forces. This crea-
tes afavorable condition for the cone to occure. Water
coning in the wellbore continues to increase with incra-
sing the pressure drop in the wellbore (Bautista et al.,
2014; Pal and Mandal, 2015; Izwan Ismail, 2015a; Desa-
mal et al., 2015; Loh and Premanadhan, 2016). At the
optimum ow rate of the well, viscous forces are always
lower than the gravitational forces, which inhibites the
water coning to achive to the wellbore. In cases where
production ow rate is more than the optimum ow rate
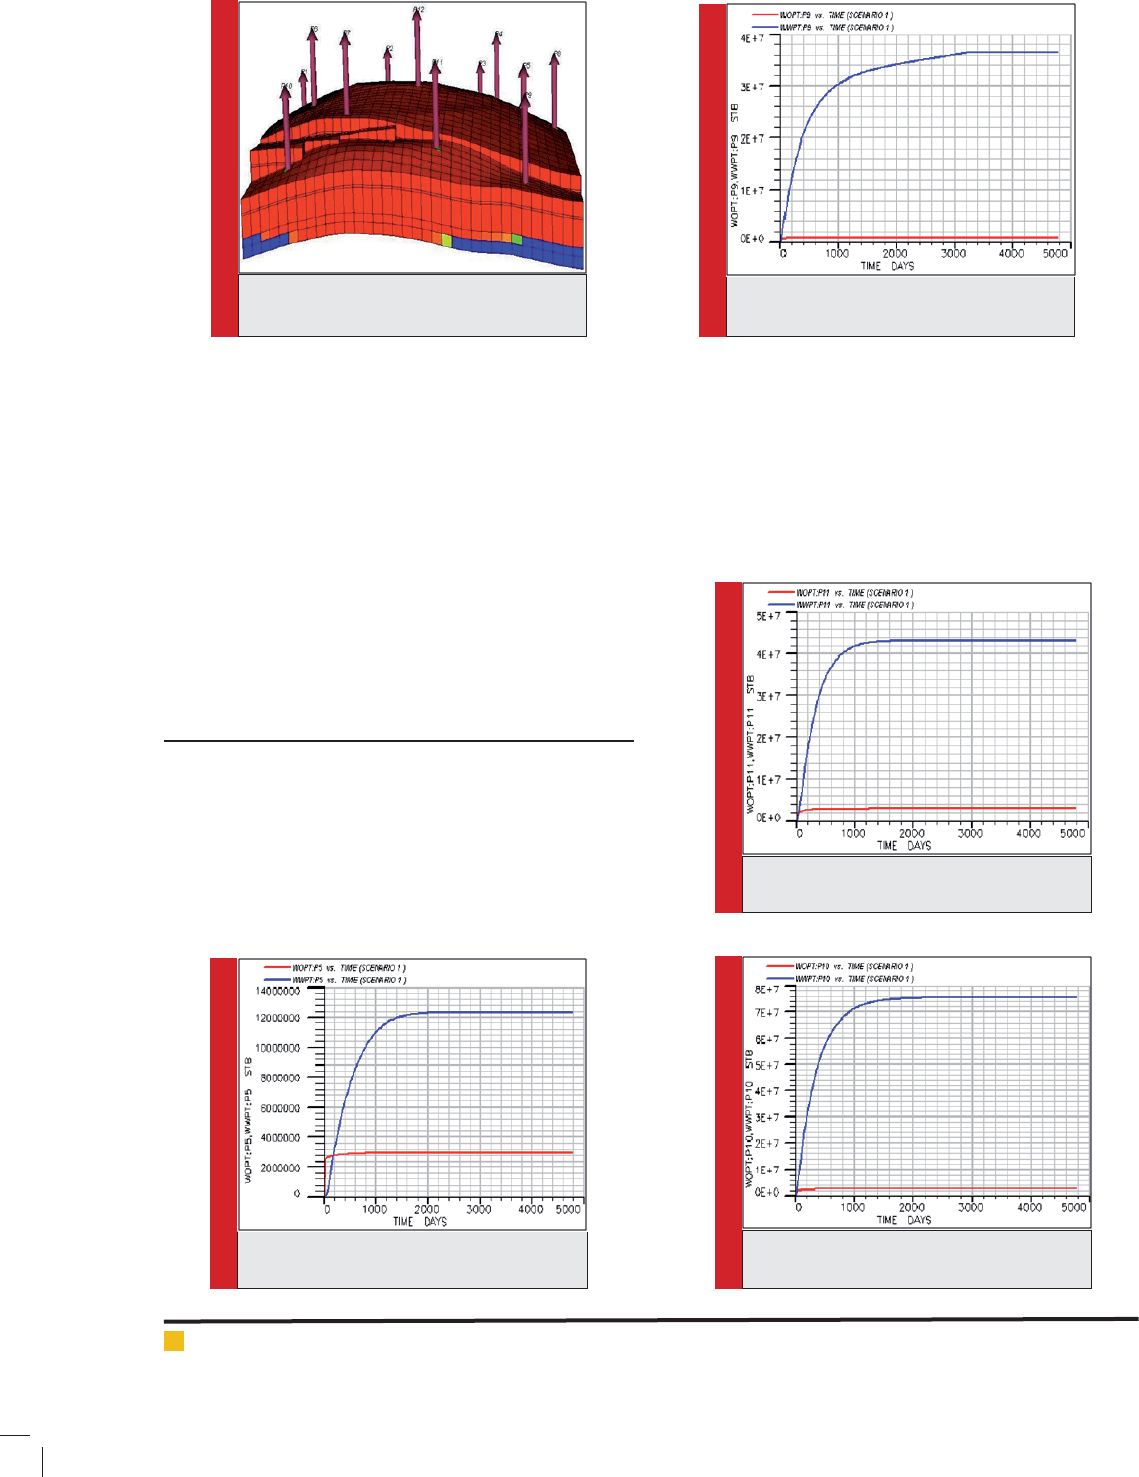
FIGURE 6. Total oil adn water production in
the second scenario.
FIGURE 7. Comparison of the total water
production in the third, forth and fth sce-
nario.
Table 3. summary of production rates under different scenarios
Scenario
Recovery
factor (%)
Total water
prodcution,
FWPT (STB)
Formation
water cut,
FWCT (%)
Total formation oil
prodcution,
FOPT (STB)
Oil
prodcution
rate (bbl/day)
Number of
production wells
NO. 1 19.44 1.703×10
8
0.995 19873336 default 12
NO. 2 25.36 1.671×10
8
9.997 25924804 2000 12
NO. 3 25.59 1.660×10
8
0.991 26157852 1500 12
NO. 4 25.58 1.632×10
8
0.935 26149984 1000 12
NO. 5 25.55 26346124 0.391 26157336 500 12
In the second scenario, production occurs from all
the wells under constant production rate of 2000 bbl/
day and the results are shown in Figure 6. As shown in
this gure, the duration of water production is reduced
with increasing. In addition, with increasing the oil pro-
duction form the reservoir, water production increases
as well.
In the third scenario, production occurs from all the
wells under constant production rate of 1500 bbl/day.
As shown in this gure, the duration of water produc-
BIOSCIENCE BIOTECHNOLOGY RESEARCH COMMUNICATIONS SIMULATION STUDY OF OIL PRODUCTION RATE AND WATER CONING IN OIL RESERVOIRS 175

Dabiri, Karaei and Azdarpour
of the well this water coning occurs, which results in
water prodcution at the surface (Izwan Ismail, 2015b;
Liu and Bai, 2015; Hatzignatiou et al., 2016; Rozhko,
2016; Cazarez-Candia and Piedra-González, 2017). The
same pohenomenon happend in this study as shown in
Figures 2-7.
CONCLUSIONS
Water production is affected by the pressure draw down
in the wellbore. Decreasing oil prodcution rate decreases
the pressure draw down in the formation, thus decreases
the amount of water production at the surface. Changing
oil production rate is only effective when no water con-
ing is occurs. In addition, oil recovery factor is increased
by decreasing the total amount of water production
from the formation.
ACKNOWLEDGMENT
The authors would like to appreciate the Department
of Petroleum Engineering, Marvdasht Branch, Islamic
Azad University, Marvdasht, Iran for the provision of
the laboratory facilities necessary for completing this
work.
REFERENCES
Alblooshi, Y.A., Wojtanowicz, A.K. (2014) Multi-Lateral Wells
with Downhole Water Control and Disposal in Heavy Oil Res-
ervoirs with Bottom Water – A Case Study. Abu Dhabi Interna-
tional Petroleum Exhibition and Conference, 10-13 November,
Abu Dhabi, UAE.
Ansari, R.Z., Johns, R.T. (2013). Superposition of steady-
stateconingsolutions for multiple wells with reservoir bound-
aries. Journal of Petroleum Science and Engineering, 108:
362–369.
Anthony, E., Al-Mosaileekh, S. (2016). Downhole Water Sink
Technology Improves Recovery and Rates from Strong Water
Drive Reservoirs in North Kuwait – A Pilot Case Study. Inter-
national Petroleum Technology Conference, 14-16 November,
Bangkok, Thailand.
Armenta, M., Wojtanowicz, A. (2002). Severity of Water Con-
ing in Gas Wells. SPE Gas Technology Symposium, Alberta,
Canada.
Bahadori, A., Nouri, A. (2012). Prediction of critical oil rate for
bottom water coning in anisotropic and homogeneous forma-
tions. Journal of Petroleum Science and Engineering, 82-83:
125–129.
Bautista, E.V., Meneses Barillas,J.L., Dutra Jr, T.V., da Mata,
W. 2014. Capillary, viscous and gravity forces in gas-assisted
gravity drainage. Journal of Petroleum Science and Engineer-
ing, 122: 754–760.
Buranatavonsom, B. (2011). Water Coning Management in Gas
Reservoir via Downhole Water Dump Flood. SPE Annual Tech-
nical Conference and Exhibition, Colorado, USA.
Carpenter, C. (2015). Optimized Design of Autonomous In ow-
Control Devices for Gas and Water Coning. Journal of Petro-
leum Technology, 67(12): 70-71.
Carpenter, C. (2016). Optimization of Upper Burgan Reser-
voir Multilateral Well With In ow-Control Device. Journal of
Petroleum Technology, 68(2):68-69.
Cazarez-Candia, O., Piedra-González, S. (2017). Modeling of
heavy oil-water core-annular upward ow in vertical pipes
using the two- uid model. Journal of Petroleum Science and
Engineering, 150: 146–153.
Cinar, Y., Shehab, M.A., Dallag, M.M., Jama, A.A. (2016). Auto-
mated Surveillance and Diagnostic Work ow for the Manage-
ment of Water Production in Naturally-Fractured Carbonate
Reservoirs. SPE Annual Technical Conference and Exhibition,
26-28 September, Dubai, UAE.
Desamala, A.B., Dasmahapatra, A.K., Mandal, T.K. (2015). An
appraisal of viscous oil–water two-phase ow through an
undulated pipeline in peak con guration. Experimental Ther-
mal and Fluid Science, 68, 177–186.
Dos Santos, M.D.L., Oliveira, F.R. (2014) Fault Reactivation
as Mechanism of Early Water Production in Unconsolidated
Sandstones Reservoirs. SPE Annual Technical Conference and
Exhibition, 27-29 October, Amsterdam, The Netherlands.
Egbe, T., Appah, D. (2005). Water Coning Diagnosis Using
Spectral Analysis. Nigeria Annual International Conference
and Exhibition, Nigeria.
Ghane Ezabadi, M., Ramli, A.S., Ataei, A., Tg Othamn, T. R.
(2015). Challenges in Modeling of High Clay Volume Gas Res-
ervoir with No Water Production. SPE/IATMI Asia Paci c Oil
& Gas Conference and Exhibition, 20-22 October, Nusa Dua,
Bali, Indonesia.
Hatzignatiou, D.G., Askarinezhad, R., Giske, N.H., Stavland, A.
(2016). Laboratory Testing of Environmentally Friendly Sodium
Silicate Systems for Water Management Through Conformance
Control. SPE Production & Operations, 31(4): 337-350.
Izwan Ismail,A.H., Ismail, I., Zoveidavianpoor, M., Mohsin,
R., Piroozian,A., Misnan, M.S., Sariman, M.Z. (2015) Experi-
mental investigation of oil–water two-phase ow in horizon-
tal pipes: Pressure losses, liquid holdup and ow patterns.
Journal of Petroleum Science and Engineering, 127: 409–
420.
Izwan Ismail,A.H., Ismail, I., Zoveidavianpoor, M., Mohsin,
R., Piroozian,A., Misnan, M.S., Sariman, M.Z. (2015). Review
of oil–water through pipes. Flow Measurement and Instru-
mentation, 45: 357–374.
Jin, L., Wojtanowicz, A.K. (2010). An Analytical Model for
Water Coning Control Installation in Reservoir With Bot-
tomwater. Journal of Canadian Petroleum Technology, 49 (5):
65-70.
Kamari, A., Mohammadi, A.H., Bahadori, A. (2016). On the
determination of breakthrough time for water coning phenom-
176 SIMULATION STUDY OF OIL PRODUCTION RATE AND WATER CONING IN OIL RESERVOIRS BIOSCIENCE BIOTECHNOLOGY RESEARCH COMMUNICATIONS

Dabiri, Karaei and Azdarpour
enon in oil reservoirs. Petroleum Science and Technology, 34
(1): 44-49.
Lakatos, I., Lakatos-Szabo, J., Szentes, G., Vago, A. (2014).
Restriction of Water Production in Gas Wells by Induced Phase
Inversion: Field Case Studies. SPE International Symposium
and Exhibition on Formation Damage Control, 26-28 Febru-
ary, Lafayette, Louisiana, USA.
Langaas, K., Hjellbakk, A. (2015). Integrated Reservoir Model-
ling of the Alvheim Field. SPE Bergen One Day Seminar, 22
April, Bergen, Norway.
Li, K., Liu, C., Zhang, C., Jiang, P., Lei, X., Gao, H., Jing, F.
(2016). A New Method for Estimating the Production Perfor-
mance of Water Flooding. SPE Asia Paci c Oil & Gas Confer-
ence and Exhibition, 25-27 October, Perth, Australia.
Liu, W., Bai, B. (2015). Swirl decay in the gas–liquid two-
phase swirling ow inside a circular straight pipe. Experi-
mental Thermal and Fluid Science, 68: 187–195.
Loh, W.L., Premanadhan, V.K. (2016). Experimental investiga-
tion of viscous oil-water ows in pipeline. Journal of Petro-
leum Science and Engineering, 147: 87–97.
Maurya, A.K., Mahto, V., Sharma, V.P., Laik, S. (2014) Study
of the Potential of Amino Resin to Control Excessive Water
Production in the Indian Oil elds. Petroleum Science and
Technology, 32 (12): 1443-1447.
Mohammed, S.A., Aggour, M., Fraim, M., Aboegila, A.,
Farooqui, M., Al-Kharaz, H., Ashkanani, M., Marmoush, M.
(2014) Development of an Online, Non-Intrusive Means for
Detecting Onset of Formation Water Production in Gas Flow
Lines. International Petroleum Technology Conference, 19-22
January, Doha, Qatar.
Moortgat, J.B., Firoozabadi, A. (2016). Water Coning, Water,
and CO
2
Injection in Heavy-Oil Fractured Reservoirs. SPE Res-
ervoir Evaluation & Engineering. Article in press: http://dx.
doi.org/10.2118/183648-PA.
Muktadir, G., Amro, M., Schramm, A. (2016). Review and
Applicability of Downhole Separation Technology. SPE Middle
East Arti cial Lift Conference and Exhibition, 30 November-1
December, Manama, Kingdom of Bahrain.
Pal, D., Mandal, G. (2015). Mixed convection–radiation on
stagnation-point ow of nano uids over a stretching/shrink-
ing sheet in a porous medium with heat generation and vis-
cous dissipation. Journal of Petroleum Science and Engineer-
ing, 126: 16–25.
Pang, Z., Cheng, L.S., Xu, J.F., Feng, R.Y. (2008). Application of
material balance method to nitrogen anti-water-coningtech-
nology. Petroleum Exploration and Development, 35 (2): 234-
238.
Permadi, P., Jayadi, T. (2010). An Improved Water Coning Cal-
culation for Horizontal Wells. SPE Russian Oil and Gas Confer-
ence and Exhibition, Moscow, Russia.
Qin, W., Wojtanowicz, A.K., Li, H. 2014. Improved Thermal
Heavy Oil Recovery from Strong Bottom-Water-Drive Res-
ervoir by Combining SAGD with Downhole Water Sink. SPE
International Heavy Oil Conference and Exhibition, 8-10
December, Mangaf, Kuwait.
Rozhko, A.Y.(2016). Two-phase uid- ow modeling in a dila-
tant crack-like pathway. Journal of Petroleum Science and
Engineering, 146: 1158–1172.
Yoshida, N., Hill, A.D. (2016) Comprehensive Modeling of
Downhole Temperature in a Horizontal Well with Multiple
Fractures. SPE Asia Paci c Hydraulic Fracturing Conference,
24-26 August, Beijing, China.
Zeinijahromi, A., Bedrikovetsky, P. (2016). Water Production
Control Using Low-Salinity Water Injection. SPE Asia Paci c
Oil & Gas Conference and Exhibition, 25-27 October, Perth,
Australia.
Zeinijahromi, A., Bedrikovetsky, P. (2015). Controlling Exces-
sive Water Production Using Induced Formation Damage. SPE
European Formation Damage Conference and Exhibition, 3-5
June, Budapest, Hungary.
Zeinijahromi, A., Al-Jassasi, H., Zhang, Y., Begg, S.H., Bedrik-
ovetsky, P. (2014). Edge-Water Drive Recovery Enhance-
ment by Induced Fines Migration. SPE Asia Paci c Oil &
Gas Conference and Exhibition, 14-16 October, Adelaide,
Australia.
Zemtsov, Y.V., Lytkin, A.E. (2016). Supplementary evaluation
of the ef ciency of water shutoff in production wells (Russian).
Oil Industry Journal, 2016(3): 102-104.
Zhao, H., Kang, Z., Zhang, X., Sun, H., Cao, L., Reynolds, A.C.
(2016) A Physics-Based Data-Driven Numerical Model for Res-
ervoir History Matching and Prediction With a Field Applica-
tion. SPE Journal, 21(6): 2175-2194.
BIOSCIENCE BIOTECHNOLOGY RESEARCH COMMUNICATIONS SIMULATION STUDY OF OIL PRODUCTION RATE AND WATER CONING IN OIL RESERVOIRS 177