
Chemical Engineering
Communication
Biosci. Biotech. Res. Comm. 10(1): 143-150 (2017)
Analysis of in ow performance relationship and
reservoir characteristics using Saphir software
Ali Shokri, Amin Azdarpour* and Bizhan Honarvar
Department of Petroleum Engineering, Marvdasht Branch, Islamic Azad University, Marvdasht, Iran
ABSTRACT
Petroleum production from the reservoir is initially occurs by the natural energy of the reservoir itself. The reservoir
pressure is usually high at the early stage of reservoir life, thus, it pumps crude oil to the surface. However, after
some time of production, reservoir pressure starts to decline. In addition, penetration of solid particles into the pores
causes plugging and results in formation permeability reduction. Hence, natural production from the reservoir starts
to decrease after some time, depending on pressure drop rate and the degree of damage to the formation. Well test-
ing is one of the practical methods for analysing the well. Pressure build up test is one of the most widely used well
testing methods for analysing the well. In this study, a pressure build up test was conducted for 24 hours and then
the pressure data were analysed using Saphir software. Finally, the well characteristics were used to analyse the
in ow performance relationship (IPR) of the well. The well testing results showed that the well suffers from high skin,
which hinders the effective production from the reservoir. In addition, IPR analysis using Vogel’s and Darcy’s method
showed that the absolute open ow (AOF) is affected by the skin factor. The resulted AOF was always higher without
the effect of skin factor included.
KEY WORDS: WELL TESTING, IPR, AOF, SAPHIR SOFTWARE, SKIN FACTOR
143
ARTICLE INFORMATION:
*Corresponding Author: amin.azhdarpour@miau.ac.ir;
aminazh22@gmail.com
Received 12
th
Dec, 2016
Accepted after revision 18
th
March, 2017
BBRC Print ISSN: 0974-6455
Online ISSN: 2321-4007 CODEN: USA BBRCBA
Thomson Reuters ISI ESC and Crossref Indexed Journal
NAAS Journal Score 2017: 4.31 Cosmos IF : 4.006
© A Society of Science and Nature Publication, 2017.
All rights reserved.
Online Contents Available at:
http//www.bbrc.in/

144 ANALYSIS OF INFLOW PERFORMANCE RELATIONSHIP AND RESERVOIR CHARACTERISTICS BIOSCIENCE BIOTECHNOLOGY RESEARCH COMMUNICATIONS
Shokri, Azdarpour and Honarvar
INTRODUCTION
Description of the dynamic behaviours of underground
formation containing hydrocarbons are one of the most
important challenges in oil and gas engineering. Thus,
detailed information regarding the reservoirs is required
to have a comprehensive knowledge about the current
and future reservoir performance. Effective permeability
of the reservoir, degree of the damage to the wellbore,
skin effect, average reservoir pressure, and fault descrip-
tion are the importance reservoir characteristics, which
should be identi ed for each well (Vaferi et al. 2009;
Gringarten, 2012; Hills et al. 2014; Shahbazi et al. 2016).
Well testing analysis was rst proposed in 1937 by
Muskat to evaluate hydrocarbon reservoir performance.
The general concept of the well testing is to create a
ow disturbance in the well and analysing the pressure
changes in the Bottomhole. Pressure build up and draw
down test are two of the most widely used well test-
ing methods to analyse well performance. During pres-
sure build up test, the well is shut in for a period of
time, thus, reservoir pressure starts to rise and build. In
a draw down test, the well is produced at a constant ow
rate for some time, during which reservoir pressure falls
down. The pressure data versus time are recorded and
analysed to predict the performance of the well. Appro-
priated well testing methods in which their main goal is
to have the best match between the recorded pressure
data and some ideal reservoir models can be used to
evaluate well performance (SadeghiBoogar and Masihi,
2010; Onur and Kuchuk, 2012; Ghaffarian et al. 2014;
Cho et al. 2013; Vaferi et al. 2015; Shahbazi et al. 2015).
Rosa and Horne (1997) investigated the disconti-
nuities in permeability in the reservoir using a cyclic
stimulation on an active well. The pulse was transmit-
ted through a well and the response was received from
another well. Different frequencies were generated as
the results of different pulse signals, which allowed the
possibility of investigating different extensions of the
reservoir. The main result of their investigation was an
equation to investigate the radius of cyclic in uence for
a given dimensionless frequency. Their study was later
continued by Ahn and Horne (2010) in 2010 by focusing
on different frequencies and phase data to analyse the
generic interwell permeability pro les.
The reservoir heterogeneities of a gas led and syn-
thetic eld was analysed by Fokker et al. (2012). They
used different pulse testing through both attenuation
and phase information, which last for several months.
Their results showed that the well testing provide valu-
able information on the current status of the well. In
addition, signi cant recommendations for improving
the overall performance of the well were made by ana-
lysing the well test results. Lin (2014) investigated a well
using ow rate pro le logging through pressure build
up and falloff test analysis. In this method, the wellbore
history was not used to investigate the reservoir per-
meability, skin factor, and formation pressure. Instead,
the ow rate data was gained from the ow test during
the production and using pressure build up and falloff
tests. In conventional well testing analysis, type curve
analysis, log-log plots and derivatives methods are used
to obtain the results, however this method reduced the
sequences of achieving nal results. Thus, skin factor
and reservoir permeability were achieved with high reli-
ability.
Rosario et al. (2016) used eld testing of conven-
tional and deconvolution methods to analyse pressure
build up tests. They mainly tested real-time sand face
rate measurements during the after ow periods. Their
analysis showed that deconvolution methods provide
much stronger results than the conventional methods.
However, real-time data acquisition quality was the
main factor affecting their reliability. In addition, they
concluded that to have a comprehensive and accurate
description of the reservoir, deconvolution methods
cannot be used solely and conventional methods are
required to be applied. In addition, the reliability of the
matching, permeability and skin factor determination
are improved using their techniques.
In this study, reservoir characteristics and perfor-
mance of an oil reservoir in west of Iran was studied
and analysed using rock and uid properties as well
pressure build up test. Since bubble point pressure of
the reservoir was close to the initial reservoir pressure of
the reservoir, Vogel’s method was used to analyse reser-
voir performance. The results were then compared with
the results achieved using Darcy’s method. Well testing
analysis was done using Saphir software.
MATERIALS AND METHODS
DESCRIPTION OF THE RESERVOIR MODEL
An oil reservoir located in west Iran was analysed
suing pressure build up test for 24 hours. Porosity of
the reservoir is 35% and net thickness of the productive
layer is about 65 ft. In addition, formation rock com-
pressibility is 2.7×10
-5
psi
-1
and total compressibility is
about 9.9×10
-6
psi
-1
. Table 1 represents other reservoir
properties.
WELL TESTING ANALYSIS
A pressure build up test was conducted on well number
1 for 24 hours. Then, the results of pressure data ver-
sus time as well as ow rates were used as an input to
be used in Saphir software. Other reservoir properties
BIOSCIENCE BIOTECHNOLOGY RESEARCH COMMUNICATIONS ANALYSIS OF INFLOW PERFORMANCE RELATIONSHIP AND RESERVOIR CHARACTERISTICS 145
Shokri, Azdarpour and Honarvar
including well radius, productive layer thickness, poros-
ity, type of uid, total compressibility, oil viscosity, and
reservoir temperature were added to the model. After
running the model, pressure and pressure derivative g-
ures on log-log scale and semi-log scale were produced
as the results of well testing analysis. The gures were
then analysed to determine the values of skin factor, res-
ervoir permeability, and initial reservoir pressure. After
determining the reservoir parameters, then reservoir
performance was analysed sing IPR/AOF section of the
software. The reservoir parameters and ow test results
were used to determine in ow performance relationship
(IPR) of the well. Finally, the IPR curves were used to
determine the absolute open ow (AOF) of the well using
two different methods of Darcy and Vogel.
RESULTS AND DISCUSSION
PRESSURE BUILD UP TEST ANALYSIS
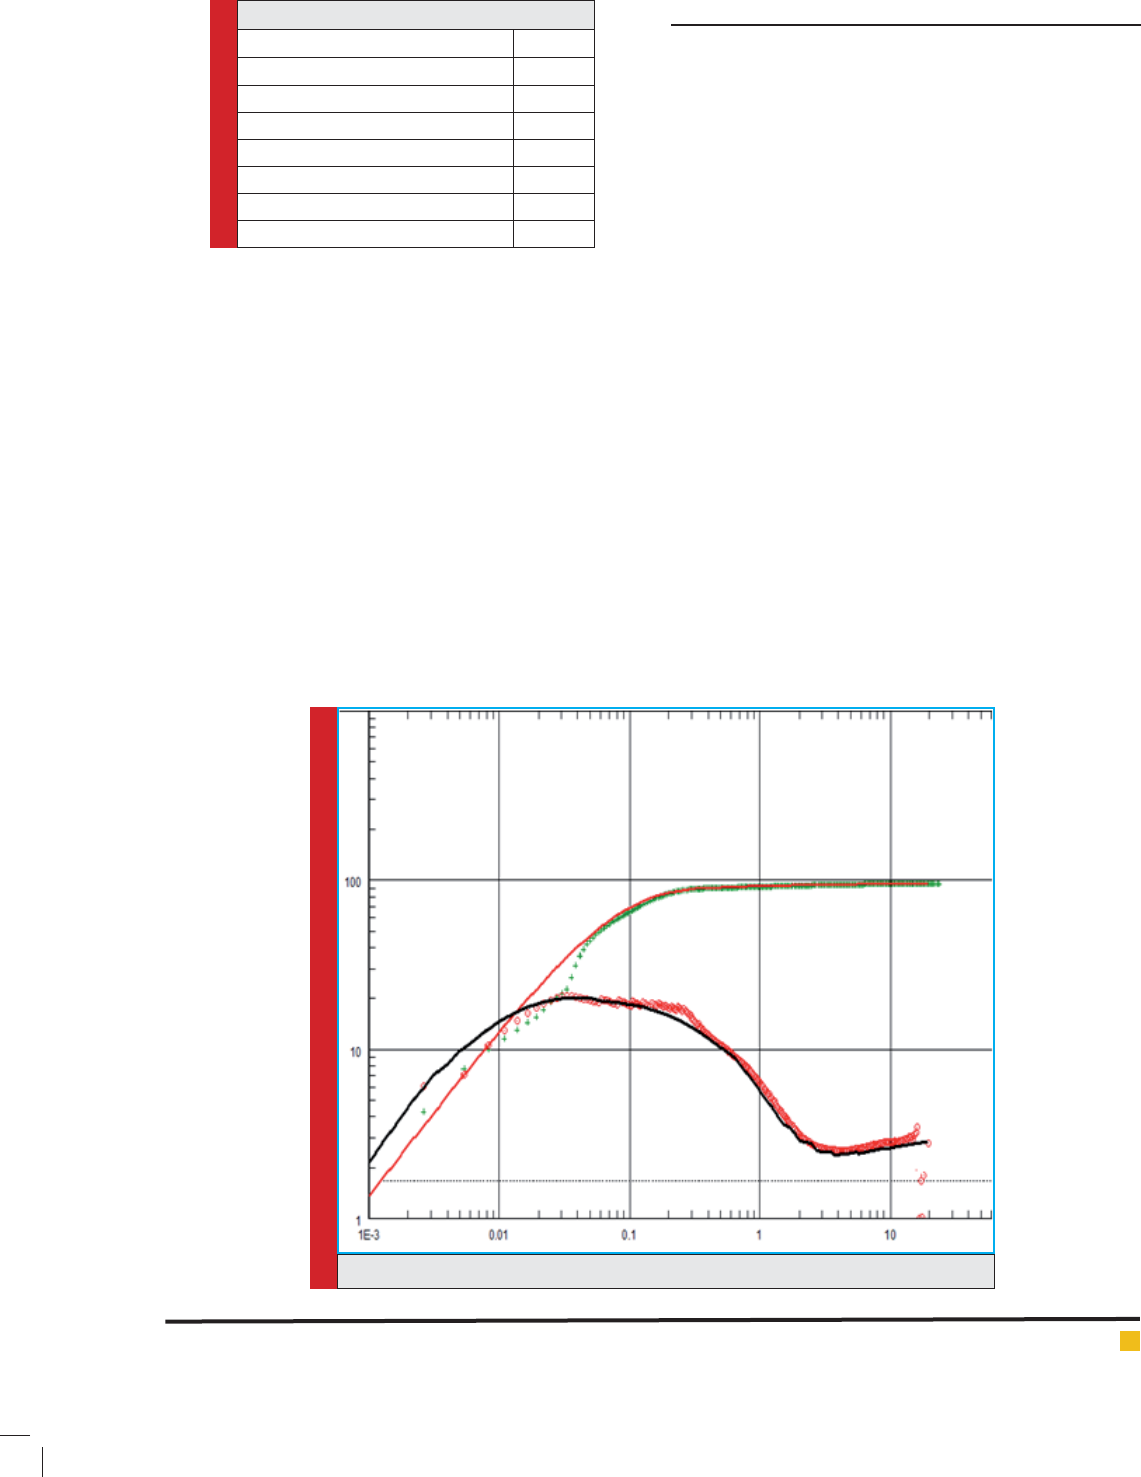
Figures 1 to 3 represent the log-log plot of pressure
data, semi-log plot of pressure data, and production his-
tory of the well, respectively. As shown in these gures,
perfect matches have taken from experimental results,
which prove the reliability of the simulation results. The
simulation results showed that the reservoir model in
this study is a homogenous reservoir with a fault at the
boundary of the reservoir. The presence of this fault in
the reservoir results in additional pressure drop in the
reservoir.
Table 2 represents the reservoir properties gained
from simulation results. As shown in this table, initial
reservoir pressure is about 1078 psi, which is below the
bubble point pressure of the reservoir (1399 psi). Thus,
this reservoir is a saturated oil reservoir with gas existed
in the reservoir. On the other hand, the reservoir produc-
tivity is about 15100 mD.ft and reservoir permeability
is about 233 mD and skin factor of the reservoir is 22.
The simulation results show that reservoir permeability
is high enough to deliver the uid from reservoir to the
wellbore, however on the other hand, the current condi-
tion of the well is not favourable in terms of production
since a high value of skin factor is achieved. A solution
to this problem could be acidizing of the well or hydrau-
Table 1. Reservoir properties
Properties Value
Connate water saturation 35%
Oil saturation 75%
Bubble point pressure (psi) 1399
Reservoir temperature (F) 130
Well radius (ft) 0.5
Oil viscosity (cP) 3
Oil formation volume factor (bbl/STB) 1.2
FIGURE 1. Log-log plot of pressure build up data.
146 ANALYSIS OF INFLOW PERFORMANCE RELATIONSHIP AND RESERVOIR CHARACTERISTICS BIOSCIENCE BIOTECHNOLOGY RESEARCH COMMUNICATIONS
Shokri, Azdarpour and Honarvar
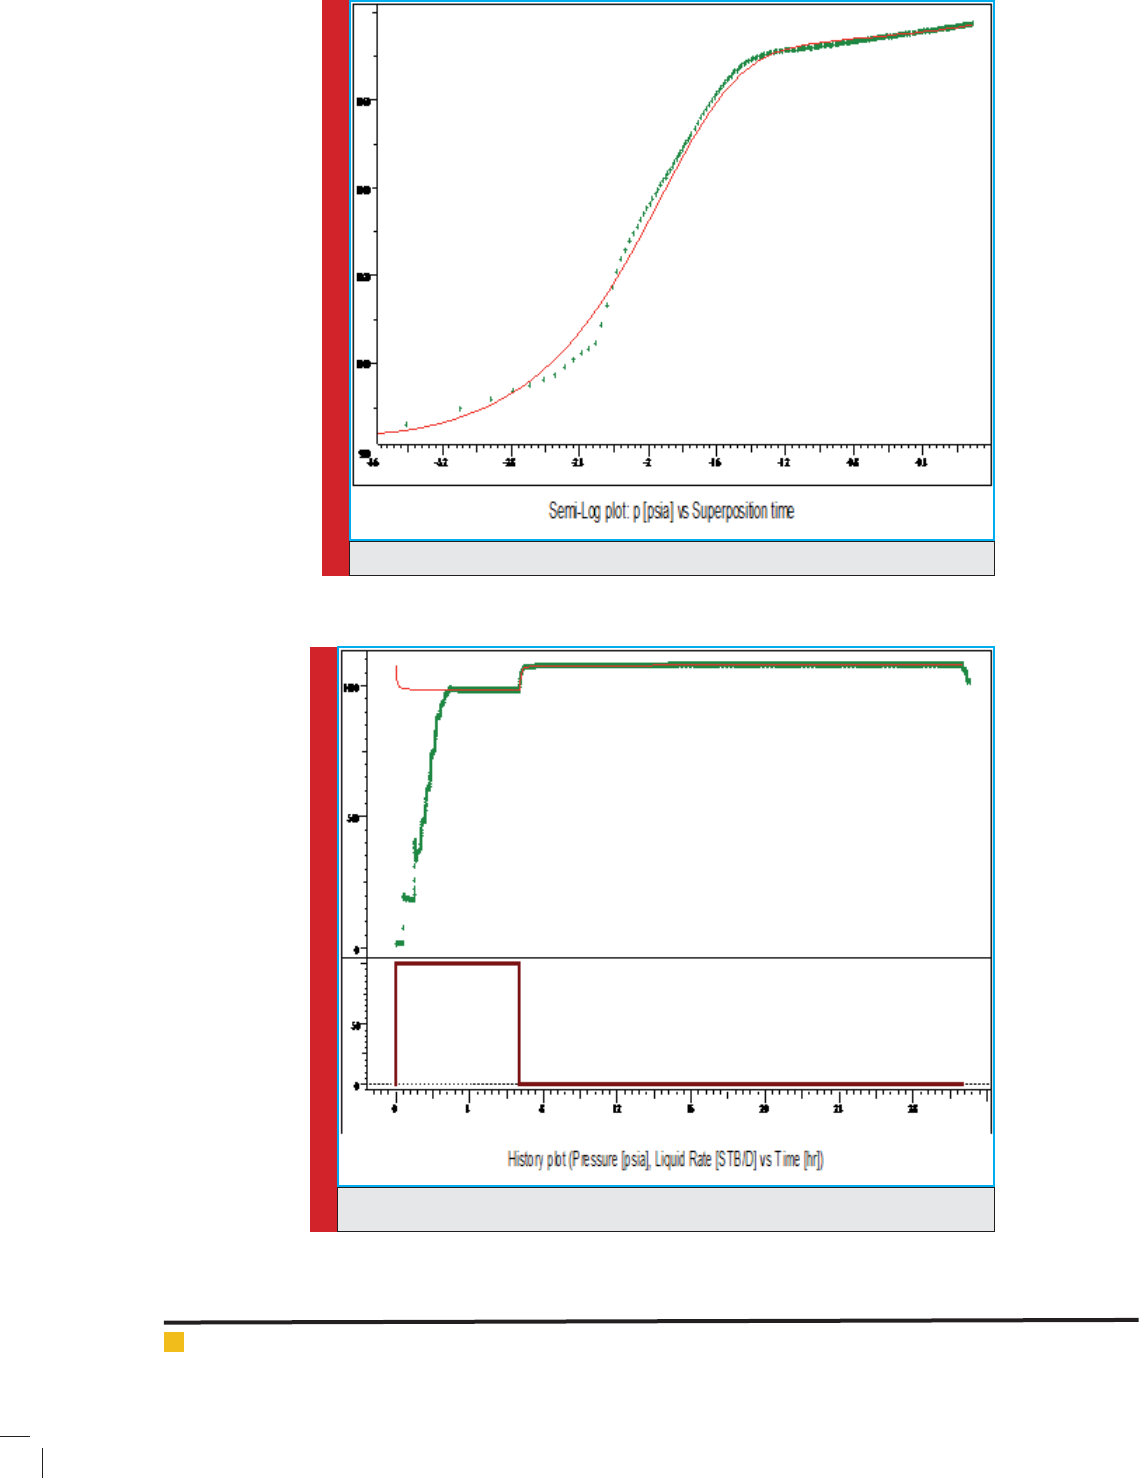
FIGURE 2. Semi-log plot of pressure build up data.
FIGURE 3. History plot of production rate and reservoir pressure in well number one.
BIOSCIENCE BIOTECHNOLOGY RESEARCH COMMUNICATIONS ANALYSIS OF INFLOW PERFORMANCE RELATIONSHIP AND RESERVOIR CHARACTERISTICS 147
Shokri, Azdarpour and Honarvar
lic fracturing to remove the scales inhibiting the uid
ow to the surface (Guo et al. 2014, Ghommem et al.
2015 and Zhou et al. 2016).
INFLOW PERFORMANCE RELATIONSHIP (IPR)
OF THE WELL USING DARCY METHOD
A ow test with ow rate of 1600 STB/day and Bottom-
hole owing pressure of 450 psi was conducted on well
number one. Initially, the IPR curve is assumed to be
linear, where the slope is productivity index (PI) inverse.
Then, IPR curve was analysed in two different cases of
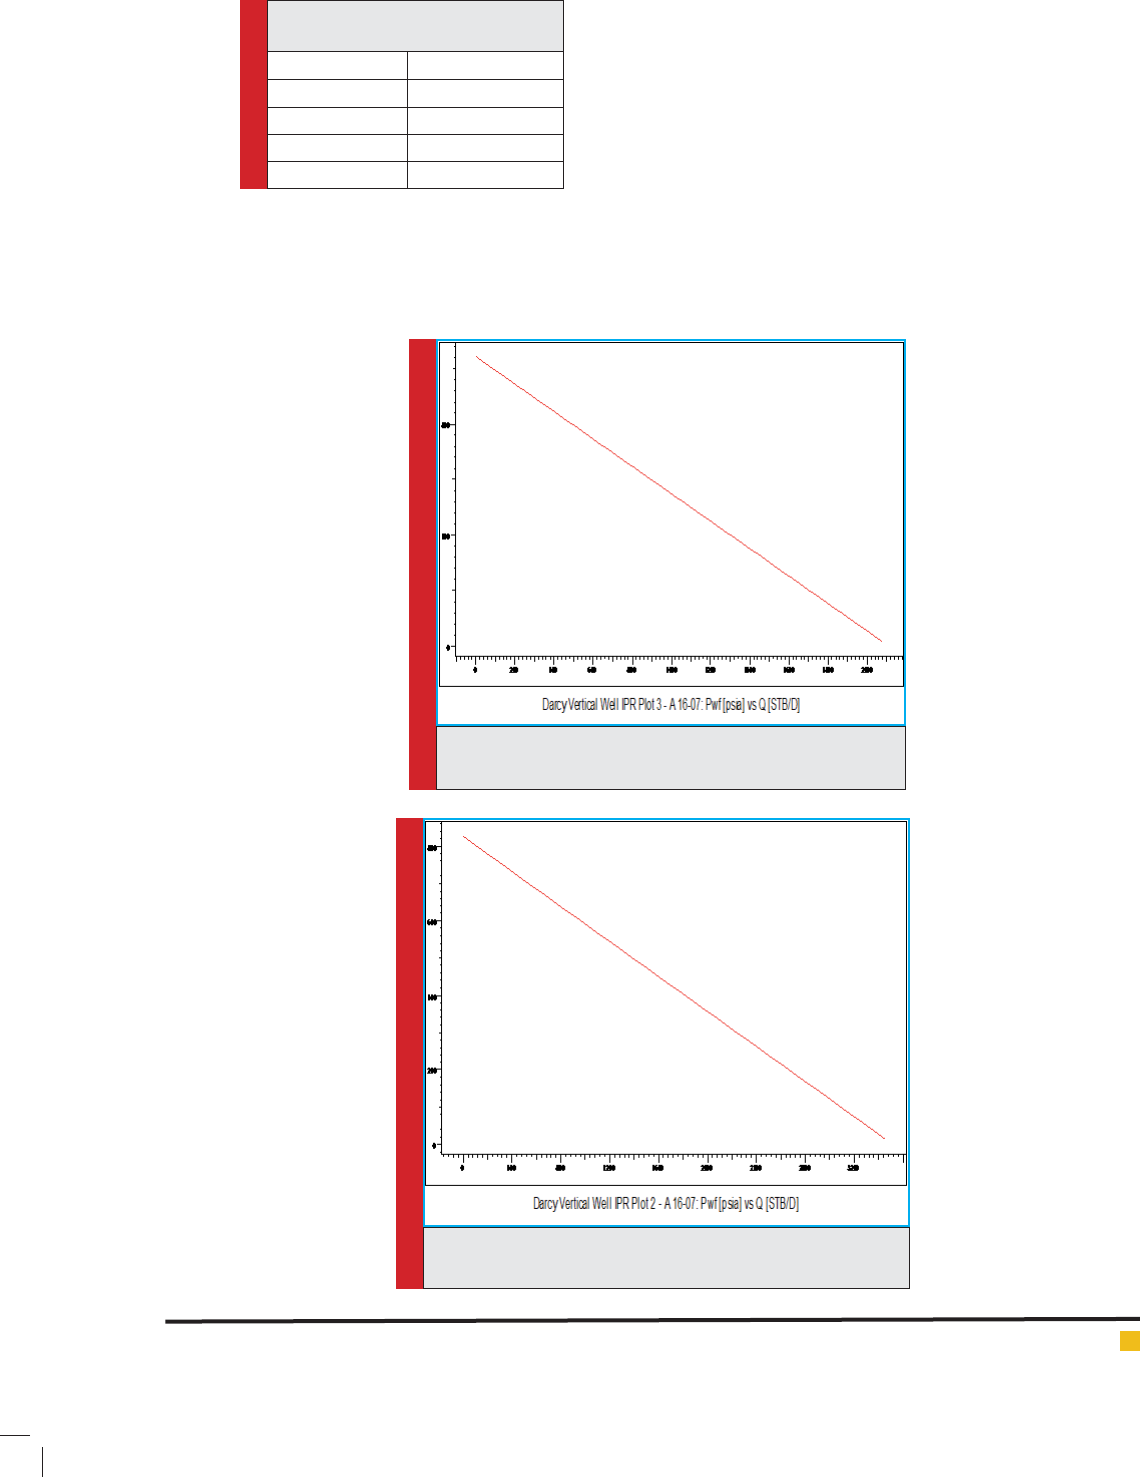
skin factor of 22 and 0. Figures 4 and 5 represent the IPR
curves when skin factor is 22 and 0, respectively.
As shown in these gures, there is a big dif-
ference between the maximum producing ow rates
with and without skin factor. Table 3 summarizes the
Table 2. Reservoir simulation results
from Saphir software
Properties Value
Pi 1078 psi
kh 15100 mD.ft
k 233 mD
Skin 22
FIGURE 4. IPR plot of well number one with skin factor
included using Darcy’s method.
FIGURE 5. IPR plot of well number one without the effect of
skin factor using Darcy’s method.
148 ANALYSIS OF INFLOW PERFORMANCE RELATIONSHIP AND RESERVOIR CHARACTERISTICS BIOSCIENCE BIOTECHNOLOGY RESEARCH COMMUNICATIONS
Shokri, Azdarpour and Honarvar
IPR results achieved with and without skin factor in this
study. As shown in this table, the maximum producing
ow rate (AOFP) with skin is about 2081 STB/day while
the value is 3454 STB/day without the effect of skin fac-
tor. On the other hand, productivity index o0f the well is
1.02 and 4.25 STB/day/psi with and without skin factor,
respectively. This suggest that skin factor has a detri-
mental impact on producing ow rate and productivity
of the well, which must be solved for high production
rates (Mahdiyar et al. 2011; Luo et al. 2016).
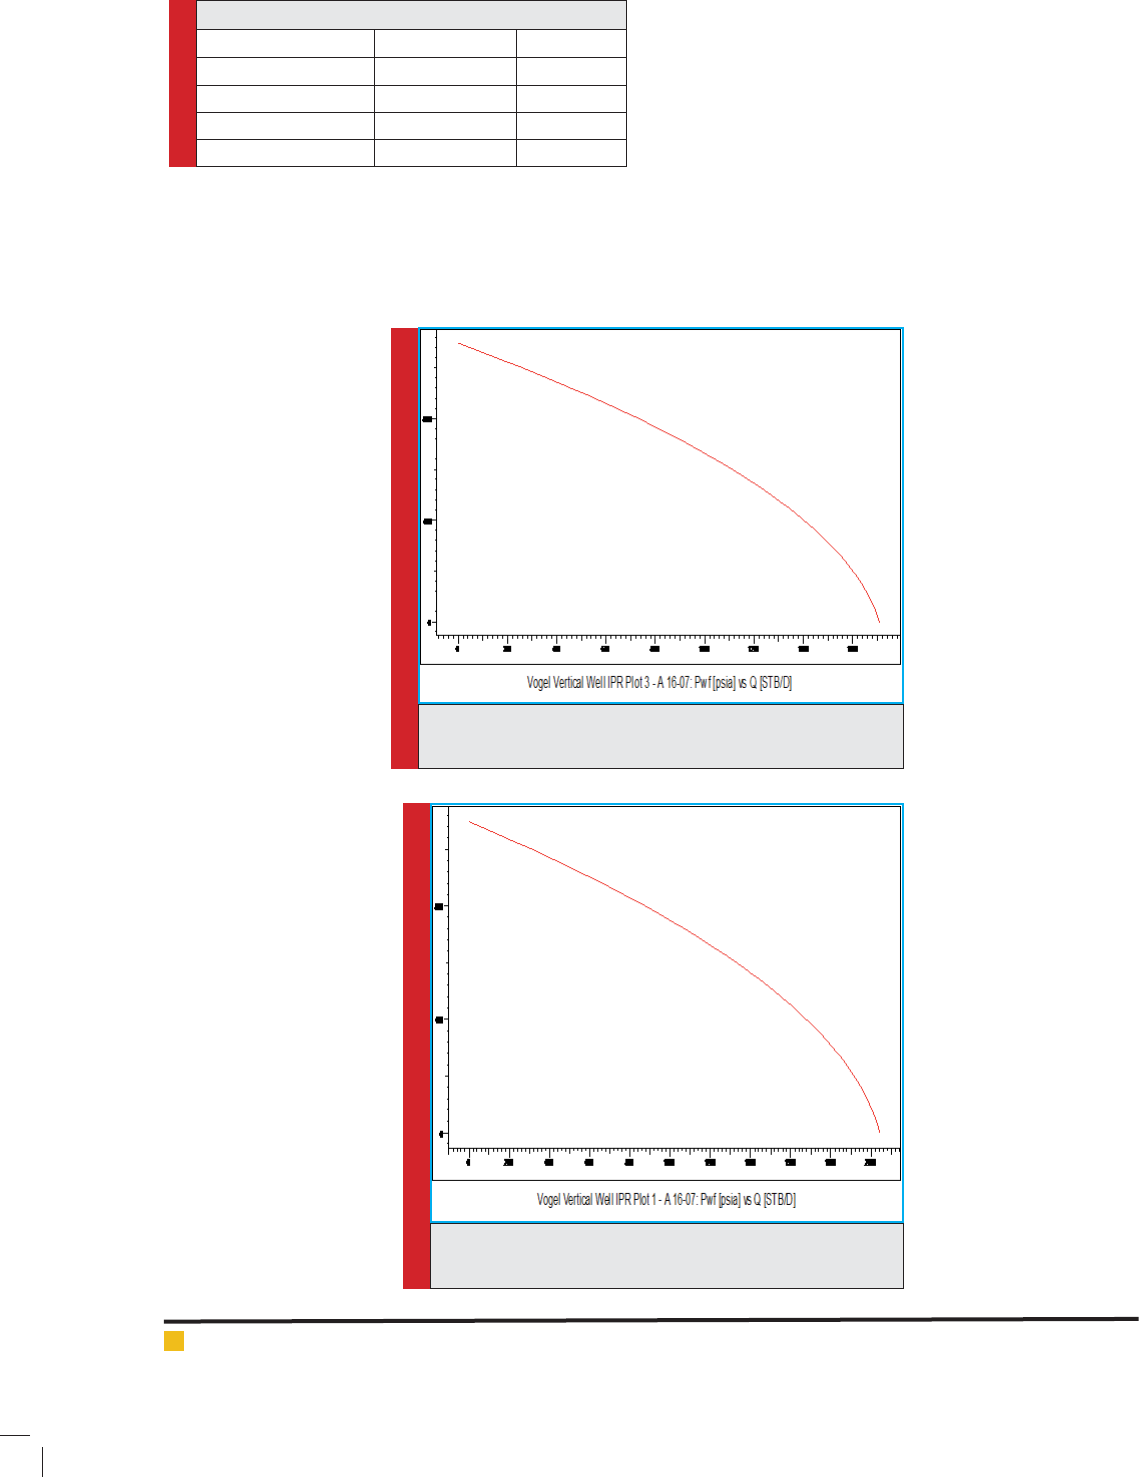
INFLOW PERFORMANCE RELATIONSHIP (IPR)
OF THE WELL USING VOGEL METHOD
Since reservoir pressure is close to the bubble point pres-
sure of the reservoir and reservoir is saturated, Darcy’s
method cannot be used for analysing the well perfor-
Table 3. IPR results with and without skin factor
Parameter Value Skin factor
AOFP 2081 STB/day 22
AOFP 3454 STB/day 0
Productivity index (PI) 1.02 STB/day/psi 22
Productivity index (PI) 4.25 STB/day/psi 0
FIGURE 6. IPR plot of well number one with skin factor
included using Vogel’s method.
FIGURE 7. IPR plot of well number one without the effect of
skin factor using Vogel’s method.

BIOSCIENCE BIOTECHNOLOGY RESEARCH COMMUNICATIONS ANALYSIS OF INFLOW PERFORMANCE RELATIONSHIP AND RESERVOIR CHARACTERISTICS 149
Shokri, Azdarpour and Honarvar
mance. Thus, Vogel’s method should be skin effect.
These results suggest that skin factor has negative effect
on production rate, which reduces it signi cantly. Thus,
methods of skin removal such as acidizing and hydraulic
fracturing are of great importance (Dehghan et al. 2015
Yegin et al. 2016 and Sobhaniaragh et al. 2016).
CONCLUSION
The well testing analysed through pressure build up test
showed that the reservoir is a homogenous reservoir
bounded with an impermeable fault. The value of skin
factor in this reservoir is too high, which impeded the
natural production from the well. This negative impact
of skin factor could be solved through acidizing of
hydraulic fracturing of the well. The reservoir perme-
ability is high enough to deliver suf cient uid from
the reservoir to the wellbore, however the lift to the sur-
face requires addition support by skin removal. Darcy’s
method can be used when bubble point pressure and
reservoir pressure are not close, which results in linear
IPR. However, when the values of pressures are close
to each other, then Vogel’s method should be used to
analyse the well performance. In this case, the IPR is no
longer linear and it is curvature.
ACKNOWLEDGEMENTS
The authors would like to appreciate the Department of
Petroleum Engineering, Marvdasht Branch, Islamic Azad
University, Marvdasht, Iran for the provision of the lab-
oratory facilities necessary for completing this work.
REFERENCES
Ahn, S. and Horne, R. N. (2010). A New Look at Nonlinear
Regression in Well-Test Interpretation.Presented at the SPE
Annual Technical Conference and Exhibition, Florence, Italy,
19–22 September.
Cho, Y., Apaydin, O.G., Ozkan, E. (2013). Pressure-Dependent
Natural-Fracture Permeability in Shale and its Effect on Shale-
Gas Well Production. SPE Reserv. Eval. Eng. 16 (02), 216–228.
Dehghan, A.N., Goshtasbi, K., Ahangari, K., Jin, Y. (2015).
Mechanism of fracture initiation and propagation using a
tri-axial hydraulic fracturing test system in naturally frac-
turedreservoirs. European Journal of Environmental and Civil
Engineering, 20 (5), 560-585.
Fokker, P. A., Borello, E. S., Serazio, C., Verga, F. (2012). Esti-
mating Reservoir Heterogeneities From Pulse testing. J. Pet.
Sci. Eng. 86–87, 15-26.
Ghaffarian, N., Eslamloueyan, R., Vaferi, B. (2014). Hydrocar-
bon reservoir model detection from pressure transient data
using coupled arti cial neural network—Wavelet transform
approach. J. Pet. Sci. Eng. 23, 20–29.
Ghommem, M., Zhao, W., Dyer, S., Qiu, X., Brady, D. (2015).
Carbonate acidizing: Modeling, analysis, and characterization
of wormhole formation and propagation. Journal of Petroleum
Science and Engineering,131,18-33.
Gringarten, A.G. (2012). Well Test Analysis in Practice. Society
of Petroleum Engineers Way Ahead Journal 8, 2.
Guo, J., Liu, H., Zhu, Y., Liu, Y. (2014).
Effects of acid–rock
reaction heat on uid temperature pro le in fracture during
acid fracturing in carbonate reservoirs. Journal of Petroleum
Science and Engineering,122,31-37.
Hills, J., Lines, J., Baranauskas, E., Mapp, J., Bagnall, A. (2014).
Classi cation of time series by shapelet transformation. Data
Min. Knowl. Discov. 28 (4), 851–881.
Lin, J.E. (2014). Pressure Buildup or Falloff Test Analysis for
a Well in Commingled Reservoirs with Flow Rate Pro le Log-
ging. Presented at the International Petroleum Technology
Conference, 10-12 December, Kuala Lumpur, Malaysia.
Luo, W., Wang, X., Feng, Y., Tang, C., Zhou, Y. (2016). Produc-
tivity analysis for a vertically fractured well under non-Darcy
ow condition.Journal of Petroleum Science and Engineer-
ing,146,714-725.
Mahdiyar, H., Jamiolahmady, M., Sohrabi, M. (2011). Improved
Darcy and non-Darcy ow formulations around hydraulically
fractured wells. Journal of Petroleum Science and Engineer-
ing,78, 149-159.
Onur, M., Kuchuk, F.J. (2010). A New Pressure-Rate Deconvo-
lution Technique Based on Pressure Derivatives for Pressure
Transient Test Interpretation. SPE J. 17, 307–320.
Rosa, A. J. and Horne, R. N. (1997). Reservoir Description by
Well Test Analysis Using Cyclic Flow Rate Variation. SPE Form
Eval 12 (4): 247–254.
Rosario, O., Martinez, M., Baumann, C. (2016). Applied Buildup
Well Test Interpretation: Field Testing of Conventional and
Deconvolution Methods.Presented at the SPE International
Conference and Exhibition on Formation Damage Control,
24-26 February, Lafayette, Louisiana, USA.
SadeghiBoogar, A., Masihi, M. (2010). New technique for cal-
culation of well deliv-erability in gas condensate reservoirs J.
Nat. Gas Sci. Eng. 2, 29–35.
Shahbazi, Sh., Maarefvand, P., Gerami, Sh. (2016).
Transient
pressure test analysis of horizontal wells in gas condensate
reservoirs: Evaluation of conventional multi-phase pseudo-
pressure solutions. Journal of Petroleum Science and Engi-
neering, 145, 668–688.
Shahbazi, S., Maarefvand, P., Gerami, S. (2015). Investigation
on flow regimes and non-Darcy effect in pressure test analysis
of horizontal gas wells J. Pet. Sci. Eng.129, 121–129.
Sobhaniaragh, B., Mansur, W.J., Peters, F.C. (2016). Three-
dimensional investigation of multiple stage hydraulic fractur-
ing in unconventional reservoirsJournal of Petroleum Science
and Engineering,146,1063-1078.

150 ANALYSIS OF INFLOW PERFORMANCE RELATIONSHIP AND RESERVOIR CHARACTERISTICS BIOSCIENCE BIOTECHNOLOGY RESEARCH COMMUNICATIONS
Shokri, Azdarpour and Honarvar
Vafaei, M.T., Eslamloueyan, R., Ayatollahi, Sh. (2009). Simula-
tion of steam distillation process using neural networksChemi-
cal Engineering Research and Design, 87(8), 997–1002.
Vaferi, B., Eslamloueyan, R., Ayatollahi, Sh. (2015). Applica-
tion of recurrent networks to classi cation of oil reservoir
models in well-testing analysis.Energy Sources A 37, 174–180.
Yegin, C., Zhang, M., Varsha Talari, J., Akbulut, M. (2016).
Novel hydraulic fracturing uids with improved proppant car-
rying capacity and pH-adjustable proppant deposition behav-
iour. Journal of Petroleum Science and Engineering,145,600-
608.
Zhou, Z., Abass, H., Li, X., Bearinger, D., Frank, W. (2016).
Mechanisms of imbibition during hydraulic fracturing in
shale formations. Journal of Petroleum Science and Engineer-
ing,141,125-132.